Enabling African Trade:
Findings from the Enabling
Trade Index
MARGARETA DRZENIEK HANOUZ CAROLINE KO
World Economic Forum
past 10 years and have weathered the global economic crisis rather favorably compared with other emerging economies. Yet, as discussed in Chapter 1.1, the level of gross domestic product (GDP) per capita and the pace of GDP growth have not reached levels found in other regions, such as developing Asia. From 2002 to 2012, GDP growth in developing Asia was on average 8.5 percent, while sub-Saharan Africa experienced growth rates of 5.7 percent. 1 A key difference between these two regions is their participation in global trade and investment flows. While trade in developing Asia more than doubled between 1995 and 2010, trade in sub-Saharan Africa over the same period remained at below 2 percent of total world trade. 2 Two distinct observations are of particular importance when discussing Africa’s trade performance: the export base of most countries is undiversified, and regional integration is extremely low. THE STATE OF AFRICAN EXPORTS
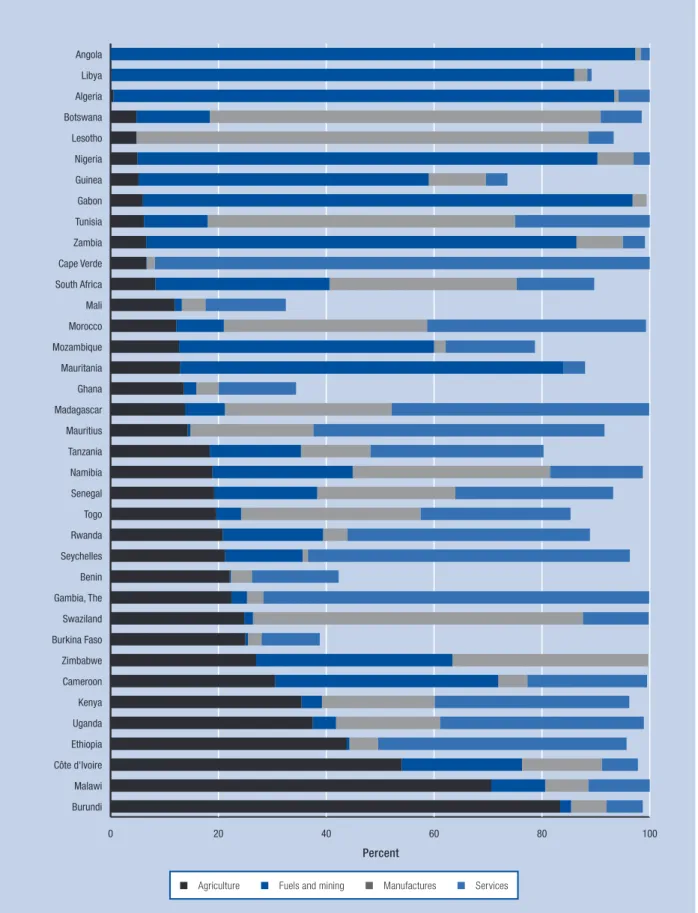
Despite efforts aimed at diversifying the export base, African exports remain highly focused on commodities. Fuels and mining products account for over half of sub-Saharan exports, compared with only about 10 percent for developing Asia and advanced economies. Indeed, when broken down to the country level, the share of mineral products accounts for more than 30 percent of total exports in more than half of all African economies, and for over 90 percent in a few cases (see Figure 1). 3 High dependence on commodity exports means that terms of trade fluctuate with commodity prices, which may have a negative effect on the country’s growth. Government finances also fluctuate with commodity prices, possibly jeopardizing governments’ fiscal stability and leeway. In sub-Saharan Africa alone, for example, 10 economies are fiscally dependent on natural resources. 4 In contrast, another set of countries—including
Burundi, Côte d’Ivoire, Ethiopia, and Malawi—are highly dependent on agricultural exports (see Figure 2). Against this backdrop, export diversification—both in goods and services and also across geographies—is key to raising Africa’s resilience to external shocks.
Many regional trading initiatives have been launched on the continent over the last several decades, yet Africa’s markets remain poorly connected with each other. The share of Africa’s intra-regional goods trade in total goods exports is just 12 percent, compared with 25 percent in the Association of Southeast Asian Nations, 65 percent in the European Union, and 49 percent in the North American Free Trade Agreement bloc in 2011, 5 although these estimates probably underreport the actual volume of trade because of the high levels of unregistered cross-border activity. Survey results suggest that informal border flows may comprise up to 90 percent of trade. 6
Finally, regional integration is closely linked to food security and poverty reduction. Because of their
Figure 1: Exports of mineral products as a share of total exports, 2006–10 average 0 20 40 60 80 100 Malawi Ethiopia Mali Somalia Mauritius Ghana Swaziland Cape Verde Burundi Uganda Kenya Djibouti Madagascar Morocco Togo Mozambique Tanzania Liberia South Africa Lesotho Zimbabwe Senegal Côte d'Ivoire Namibia Seychelles Rwanda Benin Egypt Gambia, The Central African Rep. Niger Sierra Leone Cameroon Congo, Dem. Rep. Mauritania Guinea Burkina Faso Botswana Gabon Sudan Rep. Congo Nigeria Chad Equatorial Guinea Libya Algeria Angola
Source: ITC, April 2012.
Figure 2: Export share in total exports by category, 2010 0 20 40 60 80 100 Burundi Malawi Côte d'Ivoire Ethiopia Uganda Kenya Cameroon Zimbabwe Burkina Faso Swaziland Gambia, The Benin Seychelles Rwanda Togo Senegal Namibia Tanzania Mauritius Madagascar Ghana Mauritania Mozambique Morocco Mali South Africa Cape Verde Zambia Tunisia Gabon Guinea Nigeria Lesotho Botswana Algeria Libya Angola
Source: Authors’ calculations, based on data from the World Trade Organization’s Statistical Database, Time Series on Merchandise and Commercial Services 2000–2011.
Notes: Chad, Liberia, and Sierra Leone do not report data on their merchandise breakdown. Note that the sum of shares does not necessarily add up to 100 because the world total merchandise trade includes other commodities and transactions that are not part of the three main commodity groups—agriculture, fuels and mining, and manufacturing. These commodities are gold, arms and ammunition, and commodities and transactions not classified elsewhere (following the United Nations Statistics Division standard international trade classification (SITC) Rev.3, section 9). Chad, Liberia, and Sierra Leone do not report data on their merchandise breakdown. Data in Figure 2 may not exactly match Figure 1. For example, more than two-thirds of exports in Botswana are pearls and precious stones, classified as mineral exports in Figure 1 and manufactures in Figure 2.
Percent
high transaction costs and consequent low regional integration, African economies import agricultural products from global markets instead of from within their own regions. Indeed, according to a recent World Bank report, African farmers produce a mere 5 percent of Africa’s cereal imports. 7 With the market of food staples and production estimated at US$50 billion per year, or three-quarters of the total agricultural output, this means that enormous growth opportunities remain unexploited. 8 This large share of non-African staple imports exposes African economies to volatile food prices. This exposure not only affects the income of the poor, who need to spend a higher income share on basic food supply, but also adversely affects macroeconomic stability through rising inflation, as was seen in East Africa in 2011 and early 2012. Furthermore, because they are small buyers, most African economies have only limited bargaining power to negotiate prices on a global scale. Regional integration is, thus, key to feeding Africa’s growing population in a sustained fashion by facilitating trade from food-abundant areas to areas with a food deficit. AFRICA’S POOR REGIONAL INTEGRATION: CAUSES AND PRIORITIES
In view of the benefits to be had, why is Africa’s regional integration so poor? The reasons are complex and many. Historically, most countries have been geared toward trade with developed economies. Policies, measures, and investments were often focused on improving access to developed-country markets because of the high demand in those countries. At the same time, regional integration efforts on the continent were usually not fully implemented, so many barriers between regional markets remain in place. 9 One factor, as discussed in subsequent chapters in this Report, is Africa’s pronounced infrastructure deficit, which is particularly pertinent for connecting markets within Africa (see Chapter 2.2 for a more detailed discussion).
Trade policies, as well as the institutional and regulatory environment, also need to be taken into account. World Bank data show that in sub-Saharan Africa it takes an average of 37 days to import goods and 31 days to export, compared with less than 20 days to export and to import in North Africa, Latin America, and Southeast Asia. The problem is even more pronounced for landlocked Africa, where it takes an average of almost 50 days to import and 40 days to export. 10 Other factors, such as border corruption and multiple road blocks, are a further impediment. For example, a truck driver on the Koutiala–Dakar corridor between Mali and Senegal has to pass through almost 100 checkpoints and border posts and is required to pay about US$437 in bribes along the route. 11 In Mali, on the Bamako–Ouagadougou route, every 100 kilometers drivers have to face about 4.5 checkpoints and have to pay about US$25 in bribes. 12 Furthermore, non-tariff measures (NTMs) in the form of quotas, Box 1: Priorities for deepening regional trade
integration in Africa
Although Africa’s exports have grown significantly over the past decade and its trade has started to recover from the global financial crisis, the impact of this growth on unemployment and poverty has been disappointing for many African countries. This situation reflects export growth that is typically fueled by a limited number of mineral and primary commodities that have only narrow impacts on the wider economy, and formal sectors that remain small.
The key trade objectives for Africa, therefore, are to diversify the export base and to implement policies that allow more people to benefit from trade. Increasing and more youthful populations heighten the need for more inclusive and employment-intensive trade and offer a real opportunity for Africa to harness a significant potential comparative advantage that can drive productivity growth over a sustained period.
Effective regional integration in Africa would play a key role in delivering more diverse, inclusive, and sustained trade growth. With African leaders now calling for a continental free trade area by 2017 to boost trade and investment, a recent World Bank report shows that countries are losing out on billions of dollars in potential trade every year because of high trade barriers with their own neighbors, and that it is often easier for Africa to trade with the rest of the world than with itself. 1 According to the report De-Fragmenting Africa: Deepening Regional Trade Integration in Goods and Services, there are enormous opportunities for increased cross-border trade in food products, basic manufactures, and services and for a larger regional market to provide a springboard to global competitiveness in a wider range of products to reach a larger number of markets. However, these benefits are not being realized because the regional market is fragmented and cross-border production networks that have spurred economic dynamism in other regions, especially East Asia, have yet to materialize in Africa.
To reduce fragmentation, three main changes are needed:
• Improve conditions for cross-border trade, especially those faced by small traders—many of whom are women—by simplifying border procedures, limiting the number of agencies at the border, and increasing the professionalism of officials.
• Remove non-tariff barriers to trade such as restrictive rules of origin, import and export bans, and onerous and costly trade-licensing procedures.
• Streamline regulations and immigration rules that limit the potential for cross-border trade and investment in both goods and services.
Regional integration is a core element in both the World Bank’s Africa Strategy and its Trade Strategy, which are designed to help countries create trade opportunities for their transformation and sustained growth. The World Bank doubled its support for regional integration from US$2.1 billion in 2008 to US$4.2 billion in 2011, and increased it further to US$5.7 billion in 2012. Source: Contributed by the World Bank, International Trade
Department.
Note
charges, discriminatory labeling, and health and sanitary regulations play an important role in undermining trade the region. Although data on NTMs are generally scarce, a recent study by the World Bank puts a price tag to their costs and shows that NTMs affected one-fifth of regional exports, or US$3.3 billion of regional trade in 2008 in Southern African Development Community (SADC) countries. Assuming that NTMs are equivalent to a 40 percent ad valorem tariff, this amounts to an estimated cost of US$1.3 billion per year. 13 Finally, crossing borders does not affect only goods and services, but also people. The lack of physical security when crossing borders, for instance, plays a critical role, particularly for women traders in the Great Lake region.
The following analysis of the results of the Enabling Trade Index (ETI) sheds additional light on the key barriers that prevent Africa from reaping the full benefits of international trade. Although the ETI does not permit an analysis of barriers to regional integration, it does indicate the barriers and enablers that exporters and importers in each country face, and thereby informs policy choices. Box 1 complements the analysis by identifying priority action areas that have been identified by the World Bank for enhancing regional integration. USE OF THE GLOBAL ENABLING TRADE REPORT
The Global Enabling Trade Report (GETR) has become a widely used reference since its introduction in 2008. It forms part of the toolbox of many countries in their efforts to increase trade, and it helps companies with their investment decisions. The Report is also the basis for many high-level public-private dialogues facilitated around the world each year by the World Economic Forum. These dialogues focus on practical steps that can be taken by both governments and the private sector to overcome particular trade barriers in a country or region. In building a coalition for change, it has become evident that establishing an “open borders” mindset in a joint and holistic effort to tackle obstacles to the movement of both goods and people is often the most effective approach.
THE ENABLING TRADE INDEX
The ETI was developed within the context of the World Economic Forum’s Industry Partnership Programme for the Supply Chain and Transport Industry, and was first published in the 2008 GETR. A number of Data Partners have collaborated in this effort: the Global Express Association (GEA), the International Air Transport Association (IATA), the International Trade Centre (ITC), the United Nations Conference on Trade and Development (UNCTAD), The World Bank, the World Customs Organization (WCO), and the World Trade Organization (WTO). We have also received significant input from companies that are part of this industry partnership program, namely Agility, Brightstar, Deutsche Post DHL, DNB Bank ASA, FedEx Corp., A.P. Möller
Maersk, the Panama Canal Authority, Royal Vopak, Stena AB, Swiss International Air Lines, Transnet, UPS, Volkswagen, and AB Volvo.
The ETI measures the extent to which individual economies have developed institutions, policies, and services facilitating the free flow of goods over borders and to destination. 14 The structure of the Index reflects the main enablers of trade, breaking them into four overall issue areas, captured in the subindexes:
1. The market access subindex measures the extent to which the policy framework of the country allows foreign goods into the economy and enables access to foreign markets for its exporters.
2. The border administration subindex assesses the extent to which the administration at the border facilitates the entry and exit of goods.
3. The transport and communications infrastructure subindex takes into account whether the country has in place the transport and communications infrastructure necessary to facilitate the movement of goods within the country and across the border.
4. The business environment subindex looks at the quality of governance as well as at the overarching regulatory and security environment impacting the business of importers and exporters active in the country.
Each of these four subindexes is composed in turn of a number of pillars of enabling trade, of which there are nine in all. These are:
1. Domestic and foreign market access 2. Efficiency of customs administration 3. Efficiency of import-export procedures 4. Transparency of border administration
5. Availability and quality of transport infrastructure 6. Availability and quality of transport services 7. Availability and use of ICTs
8. Regulatory environment 9. Physical security
Each of these pillars is made up of a number of individual variables. The dataset includes both hard data and survey data from the World Economic Forum’s Executive Opinion Survey (the Survey). The hard data were obtained from publicly available sources and international organizations active in the area of trade (such as IATA, the ITC, the International Telecommunication Union (ITU), UNCTAD, the UN, and the World Bank). The Survey is carried out annually by the World Economic Forum in all economies covered by our research. 15 It captures the views of top business executives on the business environment and provides unique data on many qualitative aspects of the broader
business environment, including a number of specific issues related to trade. For detailed descriptions of all the indicators included in the ETI, please see Appendix C.
The nine pillars are grouped into the four subindexes described above, 16 as shown in Figure 3, and the overall score for each country is derived as an unweighted average of the subindexes. 17 The details of the composition of the ETI are shown in Appendix A. It is important to note that, although the pillars are separated out in the Index for presentational purposes, they are intrinsically linked. For example, the regulatory environment is linked to transparency at the border and the availability of transport services, as it contains data on the level of competition in a country. Furthermore, the use of ICTs has an impact on the efficiency of border administration, as ICTs have proven instrumental for making border clearance more efficient.
As econometric tests of the ETI 2009 demonstrated, the ETI has explanatory power with respect to a
country’s trade performance. 18 The analysis has shown that a 1 percent increase in the ETI score in an exporting country is associated with an increase of 1.7 percent in that country’s exports. This effect is even higher with respect to an importing country: the model predicts that a 1 percent improvement in an importer’s ETI score would lead to a 2.3 percent rise in imports. Taken together, these two effects predict that a 1 percent increase in the average ETI score of any given country
pair would be associated with a 4 percent increase in bilateral trade, all else being equal.
Country coverage
Overall, the 2012 edition of the GETR covers 132 economies and 31 African countries, of which three are in North Africa. In an effort to expand country coverage, two new African countries were added to the Index (Angola and Rwanda) as new data became available. Although Tunisia was covered in the GETR 2012, it was excluded from The Global Competitiveness Report 2012–2013 because of a structural break in the data. To remain consistent with this decision, we do not report or discuss data on Tunisia in this chapter. As Libya was not covered in the ETI 2012 because of lack of data, the North Africa average reported below is composed of three countries out of the five that make up the region. The selected North African countries account for 60 percent of total merchandise trade in the subregion. Results by subregion and selected countries Figure 4 shows the ETI results for Africa on a map of the continent. It illustrates the varying ability of countries across the African continent to enable trade, and shows the results for some European and Middle Eastern countries for comparison.
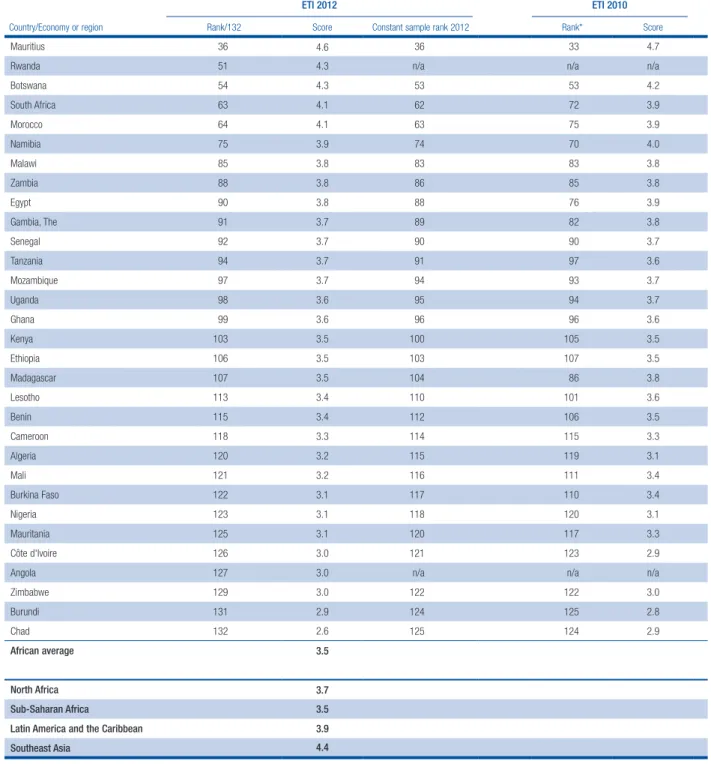
Table 1 shows the ETI results—both ranks and scores—for the 2012 and 2010 editions. The middle column further shows the 2012 rank based on the Market access Transport and communications infrastructure Efficiency of customs administration Efficiency of import- export procedures Transparency of border administration Domestic and foreign
market access Bor der Destination Regulatory environment Physical security
Availability and quality of transport infrastructure Availability and quality of
transport services Availability and use of ICTs Subindex Pillar Business environment Border administration Figure 3: Composition of the four subindexes of the ETI
Figure 4: The ETI framework: Map of Africa
Source: World Economic Forum, 2012b.
* The interval [x,y[ is inclusive of x but exclusive of y. † Highest value; †† lowest value. ETI 2012 score* n [5.00,6.14†] n [4.50,5.00[ n [4.00,4.50[ n [3.50,4.00[ n [3.16,3.50[ n [Min††,3.16[ n Not covered
2010 constant sample. In the 2012 edition of the GETR, Mauritius (36th), Rwanda (51st), Botswana (54th), South Africa (63rd), and Morocco (64th) emerge as the best performers within the region out of 132 economies covered by the Report (see Table 1). However, Mauritius declines by three places in 2012, following slight falls across all four subindexes. Botswana stays constant, whereas South Africa and Morocco move up by 10 and 12 positions, respectively, considering the constant sample. In South Africa, the improvement is mainly attributable to better transport services and a higher level of physical security. 19 Furthermore, Morocco improves by 12 places, based on more efficient handling of import-export procedures than in previous years, as well as more transparent border administration and improvements in the availability and quality of transport infrastructure and in the regulatory environment. 20 Overall, these three countries have made great strides toward enabling trade, and their results on the aggregate ETI indicator reach levels close to those found in European countries, above the majority of BRIC economies.
However, Africa is also home to some of the weakest performers in terms of enabling trade, such as Chad or Burundi, which occupy the last two positions in the ETI sample. A comparison of the trends shows that, for the majority of African countries covered, the performance in the ETI has deteriorated. Overall,
although the three North African countries perform on average somewhat better than their sub-Saharan neighbors (with a score of 3.7, versus 3.5 for the latter), the spread in performance is as important in North Africa as it is in sub-Saharan Africa (ranging from Morocco at 64th to Algeria at 120th). North Africa performs in line with the average of the BRIC economies and those in the Latin American region in terms of enabling trade, but has not yet achieved the level of Southeast Asia. Southeast Asia has been very successful in facilitating trade and promoting regional integration, which is reflected in the good ETI results achieved by this region.
The comparison of Africa with Southeast Asia and Latin America and the Caribbean in Figure 5 shows that, although the region underperforms both comparators on the majority of the ETI pillars, it is doing relatively well in terms of physical security, where it reaches the level found in Southeast Asia, and the regulatory environment, where it performs at the level of Latin America and the Caribbean. A number of African countries achieve good scores on this indicator: for example, Senegal ranks 38th, Botswana 39th, and Rwanda 15th. At the same time, the gaps are the largest in the efficiency of import-export procedures and the availability and use of ICTs, where Africa performs significantly less well than the other regions.
Figure 6 offers yet another view of Africa’s performance in the ETI by comparing the region’s
Algeria Morocco Senegal Gambia Egypt Saudi Arabia Yemen
United Arab Emirates Qatar Ethiopia Mauritania Mali Burkina Faso Chad Nigeria Cameroon Rwanda Burundi Benin Ghana Angola Zambia Zimbabwe Malawi Tanzania Kenya Uganda Namibia Botswana South Africa Lesotho Mozambique Madagascar Mauritius Syria Lebanon Cyprus Iran, Islamic Rep. Côte d’Ivoire
Figure 5: Africa’s performance in regional comparison
Figure 6: Africa’s performance over time Physical security
Regulatory environment
Availability and use of ICTs
Availability and quality of transport services
Availability and quality of transport infrastructure Transparency of border administration Efficiency of import-export procedures Efficiency of customs administration Domestic and foreign market access
1 2 3 4 5 6 7 1 2 3 4 5 6 7 Physical security Regulatory environment Availability and use of ICTs Availability and quality of transport services Availability and quality of transport infrastructure Transparency of border administration Efficiency of import-export procedures Efficiency of customs administration Domestic and foreign market access Southeast Asia
Latin American and the Caribbean Africa
BRICs
Source: World Economic Forum, 2012b.
Notes: Performance on the ETI is measured by scores on a scale of 1 to 7, with 7 being best. BRIC countries are Brazil, Russian Federation, India, and China.
Source: World Economic Forum, 2012b.
Note: The constant sample includes the following economies: Algeria, Benin, Burkina Faso, Burundi, Cameroon, Chad, Côte d’Ivoire, Egypt, Ethiopia, Gambia, Ghana, Kenya, Lesotho, Madagascar, Malawi, Mali, Mauritania, Mauritius, Morocco, Mozambique, Namibia, Nigeria, Senegal, South Africa, Tanzania, Tunisia, Uganda, Zambia, and Zimbabwe.
n 2009 n 2012 ET I s co re ( 1– 7, b es t)
of border administration has stalled—despite Africa’s fairly low score on these two pillars.
Analysis by subindex and pillar
Figure 7 shows the spread in performance across African countries on all nine pillars of the ETI and details the performance of comparators as well as the subregional groups of sub-Saharan Africa, North Africa, and landlocked countries from the region.
Table 1: The Enabling Trade Index 2012 rankings and 2010 comparison
ETI 2012 ETI 2010
Country/Economy or region Rank/132 Score Constant sample rank 2012 Rank* Score
Mauritius 36 4.6 36 33 4.7
Rwanda 51 4.3 n/a n/a n/a
Botswana 54 4.3 53 53 4.2 South Africa 63 4.1 62 72 3.9 Morocco 64 4.1 63 75 3.9 Namibia 75 3.9 74 70 4.0 Malawi 85 3.8 83 83 3.8 Zambia 88 3.8 86 85 3.8 Egypt 90 3.8 88 76 3.9 Gambia, The 91 3.7 89 82 3.8 Senegal 92 3.7 90 90 3.7 Tanzania 94 3.7 91 97 3.6 Mozambique 97 3.7 94 93 3.7 Uganda 98 3.6 95 94 3.7 Ghana 99 3.6 96 96 3.6 Kenya 103 3.5 100 105 3.5 Ethiopia 106 3.5 103 107 3.5 Madagascar 107 3.5 104 86 3.8 Lesotho 113 3.4 110 101 3.6 Benin 115 3.4 112 106 3.5 Cameroon 118 3.3 114 115 3.3 Algeria 120 3.2 115 119 3.1 Mali 121 3.2 116 111 3.4 Burkina Faso 122 3.1 117 110 3.4 Nigeria 123 3.1 118 120 3.1 Mauritania 125 3.1 120 117 3.3 Côte d'Ivoire 126 3.0 121 123 2.9
Angola 127 3.0 n/a n/a n/a
Zimbabwe 129 3.0 122 122 3.0 Burundi 131 2.9 124 125 2.8 Chad 132 2.6 125 124 2.9 African average 3.5 North Africa 3.7 Sub-Saharan Africa 3.5
Latin America and the Caribbean 3.9
Southeast Asia 4.4
Sources: World Economic Forum, 2010, 2012b.
Notes: Latin America and the Caribbean countries: Argentina, Bolivia, Brazil, Chile, Colombia, Costa Rica, Dominican Republic, Ecuador, El Salvador, Guatemala, Guyana, Haiti, Honduras, Jamaica, Mexico, Nicaragua, Panama, Paraguay, Peru, Uruguay, and Venezuela; North African countries: Algeria, Egypt, Morocco; Southeast Asian countries: Cambodia, Indonesia, Malaysia, Philippines, Singapore, Thailand, and Vietnam; sub-Saharan African countries: Angola, Benin, Botswana, Burkina Faso, Burundi, Cameroon, Chad, Côte d’Ivoire, Ethiopia, Gambia, Ghana, Kenya, Lesotho, Madagascar, Malawi, Mali, Mauritania, Mauritius, Mozambique, Namibia, Nigeria, Rwanda, Senegal, South Africa, Tanzania, Uganda, Zambia, and Zimbabwe.
* The 2010 rank is out of 125 countries. Seven new countries were added to the 2012 Index: Angola, Haiti, Iran, Lebanon, Moldova, Rwanda, and Yemen.
performance between 2009 and 2012. Here it is noteworthy that Africa’s overall performance in the market access pillar has slightly deteriorated, whereas improvements have been made in the efficiency of customs administration, transport infrastructure, and ICTs, albeit the latter from a very low base. The comparison over time further reveals that, when it comes to border administration, the efficiency of
customs administration has improved but progress in the efficiency of import-export procedures and transparency
In terms of market access, which captures both access to domestic markets and access to foreign markets for the country’s exporters, the region is characterized by a relatively large spread in performance. Although some African countries perform better than comparators in Southeast Asia and Latin America and the Caribbean, in the majority of African countries,
access to markets is relatively constrained. For North African markets, this constraint to access is more severe, while landlocked African countries enjoy levels of market access similar to those of Africa and sub-Saharan Africa overall and perform far better than North Africa.
Interestingly, significant differences can be observed across African countries in this respect. A number of Box 2: Customs reform through increased visibility: Individual performance contracts in Cameroon Outdated and bureaucratic border clearance processes
imposed by customs and other agencies are increasingly seen as posing greater barriers to trade than tariffs do. Cumbersome systems and procedures and poor infrastructure both increase transaction costs and lengthen delays for the clearance of imports, exports, and transit goods, with negative impacts on competitiveness. This is especially true in poor countries, and in Africa the difficulties are particularly severe, with excessive physical inspections being a major source of delays. Countries confront a deep dilemma between facilitating trade and securing control, particularly because their need for customs revenue is still significant.
This scenario has been changing recently, with many African governments adopting major reforms in their border management systems. Among these efforts, the case of Cameroon Customs is one of the most interesting: the agency has undertaken a challenging strategy that relies on technology and improvements in visibility, ensuring a double continuity through visualized performance measurement and human resource management based on the measured performance.
Cameroon’s customs administration has suffered from corruption and struggled to identify options for improving governance. A customs reform program was introduced that sought to reduce corruption while simultaneously raising revenue collection and facilitating trade. The reform included the installation of ASYCUDA++ (an automated customs clearance system) that would enable the administration not only to track the processing of each consignment, but also to measure performance against a number of criteria relevant to the reform.
With the support of the Trade Facilitation Facility, 1 these efforts have continued with the introduction in 2009 of individual performance contracts, making Cameroon the first country in the world to adopt such an approach. These performance contracts use objective and quantifiable performance data from the automated computer system. The objectives of customs administration (facilitation and enforcement) are complemented by specific objectives that aim at abolishing bad practices. With this mechanism, individual customs officers as well as their managers have become aware of their performance data vis-à-vis those of other colleagues, and they receive rewards or sanctions as a result of their performance.
The activity has far achieved several significant outcomes since the start of its implementation:
• Processing time for customs declaration at Douala Port I by customs officers dropped from about 11 hours in 2010 to 2 hours in the third trimester of 2011.
• Customs revenues increased by 22 percent from the first trimester of 2010 to the first trimester of 2011, while growth of activity during the same period was 17 percent.
• An increase in the average revenues per customs declaration was recorded: revenues increased by more than 6.9 billion CFA francs (about US$17.25 million) in 2011, all other things being equal.
• Possibly suspicious practices have been drastically reduced: notably, reroutings (manually changing the control channel from the one selected by the automated system to the other—for example, document verification to physical inspection) fell from 5 percent of the total number of declarations in 2009 to 1.6 percent in 2010 (in Douala Port I).
The activity catalyzes the following positive initiatives: • The concept of performance-linked treatment is being
applied to declarants/economic operators. Performance-contracted importers enjoy a trade facilitation
environment: for example, a shorter port dwell time that is 4 days shorter than the average 19 days. • Performance contracts have had a major impact on
importers and are creating the start of a virtuous circle between customs brokers and importers. For successful importers (those who reached the agreed performance targets), performance contracts have been the starting point of revising internal procedures for the clearing processes.
• The culture of collecting and monitoring performance indicators is increasingly accepted. Institutional performance data are becoming publicly available. Stakeholder dialogues are being based on objective data, and the progress and achievements of efforts become publically accountable.
• Several countries, such as Benin and Togo, are following Cameroon’s successful approach to customs reform. Source: Contributed by the World Bank, International Trade
Department.
Note
1 The Trade Facilitation Facility (TFF) is a rapid-response trust fund with the objective of helping developing countries reduce trade costs and enhance their ability to move goods and services across borders rapidly, cheaply, and predictably. It is designed to finance activities that will make immediate, direct, and effective improvements in trade facilitation systems by modernizing infrastructure, institutions, and policies and improving regulations. The TFF finances activities at country, regional, and global levels including projects and project-preparation activities, advisory work, and technical assistance.
countries have liberalized their domestic markets and have fairly free access to key developed-country markets as a result of trade preference schemes such as those under the African Growth and Opportunity Act put in place by the United States or Economic Partnership Agreements with the European Union. The foreign market access component of the Index takes into account the trade preferences countries enjoy abroad by capturing the margin of preference to which countries are entitled. Because of the preferential schemes in place, two African countries—Malawi and Mauritius— enjoy the highest margin of preference in target markets within the entire ETI sample.
In the case of North Africa, the results show that the region’s trade performance is negatively affected by limited domestic and foreign market access. Further reduction of domestic tariffs and tariffs in key export markets would enable trade in the region. This may be a reflection of the still fairly high tariffs in the region, the low number of regional trading agreements into which countries have entered, and the fact that the region does not benefit from as many trade preferences as sub-Saharan Africa.
Border administration takes into account the efficiency of customs and the transparency and efficiency of the entire clearance process. The results show that, in a number of African countries, customs are
more efficient than they are in Southeast Asia or in Latin America and the Caribbean (see Appendix B). However, on average, there is some room for improvement in Africa. The benefits of customs reform are considerable: in addition to speeding up the clearance process at the border, more efficient customs contribute to a better collection of tariff and tax revenues, more formal cross-border trading activity, and lower levels of corruption. Important efforts have been undertaken in recent years toward reforming customs administrations in African countries (see Box 2 for customs reform efforts in Cameroon).
In most countries, however, customs performs only one part of the border clearance process, and other agencies are tasked with the import or export procedure components. These agencies include entities that enforce sanitary and phytosanitary standards as well as technical requirements and entities that grant import licenses. It is therefore crucial for reforms in this field to take a holistic view and consider the import and export procedures as a whole, ensuring that the linkages between the different agencies involved in the import-export process present a minimum of friction and delays. In many cases, information technology (IT)-based systems have proven successful in facilitating procedures across different agencies. For example, the Automated System for Customs Data (ASYCUDA) was implemented Figure 7: Enabling Trade Index score dispersion among African economies
Physical security Regulatory environment Availability and use of ICTs Availability and quality of transport services Availability and quality of transport infrastructure Transparency of border administration Efficiency of import-export procedures Efficiency of customs administration Domestic and foreign market access 1 2 3 4 5 6 7
Source: World Economic Forum, 2012b.
Notes: The sample includes the following economies: landlocked Africa: Botswana, Burkina Faso, Burundi, Chad, Ethiopia, Lesotho, Malawi, Mali, Rwanda, Uganda, Zambia, and Zimbabwe; Latin America and the Caribbean: Argentina, Bolivia, Brazil, Chile, Colombia, Costa Rica, Dominican Republic, Ecuador, El Salvador, Guatemala, Guyana, Haiti, Honduras, Jamaica, Mexico, Nicaragua, Panama, Paraguay, Peru, Uruguay, and Venezuela; North Africa: Algeria, Egypt, Morocco; Southeast Asia: Cambodia, Indonesia, Malaysia, Philippines, Singapore, Thailand, and Vietnam; sub-Saharan Africa: Angola, Benin, Botswana, Burkina Faso, Burundi, Cameroon, Chad, Côte d’Ivoire, Ethiopia, Gambia, Ghana, Kenya, Lesotho, Madagascar, Malawi, Mali, Mauritania, Mauritius, Mozambique, Namibia, Nigeria, Rwanda, Senegal, South Africa, Tanzania, Uganda, Zambia, and Zimbabwe. The blue bars reflect the dispersion in performance across African economies in the nine dimensions analyzed in the Enabling Trade Index, the end points presenting the highest and the lowest score in the sample, respectively.
ET I s co re ( 1– 7)
African average Landlocked Africa Sub-Saharan Africa
in 42 African countries, including Botswana, Ethiopia, Ghana, and Rwanda. 21
Despite rising awareness of this issue and progress achieved on the customs administration front, many African countries still lag behind international standards in terms of the efficiency, cost, and timeliness of the overall clearance process, mainly because the process is still burdened with red tape and insufficient
communication between the agencies. Within the African continent, the efficiency of import-export procedures is the area where we see the largest differences across countries and across the three subregional country groupings we present in this Report. While Mauritius, the best-performing country in Africa on this pillar, performs better than Southeast Asia on average and comes in at Box 3: Overcoming landlockedness: Faster border management through customs data sharing
across countries
Delays at border crossings across sub-Saharan Africa have long been identified as one of the largest non-tariff barriers to trade. Some contributing factors include inefficient paperwork and processes, lack of advance notification of goods, poor and fraudulent declarations, lack of cross-border information exchange between customs, and out-of-date or nonexistent transit and trade statistics. One solution to this problem lies in developing a platform for efficient customs and transit data exchange, management, and reporting and, even more importantly, ensuring that the information exchanged is actually used to improve daily operations. For example, in addition to improving connectivity through infrastructure, documents, and procedures, countries in East Africa have also recently electronically interconnected their customs systems to facilitate trade.
Traders typically lose a great deal of time because agencies in each country re-enter trade-related information in their computer systems for customs and other border-control purposes. Re-entering data also makes the process vulnerable to the risk of input errors and fraud; border management measures to combat this risk can further delay the clearance process. Starting from a document
that has already been verified by one customs authority ensures data integrity and, more importantly, traceability of the declarations across borders, which is critical for reconciliation and risk management. Uganda and Kenya have been at the forefront of an initiative to share data between their customs administrations. In 2009, the two countries worked with USAID in developing a system to interconnect their customs systems. The interconnecting system, known as the Revenue Authorities Digital Data Exchange (RADDEx), transmits customs transit declaration data in near-real time from a point of initial lodging (seaport, border post, etc.) through all relevant transit points to final destination. RADDEx was first installed at the Malaba border post between the two countries, and enabled the sharing of data between the border-crossing point and the main transit port of Mombasa in Kenya. The border management requirements of the two countries already had in common several data elements. For example, for Uganda transit declarations in Kenya 38 data elements were already captured in Kenya with the declarant adding or modifying only three elements (including declarant’s name) in Uganda. RADDex has led to significant time reductions in preparation and processing the declarations by:
0 6 12 18 24 30 March February January December November
Figure A: Change in border-crossing time at Malaba, November 2011–March 2012
Ho
ur
s
— Average outbound
— Standard deviation, average outbound — Average inbound
— Standard deviation, average inbound
a solid 29th out of 132 countries (see Appendix B), Chad represents the weakest performer in the entire sample.
Landlocked African countries do not have in place the necessary attributes to facilitate the administrative processes related to importing and exporting goods. According to 2012 World Bank data, 22 it costs almost US$5,000 to import a container to Rwanda, and it takes 29 days and 8 documents. Interestingly, countries that have the least efficient border administration on the continent are the landlocked countries, which face many disadvantages because of their geographical situation. Many efforts have been made to establish access to port infrastructure in neighboring countries through corridors, infrastructure projects, and international agreements. However, our data show that, on average, the inefficient import-export procedures in these countries constitute a much more important trade barrier than limited access to ports. Indeed, on a scale of 1 to 7, these landlocked countries achieve a score of 2.47 for efficiency of border administration, while access to a port receives a significantly higher value of 3.59. Although the ETI is not a tool designed to identify the binding constraints to a country’s trade performance, it provides an indication of the order of magnitude and importance of the different problems. The results of the ETI support the finding that improving the efficiency of border agencies and their collaboration may provide higher payoffs than improving access to international maritime networks for landlocked countries in Africa. Both areas present serious obstacles,
however, and overcoming them has great potential for significantly bettering the situation (see Box 3). 23
In terms of transparency at the border, the results are fairly even across the subregions, although significant differences exist across countries, with Mauritius occupying a good 46th position and Chad ranking a low 131st. Corruption at the border favors illegal or illicit trade and is a key impediment to participation in global trade, as it contributes to making border clearance time unpredictable and may represent a prohibitive trade barrier for businesses that are committed not to pay bribes. Corruption at the border is a trade barrier that is particularly damaging to the domestic economy because it often reflects illegal or illicit trade activities and because the benefits accrue to a small group of well-connected public officials who abuse their power for private gain. The goals of African countries in terms of trade development cannot be achieved without major efforts to tackle corruption at domestic borders.
Transport and ICT infrastructure is another key element that contributes to the cost of trading in Africa. Relevant elements include not only the availability and quality of transport infrastructure (see Chapter 2.2), but also whether logistics and transportation services are available. This availability is increasingly becoming a key factor for exporters, as it determines a significant share of the trade cost. For landlocked countries, access to ports in neighboring countries is also crucial. The ETI results show that landlocked countries do lag behind the African average as well as the sub-Saharan African Box 3: Overcoming landlockedness: Faster border management through customs data sharing
across countries (cont’d)
• avoiding duplicate data entry by declarants at different border posts,
• enabling pre-arrival declaration and data processing, • sending advance notice for document preparation, and • facilitating the verification.
However, for maximum benefit, the system has been complemented by and been part of other reforms that include improved risk management and better coordination between agencies when required, vetting clearing agents, streamlining traffic flow, and imposing strict parking rules for truck drivers to decongest the customs control zone. The system for managing the physical movement of traffic through the border post is called the Customs Reconciliation System (CURES). It was developed in-house by the Uganda Revenue Authority to capture information on the physical movement of trucks and containers. Using the CURES system, the authorities are able to keep track of trucks and cargo entering and leaving the control zone.
The Malaba border is one of the busiest in sub-Sahara Africa, with a daily average of 650 heavy commercial trucks crossing from Kenya to Uganda. The border post was congested and border management agencies were operating near capacity. The reforms adopted at the end of 2011 promoted a change in the behavior and operational arrangements of the logistics service providers that could be made possible only through IT developments. Together, the reforms at the border post between Kenya and Uganda have resulted in some of the shortest border crossing times in sub-Saharan Africa (Figure A). The figure shows the dramatic fall in border dwell times when the cocktail of measures took effect in late 2011 into early 2012. Average border dwell times per truck fell from over 12 hours to about 3 hours.
IT can certainly help to improve transit for landlocked countries, but it is by no means a panacea. Several complementary measures are also needed, and IT is often the last to be put into place so as not to substitute for real reforms. Done properly, reforms and judicious automation can significantly reduce the resources required for infrastructure improvements.
Source: Contributed by the World Bank, International Trade Department.
average in terms of availability and quality of transport infrastructure. On the other hand, transport infrastructure appears to be well developed across North Africa, which has reached levels that are on a par with those found in Southeast Asia. The three North African economies tend to perform better in terms of availability of transport infrastructure (with a score of 5.1 out of 7), while the quality of infrastructure is still insufficient (a score of 3.8). Although Morocco and Egypt are well connected to global maritime routes (16th and 17th, respectively, on the transshipment connectivity index), port quality in Algeria is poor, ranked 113th.
Although North African economies perform well on the infrastructure component of the ETI, the assessment of logistics services does not keep up with these good results. Most African countries show room for improvement in the various indicators of logistics quality, such as logistics competence and how easy and affordable it is to arrange international shipments. Maritime services are widely available in countries of the subregion, as shown in the good results achieved on the Liner Shipping Connectivity Index in Algeria (33rd), Morocco (18th), and Egypt (19th). Improving the logistics services in sub-Saharan Africa, including in the landlocked countries, would further reduce the cost of trade from and to this region. The World Bank estimates that reform leading to a more competitive transport sector could halve the cost of moving staples in West Africa over 10 years. 24 Although
the best performer from the region, South Africa, reaches the level found in Southeast Asia and ranks 26th, logistics services are underdeveloped in the vast majority of sub-Saharan countries.
The rising importance of global value chains has raised the importance of ICT connectivity for goods trade because producing parts of a good requires more exchange on product specification, production-related data, delivery times, and, in some cases, also training. Furthermore, ICTs have become key for business-to-business and business-to-business-to-consumer customer relations as well as for identifying buyers, which remains the second most important barrier to exporting, according to data on the most problematic factors for trade obtained from the World Economic Forum’s Executive Opinion Survey (the Survey) (analyzed in detail in the next section). None of the countries from the region reaches the level of ICT connectivity found in Southeast Asia or Latin America. The best-performing African country, Mauritius, ranks a low 79th. Although North Africa is relatively well connected in international comparison, trade in landlocked countries on the continent—and in sub-Saharan Africa as a whole—would benefit from better connectivity. This could be achieved through improvements to mobile and broadband penetration and a greater use of the Internet and other ICTs by business and government. The use of ICTs is important for the degree to which administrative processes related to importing and exporting can be IT Figure 8: The most problematic factors for exporting in Africa
Source: World Economic Forum, Executive Opinion Survey 2012; authors’ calculations.
Notes: From a list of ten factors, respondents were asked to select the five most problematic for exporting in their country and rank them between 1 (most problematic) and 5. The bars in the figure show the responses weighted according to their rankings. The most problematic factors sample includes all African countries that were covered in the Executive Opinion Survey 2012. The sample includes the following groups of economies: landlocked: Botswana, Burkina Faso, Burundi, Chad, Ethiopia, Lesotho, Malawi, Mali, Swaziland, Uganda, Zambia, and Zimbabwe; North Africa: Algeria, Egypt, Libya, and Morocco; sub-Saharan Africa: Benin, Botswana, Burkina Faso, Burundi, Cameroon, Cape Verde, Chad, Côte d’Ivoire, Ethiopia, Gabon, Gambia, Ghana, Guinea, Kenya, Lesotho, Liberia, Madagascar, Malawi, Mali, Mauritania, Mauritius, Mozambique, Namibia, Nigeria, Senegal, Seychelles, Sierra Leone, South Africa, Swaziland, Tanzania, Uganda, Zambia, and Zimbabwe.
0 5 10 15 20 25
Rules of origin requirements abroad Technical requirements and standards abroad Tariff barriers abroad High cost or delays caused by international transportation Access to imported inputs at competitive prices High cost or delays caused by domestic transportation Burdensome procedures and corruption at foreign borders Inappropriate production technology and skills Difficulties in meeting quality/quantity requirements of buyers Identifying potential markets and buyers Access to trade finance
l Landlocked sub-Saharan Africa l North Africa
n Sub-Saharan Africa
based, which in turn is key to making them more efficient and more transparent. More importantly, ICTs could contribute to overcoming the particular challenges related to being landlocked by developing the export of business or tourism services, for example.
The overall business environment is the 4th subindex of the ETI. It consists of the regulatory environment for trade-related activities, which includes factors such as general governance indicators, openness to investment, ease of hiring foreign labor, and the availability of trade finance. A number of African countries have made great strides in improving their regulatory environment. For example, Botswana, Rwanda, and Mauritius—despite many differences in their regulatory environments—have all made significant improvements in this respect and come in within the top 40 on this pillar. Their governments are considered by the business community to be more efficient than those of other countries in the region, and their relevant rules and regulations are supportive of foreign investment. At the same time, a number of African countries still suffer from very poor institutions that affect their trade performance. Chad (126th), Angola (129th), and Burundi (130th) are the weakest performers in the region on this pillar. Key issues across the continent include the insufficient definition and protection of property rights for physical and intellectual property, widespread corruption, and undue influence. At the same time, countries’
regulations are fairly open to welcoming foreign labor and investment.
Last but not least, the fairly high levels of physical security are an advantage for the African continent, in particular when compared with Latin American countries, which perform significantly less well on this dimension. The best-performing country, Rwanda, occupies an excellent 15th position and is followed by Senegal at 38th and Botswana at 39th. Not surprisingly, very low levels of security are found in some countries, such as Nigeria (119th), Kenya (120th), and Burundi (124th). THE MOST PROBLEMATIC FACTORS FOR TRADE IN AFRICA
The World Economic Forum’s Survey asks top
executives to rate the main bottlenecks for exporting and importing in their countries. Respondents were asked to choose and rank in order of importance from a list of factors (ten factors for exports and eight for imports) those five that they believe have the highest impact on the ease of exporting and importing in the country in which they operate. For exports we included a wide range of factors that may inhibit export development, such as supply-side constraints, technical requirements, rules of origin, and administrative procedures. The import factors mirror the structure of the ETI to the extent possible, providing an indication of the importance of Figure 9: The most problematic factors for importing in Africa
Source: World Economic Forum, Executive Opinion Survey 2012; authors’ calculations.
Notes: From a list of eight factors, respondents were asked to select the five most problematic for importing in their country and rank them between 1 (most problematic) and 5. The bars in the figure show the responses weighted according to their rankings. The most problematic factors sample includes all African countries that were covered in the Executive Opinion Survey 2012. The sample includes the following groups of economies: landlocked: Botswana, Burkina Faso, Burundi, Chad, Ethiopia, Lesotho, Malawi, Mali, Swaziland, Uganda, Zambia, and Zimbabwe; North Africa: Algeria, Egypt, Libya, and Morocco; sub-Saharan Africa: Benin, Botswana, Burkina Faso, Burundi, Cameroon, Cape Verde, Chad, Côte d’Ivoire, Ethiopia, Gabon, Gambia, Ghana, Guinea, Kenya, Lesotho, Liberia, Madagascar, Malawi, Mali, Mauritania, Mauritius, Mozambique, Namibia, Nigeria, Senegal, Seychelles, Sierra Leone, South Africa, Swaziland, Tanzania, Uganda, Zambia, and Zimbabwe.
0 5 10 15 20 25
Inappropriate telecommunications infrastructure Crime and theft High cost or delays caused by domestic transportation Domestic technical requirements and standards Corruption at the border High cost or delays caused by international transportation Tariffs and non-tariff barriers Burdensome import procedures
Percent
l Landlocked sub-Saharan Africa l North Africa
the pillars of the ETI for the trading environment of these countries.
These two questions concerning exports and imports identify the most important bottlenecks to trade and supply-chain connectivity across the economies covered in the Survey. In addition, the results can provide insight about the most important bottlenecks to trade globally and inform multilateral trade negotiations about priority areas for liberalization. Figures 8 and 9 show that the most important impediments to trade are largely the same across the three African subregions. Overall, insufficient access to trade finance is the most important bottleneck to increased exports (although the importance of this factor is less pronounced for North Africa than for the rest of the continent), followed by the difficulty in identifying potential markets and buyers. The limitations in access to trade finance are probably linked to the underdeveloped financial markets in most of the countries, as discussed in Chapter 1.1. 25 Other factors— such as difficulties in meeting quality and quantity requirements of buyers and inappropriate production technology and skills—are cited by at least 10 percent of respondents among more than one subregion.
The data thus corroborate findings from the ETI analysis above: burdensome border procedures and corruption, for example, are considered a more important barrier than tariff barriers or NTMs in the narrow sense (compliance with technical and quality standards certificates, etc.). Furthermore, the data confirm the need for more regional integration: high costs or delays caused by poor domestic transportation are considered a higher burden than those incurred by international transportation. This may point to
bottlenecks at border crossings to neighboring countries, for example, or inappropriately connected infrastructure. The most problematic factors for exporting yield a slightly different priority in North Africa: similar to sub-Saharan Africa, identifying potential markets and buyers is listed as the second most important impediment. However, difficulties in meeting quality/quantity requirements of buyers, inappropriate production technology and skills, and foreign technical requirements play a more prominent role for North African countries, whereas access to trade finance is considered less problematic.
On the import side, Figure 9 confirms the results from the ETI analysis: from the perception of business leaders, burdensome import procedures emerge as the most important impediment to trade across the continent, nearly on a par with tariffs and non-tariff barriers in the narrow sense. The cost of international transportation is the third most important factor, followed by corruption at the border. However, the figure also reveals that border corruption is much more pronounced in landlocked Africa and North Africa than in sub-Saharan Africa. Crime and theft and poor telecommunications play a much smaller role throughout the continent. This result underlines not only
the importance of trade facilitation at multilateral and bilateral levels, but also the potential of countries for facilitating trade through practical measures within their government’s purview.
CONCLUSIONS
This chapter has analyzed how African countries perform in terms of enabling trade by using the World Economic Forum’s Enabling Trade Index. The 31 countries covered in the 2012 edition of The Global Enabling Trade Report
were included in the analysis, which covered the four main categories of the Index: market access, border administration, infrastructure, and business environment. The analysis differentiated among three categories of countries within the continent: North Africa, sub-Saharan Africa, and a subgroup of landlocked countries.
The results show that, although a number of African countries have facilitated market access domestically and for their exporters abroad and have achieved high levels of physical security, they lag behind across a number of areas assessed by the Index. There is room for improvement in terms of the efficiency of import and export procedures, the transparency of border administration, and the use of ICTs. Furthermore, logistics services and insufficient infrastructure add to the cost of trading and act as a barrier to higher levels of regional integration.
By improving their performance across the dimensions of the ETI, African countries could better prepare their economies to benefit from international trade. For landlocked countries, the two challenges that need to be tackled are streamlining border administration to reduce the cost of procedures and delays during clearance and improving the coordination of the clearance process. Equally important is the promotion of access and use of ICTs, which is poor not only in landlocked countries but also across all of sub-Saharan Africa. As pointed out in other chapters of this Report,
countries in the region could benefit from increased infrastructure investment in the area of ICTs.
In the case of North Africa, transparency of border administration appears to be the most important factor limiting trade in goods in the three North African countries assessed—Algeria, Egypt, and Morocco. These countries could also benefit from more open access to domestic and foreign markets.
These improvements are necessary for countries to more fully participate in global value chains, which account for a significant and rising share of trade flows, and to advance toward a higher degree of regional integration. More trade integration within the region would also contribute to higher food security across the continent. This chapter provides information on one specific set of measures that could enable African countries to further benefit from trade. It is intended to be a motivator for change and a foundation for dialogue, by providing a yardstick of the extent to which countries
have in place the factors that facilitate the free flow of goods and by identifying areas where improvements are most needed.
NOTES 1 IMF 2012a.
2 Authors’ calculations, based on World Trade Organization time-series data.
3 The definition of minerals follows the sector classification developed by the International Trade Centre in their Trade Performance Index. In addition to crude oil and gas, this category also contains all metal ores and other minerals as well as petroleum products, liquefied gas, coal, and precious stones. The data used cover the years 2006 through 2010 or the most recent year available. Further information on these data can be found at http://www.intracen.org/menus/countries.htm.
4 One-fifth of total government revenues stem from natural resource extraction in Equatorial Guinea, the Republic of Congo, Angola, Nigeria, Chad, Gabon, Botswana, Cameroon, the Democratic Republic of Congo, and Guinea (IMF 2012b).
5 These data are from UNCTAD Stats, Intra-trade of regional and trade groups by product, annual, 1995–2011, available at http://unctadstat.unctad.org/TableViewer/tableView. aspx?ReportId=24397.
6 World Bank 2012b. 7 World Bank 2012a. 8 World Bank 2008.
9 One of the reasons that the barriers remain in place may be that the complementarity of production structures in many neighboring African countries probably makes it more difficult from a political economy standpoint to pursue regional free trade.
10 Authors’ calculations, based on World Bank Doing Business 2013 data.
11 See Ben Barka 2012, which also contains more examples and a more thorough discussion of the importance of administrative barriers for regional trade in Africa.
12 Bromley et al. 2011. 13 World Bank 2012b.
14 We have focused on the flow of trade in goods in the Index for expository purposes, although we recognize that enabling in services is also important. By circumscribing the issue clearly, the Index provides a useful vehicle for analyzing policy on a clearly defined part of the issue. Trade in goods accounts for upwards of 80 percent of all trade, and is therefore highly relevant.
15 See Browne et al. 2012.
16 The score of each subindex is derived as an unweighted average of the pillars that constitute it.
17 The choice of an unweighted average results from the recognition that no current research can provide guidance on the importance of the different factors. At the country level, the most problematic factors for importing shown in Figure 9 provide some indication of the importance of the different factors because they mirror the categories of the ETI to the extent possible.
18 Tests were carried out using regression analysis in a gravity model of trade. See World Economic Forum 2009.
19 Both South Africa and Morocco have benefitted from the removal and revision of the data on non-tariff measures, respectively. 20 A more detailed analysis of country performances can be found in
World Economic Forum 2012b.
21 See www.asycuda.org for implementation status of ASYCUDA in African countries.
22 World Bank 2011.
23 Although the ETI elements provide an indication of the potential challenges to be addressed, it has to be noted that these elements are highly interrelated. For example, delays in port clearance may result from issues related to administrative procedures that are captured under border administration. 24 Bromley et al. 2011.
25 Access to trade finance and access to finance overall are most likely strongly correlated for two reasons. First, the availability of trade finance depends on the development of the financial system. Second, respondents are likely to judge the overall availability of finance for their needs and may not clearly distinguish between the different instruments.
REFERENCES
Ben Barka, H. 2012. Border Posts, Checkpoints, and Intra-African Trade: Challenges and Solutions. African Development Bank, January. Available at http://www.afdb.org/fileadmin/uploads/ afdb/Documents/Publications/INTRA%20AFRICAN%20TRADE_ INTRA%20AFRICAN%20TRADE.pdf.
Bromley, D. W., A. Cook, S. Singh, and N. Van Dusen. 2011. “Regional Agricultural Transport and Trade Policy Study.” USAID West Africa Trade Hub Technical Report No. 42, March. Available at http:// www.watradehub.com/resources/resourcefiles/jun11/regional-agricultural-trade-policy-and-transport-study.
Browne, C., T. Geiger, and T. Gutknecht. 2012. “The Executive Opinion Survey: The Voice of the Business Community.” In The Global Competitiveness Report 2012–2013. Geneva: World Economic Forum. 69–78.
Fitzmaurice, M. and O. Hartmann. 2013. “Border Crossing Monitoring along the Northern Corridor.” Sub-Saharan Africa Transport Policy Program, Working Paper No. 96. Washington, DC: World Bank. Available at http://www4.worldbank.org/afr/ssatp/Resources/ SSATPWP96-border-crossing.pdf.
IMF (International Monetary Fund). 2012a. World Economic Outlook database, October. Available at http://www.imf.org/external/pubs/ ft/weo/2012/02/weodata/index.aspx.
———. 2012b. Sub-Saharan Africa: Sustaining Growth amid Global Uncertainty, April. Regional Economic Outlook. Available at http:// www.imf.org/external/pubs/ft/reo/2012/afr/eng/sreo0412.pdf. ITC (International Trade Centre). Trade Performance Index, April 2012.
Available at http://www.intracen. org/menus/countries.htm. UNCTAD. ASYCUDA (AUtomated SYstem for CUstoms Data). Available
at http://www.asycuda.org/.
World Bank. 2008. Regional Trade in Food Staples: Prospects for Stimulating Agricultural Growth and Moderating Short-Term Food Security Crises in Eastern and Southern Africa. Report No. 46929-AFR. Washington, DC: World Bank. Available at https:// openknowledge.worldbank.org/handle/10986/7829. ———. 2011. Doing Business 2012: Doing Business in a More
Transparent World. Washington, DC: World Bank. Available at http://www.doingbusiness.org/reports/global-reports/doing-business-2012.
———. 2012a. Africa Can Help Feed Africa: Removing Barriers to Regional Trade in Food Staples. Washington, DC: World Bank. Available at http://siteresources.worldbank.org/INTAFRICA/ Resources/Africa-Can-Feed-Africa-Report.pdf.
———. 2012b. De-Fragmenting Africa: Deepening Regional Integration in Goods and Services. Washington, DC: World Bank. Available at http://www-wds.worldbank.org/external/default/ WDSContentServer/WDSP/IB/2012/05/03/000333038_2012050 3000714/Rendered/PDF/684900ESW0Whit00Box367921B00PU BLIC0.pdf.
World Economic Forum. 2009. The Global Enabling Trade Report 2009. Geneva: World Economic Forum.
———. 2010. The Global Enabling Trade Report 2010. Geneva: World Economic Forum.
———. 2012a. The Global Competitiveness Report 2012–2013. Geneva: World Economic Forum.
———. 2012b. The Global Enabling Trade Report 2012: Reducing Supply Chain Barriers. Geneva: World Economic Forum.
Appendix A:
Composition of the Enabling Trade Index 2012
This appendix provides details about the construction of the Enabling Trade Index (ETI).
The ETI is composed of four subindexes: the market access subindex; the border administration subindex; the transport and communications infrastructure subindex; and the business environment subindex. These subindexes are, in turn, composed of the nine pillars of the ETI: domestic and foreign market access, efficiency of customs administration, efficiency of import-export procedures, transparency of border administration, availability and quality of transport infrastructure, availability and quality of transport services, availability and use of ICTs, regulatory environment, and physical security. These pillars are calculated on the basis of both hard data and survey data.
The survey data are mainly derived from the responses to the World Economic Forum’s Executive Opinion Survey and range from 1 to 7. In addition, survey data from the World Bank’s Logistics Performance Index (LPI) have also been included. The hard data were collected from various recognized sources, such as the World Bank, the World Trade Organization (WTO), the International Trade Centre (ITC), and the United Nations Conference on Trade and Development (UNCTAD). The data are described in detail in Appendix C. All of the data used in the calculation of the ETI can be found in the data tables on the website of The Global Enabling Trade Report 2012 (www.weforum.org/ getr).
The hard data indicators used in the ETI, as well as the results from the LPI survey, are normalized to a 1-to-7 scale in order to align them with the Executive Opinion Survey results.1 Each of the pillars has been calculated as an unweighted average of the individual component variables. The subindexes are then compounded as unweighted averages of the included pillars.
In the case of the domestic and foreign market access pillar, the score in the domestic market subpillar accounts for two-thirds and the score in foreign market access accounts for one-third of the overall pillar. In the case of the availability and quality of transport infrastructure pillar, which is itself composed of two subpillars (availability of transport infrastructure and quality of transport infrastructure), the overall pillar is the unweighted average of the two subpillars. The overall ETI is then calculated as the unweighted average of the four subindexes.
The variables and the composition of pillars are described below. If a variable is one of hard data, this is indicated in parentheses after the description.
SUBINDEX A: MARKET ACCESS Pillar 1: Domestic and foreign market access
A. Domestic market access
1.01 Tariff rate (hard data)
1.02 Non-tariff measures (hard data) 2 1.03 Complexity of tariffs (hard data) 3
Tariff dispersion (hard data) Tariff peaks (hard data) Specific tariffs (hard data) Distinct tariffs (hard data)
1.04 Share of duty-free imports (hard data)
B. Foreign market access
1.05 Tariffs faced (hard data)
1.06 Margin of preference in destination markets (hard data)
SUBINDEX B: BORDER ADMINISTRATION Pillar 2: Efficiency of customs administration
2.01 Burden of customs procedures 2.02 Customs services index (hard data) Pillar 3: Efficiency of import-export procedures
3.01 Efficiency of the clearance process 4 3.02 Time to import (hard data)
3.03 Documents to import (hard data) 3.04 Cost to import (hard data) 3.05 Time to export (hard data) 3.06 Documents to export (hard data) 3.07 Cost to export (hard data)
Pillar 4: Transparency of border administration 4.01 Irregular payments in exports and imports 4.02 Corruption Perceptions Index (hard data)


![Second ACP-EEC Convention. Collected Acts [Lome], Vol. II. 31 December 1982](data:image/gif;base64,R0lGODlhAQABAIAAAP///wAAACH5BAEAAAAALAAAAAABAAEAAAICRAEAOw==)