INFORMATION TECHNOLOGY TOOLS FOR BUSINESS
INTELLIGENCE DEVELOPMENT IN ORGANIZATIONS
Olszak C.M., Zurada J. *
Abstract: The research objective for this study is to investigate different Information Technology (IT) tools for Business Intelligence (BI) development. Firstly, the issue of BI was identified and the various ages in BI development were presented. Then, the most important IT tools used in BI development were discussed. Finally, some strengths and weaknesses of described tools were demonstrated. The study was based mainly on a critical analysis of literature, creative thinking and an interpretive philosophy. The results of this research can be used by IT and business leaders as they plan and develop BI applications in their organizations.
Key words: Business Intelligence, organization, information technology tools Introduction
Business Intelligence (BI) is essential for business success for many organizations. BI enables them to obtain faster and easier access to information, to improve business processes and decision making as well as to identify the opportunities and the threats, while cooperating with customers, suppliers and competitors (Chen, et al., 2012; Con, 2015; Davenport et al., 2010; Negash and Gray, 2008; Olszak, 2014b; Olszak, 2014c;). BI helps organizations to make more informed, intelligent business decisions as well as to adapt to a changeable environment and to survive in the business world. However success based on the use of BI is frequently elusive due to the fact that the implementation of many BI applications fails. Many organizations do not achieve the appropriate benefits from using BI (Chaudhary, 2004; Isik et al, 2011; Schick et al., 2011).
About 60 to 70% of BI applications fail due to the technology, organizational, cultural and infrastructure issues (Clavier et al., 2012; Hannula and Pirttimaki, 2003). Many organizations are not able to make BI an effective tool for decision making and creating a competitive advantage. The reasons for these failures are not clear and still not well investigated, and therefore, the need for a more systematic and deliberate study of BI development for organizations is crucial. The main objective of this paper is to investigate different Information Technology (IT) tools that may be used in BI development. Such tools have a large impact on the functionality and possibilities of BI applications and consequently on the quality of decision making, personalization of products and services and improving business processes (Chen et al., 2012; Olszak, 2014a).
To address this objective, the paper is organized as follows. The first section provides the theoretical foundations for BI. Next, various IT tools for BI
*Prof. Celina M. Olszak, PhD, D.Sc., University of Economics in Katowice; Prof. Joseph
Zurada, PhD, D.Sc., University of Louisville, USA
development very identified and described. Finally some strengths and weaknesses of investigated tools were presented. A critical review literature was conducted to identify different methods and tools for BI development.
Related Works
BI has become the significant research area in the domain of management information systems in the last years (Chen et. al., 2012). The critical analysis of the subject literature shows that there is no consensus in interpretation of "Business Intelligence" term. BI has been identified as: (1) tools, technologies and software products; (2) knowledge management; (3) decision support systems; (4) dashboards; (5) new culture of working with information or specific philosophy and methodology of working with information and knowledge; (6) process; (7) analytics; (8) Competitive Intelligence and (9) Big data (Olszak, 2014b).
One of the most citied BI definition compares BI to "an umbrella" that is commonly used to describe the technologies, applications and processes for gathering, storing, accessing and analyzing data to help users to make better decisions (Moss and Atre, 2003; Davenport and Harris, 2007; Wixom and Watson, 2011). The development of BI is compared to 3 ages that are named (Olszak, 2015): BI 1.0, BI 2.0, and BI 3.0.
BI 1.0 occurred in the 1970s and 1980s. It is closely related to MIS, EIS and DSS. The technologies and applications commonly used in these information systems were grounded in basic statistical methods and simple data mining techniques. Analyzed data were mostly structured, collected by companies through various legacy systems and often stored in commercial relational database management systems. Data management and regional warehousing is considered the foundation of BI 1.0. Data marts and ETL (Extract-Transformation-Load) tools are essential for converting and integrating enterprise-specific data. Database query, OLAP, reporting tools were used to explore important data characteristics. Business performance management using scorecards and dashboards help analyze and visualize a variety of performance metrics (Chen et al., 2012). BI 1.0 was able to process simple tasks for operational and tactical management.
BI 2.0 is associated with furtherdevelopment of advanced data warehouses, OLAP techniques, data mining and first of all with Internet and web technology (web search engines such as Google, Yahoo). These technologies allow organizations to present their business online and interact with their customers directly. Text and web analytics are commonly used to process and analyze unstructured web contents. Many Web 2.0 applications have also created an abundance of user-generated content from various online social media such as forums, online groups, web blogs, social networking sites, social media sites and even virtual worlds and social games.
BI 3.0 presents a new era in the evolution of BI. Thanks to web and mobile devices (iPad, iPhone, and other sensor-based Internet-enabled devices equipped with RFID, barcodes, radio tags.) it was possible to create innovative applications
and intelligent business network for everyone. There is a growing acceptance of the idea that data analysis is a collaborative (not only singular) and social effort. It focuses on a collaborative workgroups (which are self-regulated) and on information outcomes within the confines of core business interaction with customers, employees and regulators. There is common sense that BI 3.0 should go beyond reliance on structured data available in internal sources and also on use of external and mostly unstructured data in various formats (social media posts, free form web content, images and video files).
Unfortunately, the surveys conducted by Davenport and Harris (2007), Olszak (2015) and other scholars advocate that most organizations fall into category of BI 1.0 and only a few may be classified as BI 2.0 organizations. Organizations very seldom use data from Internet and social media to develop the business models which would place them in the BI 3.0 category. The employees in surveyed organizations had a relatively poor level of the knowledge and competences on IT tools for BI development. However, this lack of knowledge and competence adversly affects the functionality and possibilities of BI applications and consequently on the quality of decision making, personalization of products and services and improving business processes. Therefore, the need for a more systematic and deliberate study of IT for BI development is crucial. The following sections provide foundations for such IT tools.
Methodology and Results
Different research methods and techniques were used to achieve the specific objectives and research tasks. They included in particular: the method of critical analysis of literature, case studies, as well as creative thinking and an interpretive philosophy. The research was carried out on the basis of secondary and primary sources of information. Secondary sources included literature from the field of management, computer science and management information systems. Additionally, own experiences of working with different software were used. ETL (Extraction-Transformation-Load)
ETL (Extraction-Transformation-Load) tools are responsible for extracting, transforming and loading of data. Extraction involves obtaining access to data originating from different sources (databases, text files, HTML, XML documents and/or e-mail). As a result of extraction, data are usually stored in the relational database significantly facilitating further data processing at the transformation stage. Transformation of data is considered to be the most complex stage of the ETL process. The process is usually performed by means of traditional programming languages, script languages or the SQL language. Data transformation means data unification, calculation of necessary aggregates, identification of missing data or duplication of data. Data transformation rules may concern principles of physical data structure unification, business principles that ensure compatibility with a modelled domain and business principles that ensure
semantic compatibility between related data. Data loading involves providing data warehouses with data that are aggregated and filtered (Larson, 2008; Meyer, 2001). Data Cleaning
Data cleaning deals with detecting and removing errors and inconsistencies from data in order to improve the quality of data. The need for data cleaning increases significantly when multiple data sources need to be integrated, e.g., in data warehouses and BI systems (Larson, 2008). The sources often contain redundant data in different representations. Data cleaning approach should satisfy several requirements, mainly: (1) data cleaning should detect and remove all major errors and inconsistencies both in individual data sources and multiple sources; this process should be supported by tools to limit manual inspection and programming effort and be extensible to easily cover additional sources; (2) data cleaning should be not be performed in isolation but together with schema-related transformations based on comprehensive metadata; (3) mapping functions for data cleaning and other data transformations should be specified in a declarative way and be reusable for other data sources as well as for query processing.
OLAP (Online Analytical Processing)
OLAP (Online Analytical Processing) provides multidimensional, summarized views of business data. OLAP tools are mainly aimed at interactive report generation according to user’s pre-defined criteria (dimensions) and optimization of searching huge data files by means of automatic generation of SQL queries. They allow for carrying out complex analyses of company performance, customer relations, product profitability, etc. They also provide answers to the ‘who?’, ‘what?’, ‘when?’, ‘what if?’ and ‘why?’ type questions. Multi-variant analyses carried out on historical data (stored in data warehouses) allow for predicting future, setting trends, customer behavior, and competition behavior. Their effective realization enables organizations to detect weaknesses, threats and hidden opportunities and chances (Olszak, 2014b).
OLTP (Online Transaction Processing)
The migration of the data into the data warehouse using conventional ETL tools and methods performed on large sets of data creates information latency problem because of the time required to perform the ETL function and migrate the data to a separate OLAP platform. Real-time data exists in the OLTP (Online Transaction Processing) environment where the time horizon of data within the OLTP environment is much shorter because performance decreases can occur with growing amounts of data. This is opposite of the nature and goals of the OLAP environment where data is aggregated and the time horizon of data grows to some large amount as determined by the information life cycle policy of the organization (Conn, 2015).
Predictive Modeling and Data Mining
They constitute an interactive process aimed at the analysis of large databases, with the purpose of extracting information and knowledge that may prove accurate and potentially useful for knowledge workers engaged in decision making and problem solving (Vercelis, 2009). Data mining activities can be subdivided into two major investigation streams, according to the main purpose of the analysis: interpretation and prediction (Poul et al., 2003). Different mathematical models and methods are used in such advanced data mining. The most important include: regression, time series, classification, association rules, and clustering (Larose, 2005; Tan et al., 2005; Witten et al., 2011).
Text Mining
It is commonly used to process and analyze unstructured web contents. Text analytics is required and used because a significant portion of the unstructured content collected by an organization is in the textual format, from e-mail communication and corporate documents to web pages and social media content (Chen et al., 2012). Text mining may refer to: (1) Data processing: preprocessing of the data to the needed format; (2) Concept extraction: extraction of important concepts and terms through initial text analysis; (3) Narrative analysis: writing a narrative analysis to identify patterns and co-occurrences of identified concepts; (4) Automatic categorization: developing an automated solution; and (5) Ontology building: building ontology for future CI analysis (Newman, 2010).
Web Mining
In turn, web mining are the methods and tools to process and analyze unstructured web contents based on XML, Internet protocols (HTTP, SMTP), and/or application programming interface (APIs). They enable developers to integrate diverse content from different web-enabled systems. A major component in web analytics is cloud computing, which includes applications, systems software, and hardware delivered as services over the Internet (Veber, 2012; Riad and Hassen, 2008).
Exponential Random Graph Models (ERGMs)
ERGMs are a family of statistical models for analyzing data concerning social and other networks (Robins, 2007). To support statistical inference on the process influencing the formation of network structure, ERGMs consider the set of all possible alternative networks weighted on their similarity to observed networks. Such tools like UCINet and Pajek have been developed and are widely used for large-scale network analysis and visualization (Borgatti et al., 2002). In addition, lightweight programming models of the current web services (HTML, XML, CSS, Ajax, Flash, J2J) and the maturing mobile development platforms such as Android and IOS have contributed to the rapid development of mobile web services (HTML5, Mobile Ajax, Mobile Flash, J2ME) in various social networks.
Search Based Application
These applications enable users to find information from any source and in any format with a search-based application. The user can enter anything he knows about the customer or product, and the search engine will try to find those customers or products that resemble the keywords entered by the user Capgemini (Capgemini, 2013).
Real-time BI
Real-time BI systems deliver information about business operations with minimum latency. While traditional BI presents historical information to users for analysis, real-time BI compares current business events with historical patterns to detect problems or opportunities automatically. Real-time ETL tools collect the operational data from different heterogeneous sources for centralized data integration in real-time. Business rules are analyzed through query and reporting tools in real-time (Sahay and Ranjan, 2008).
In-memory Databases and BI
In-memory BI refers to business intelligence software that utilizes an in-memory database (IMDB) for data processing. An IMDB is a database management system that is designed for best performance when there is enough computer memory (RAM) to hold the needed data. This is in contrast to Relational Database Management Systems. In-memory databases promise real-time business intelligence, allowing tighter control over inventory and eliminating long wait times to get answers to business questions. They also allow companies to run simulations and 'what-if' scenarios to determine the best product mix or course of action that previously would have been impossible because of time constraints. The speed of in-memory databases makes it possible to test many mixes of product, pricing and strategy in modeling scenarios to determine the best strategies (Cook, 2015).
NoSQL
NoSQL databases are increasingly used in big data, real-time web applications and real-time BI. A NoSQL database provides a mechanism for storage and retrieval of data that is modeled by means other than the tabular relations used in relational databases. Motivations for this approach include simplicity of design, horizontal scaling, and finer control over availability. NoSQL systems are also called "Not only SQL" to emphasize that they may also support SQL-like query languages. MapReduce, Hadoop, Cassandra or Hypertable are the example of platforms that provide mechanisms for ad hoc and on-time extraction, parsing, processing, indexing and analytics in a scalable and distributed environment (Chen et al., 2012).
Dashboards
These are tools for visualization of important business data presented in the form of graphic indicators, charts and tables (Kirtland, 2006; Vasiliu, 2009). Sometimes dashboards are treated as an easy to read, often single page, real-time user interface, showing a graphical presentation of the current status and historical trends of an organization’s key performance indicators to enable instantaneous and informed decisions to be made at a glance. They extend static reporting on analytical elements. They aggregate and sensitize data using such methodologies like: BSC, SixSigma, and Economic Value-Added. So, they enable managers to better assess operational and strategic information and better understand business. Interactive visualization tools
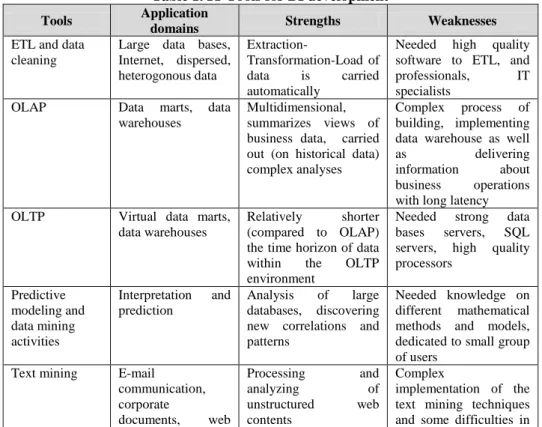
Interactive visualization tools enable decision makers to dynamically explore ideas, investigate patterns, uncover hidden facts and share those insights across the enterprise for better decision making. An extensive suite of customizable graphical presentation options present information and insights not easily detected in tabular formats (SAS, 2013). To sum up this section, the main strengths and weaknesses of IT tools for BI development are presented below (Table 1).
Table 1. IT Tools for BI development Tools Application
domains Strengths Weaknesses ETL and data
cleaning
Large data bases, Internet, dispersed, heterogonous data Extraction-Transformation-Load of data is carried automatically
Needed high quality
software to ETL, and
professionals, IT
specialists
OLAP Data marts, data
warehouses
Multidimensional, summarizes views of business data, carried out (on historical data) complex analyses
Complex process of
building, implementing data warehouse as well
as delivering
information about
business operations
with long latency
OLTP Virtual data marts,
data warehouses
Relatively shorter
(compared to OLAP) the time horizon of data
within the OLTP
environment
Needed strong data
bases servers, SQL
servers, high quality processors Predictive modeling and data mining activities Interpretation and prediction Analysis of large databases, discovering new correlations and patterns
Needed knowledge on different mathematical methods and models, dedicated to small group of users
Text mining E-mail
communication, corporate documents, web Processing and analyzing of unstructured web contents Complex implementation of the text mining techniques and some difficulties in
pages and social
media content,
opinion mining
interpretation of
obtained results
Web mining Cloud computing,
SOA, social media, opinion mining
Integrating diverse
content from different web-enabled systems
Complex
implementation of the web mining techniques and some difficulties in
interpretation of obtained results Exponential random graph models (ERGM) Large-scale network analysis and visualization, mobile web services, various social networks Using of mobile platforms such as
Android and IOS
Needed knowledge on statistical models
Search based application
Find information
from any source and in any format
Independent from IT departments, can work
with existing information systems Complex process of development of search based application Real-time BI and in-memory databases and BI
Big data, Internet
resources social media, blogs, mobile devices Process on-demand, in real time Needed high-quality
hardware and software
NoSQL Big data, Internet
resources, social
media, blogs,
mobile devices
Process and analyze of semi-structured data
Needed high-quality
hardware and software, sophisticated statistical methods to process and analyze of data Dashboards and interactive visualization tools Visualization of
data, real-time user interface; Dynamic business visualization, interactive simulations and optimization Using different methodologies: BSC, SixSigma, Economic Value-Added, dedicated to managers; Providing highly interactive
business graphics and analytics
Presentation of current status, indicators and historical trends in organization; needed high-quality hardware and software (Adobe Flash, Java, ActiveX)
Conclusion
This research was motivated by two considerations: (1) Business Intelligence is a component that enhances the ability of organizations to retain their competitive advantage, (2) too little research has been conducted worldwide to focus on IT tools for BI development. This research proposes a whole bundle of IT tools for BI development. They included: ETL, data cleaning, OLAP, OLTP, predictive modeling and data mining, text mining, web mining, exponential random graph models, search based application, real-time BI, in-memory databases and BI, NoSQL, dashboards and interactive visualization tools. Some strengths and weaknesses of analyzed IT tools have been identified.
Analysis of the literature, critical thinking as well as own experiences of working with different software, have shown that BI requires permanent development
and adaptation to new challenges and expectations of organizations. This development has to be based on various IT tools. Traditional IT tools for BI development such as: OLAP, data marts, data warehouses are insufficient. Organizations need to use IT tools focused on acquisition, analysis and discovering new knowledge from Internet, social media, and big data requiring more advanced IT tools. They include among others: real-time BI, search based application, as well as NoSQL, and web mining. However, it should be noticed that the usage of such tools requires employees of organizations to possess an "analytical erudition", soft skills, e.g., culture-based on facts and knowledge, trust, human resources management or managing analytical/creativity people.
The study makes theoretical contribution to the relevant literature. First, IT tools for BI development are generally an unexplored field of research. Therefore, the current study contributes to the literature on BI by investigating the issue of IT that supports the BI development. Second, the current study is unique because it proposes a comprehensive bundle of different IT tools for BI development. Third, this research argues that organizations should be aware of the strengths and weaknesess of the usage of different IT tools in BI develoment and the consequences for their business.
References
Borgatti S.P., Everet M.G., Freeman L.C., 2002, UCInet for Widows: Software for Social
Network Analysis, Harvard, MA Analytic Technologies.
Capgemini, 2013, Consulting. Technology. Outsourcing, http://www.capgemini.com/sites/ default/files/resource/pdf/Search-Based_BI.pdf, Access on: 18.09. 2013.
Chaudhary S., 2014, Management factors for strategic BI success, [in:] M.S. Raisinghani (Eds.), Business Intelligence in digital economy. Opportunities, limitations and risks, IGI Global, Hershey.
Chen H., Chiang R.H.L., Storey V.C., 2012, Business Intelligence and analytics: from Big
data to big impact, “MIS Quarterly”, 36(4).
Clavier P.R., Lotriet H., Loggerenberger J., 2012, Business Intelligence Challenges in the
Context of Goods-and Service-Domain Logic, [in:] Proceedings of the 45 Hawaii
International Conference on System Science, IEEE Computer Society.
Conn S.S., 2015, OLTP and OLAP Data Integration: A Review of Feasible Implementation
Methods and Architectures for Real Time Data Analysis, http://academic.regis.edu/
cias/Library/pid54211.pdf, Access on: 15.02. 2015.
Cook R., 2015, In Memory Databases For BI Applications and ERP, http://it.toolbox.com/blogs/inside-erp/in-memory-databases-for-bi-applications-and-erp-61150, Access on: 20.02. 2015.
Davenport T.H., Harris J.G., 2007, Competing on Analytics, The New Science on Winning,
Harvard Business School, Press Boston Massachusetts.
Davenport T. H., Harris J. G., Morison R., 2010, Analytics at Work: Smarter Decisions,
Better Results, Cambridge, Harvard Business Press.
Hannula M., Pirttimaki V., 2003, Business intelligence empirical study on the top 50
Isik O., Jones M. C., Sidorova A., 2011, Business Intelligence (BI) Success and the Role of
BI Capabilitie, “Intelligent Systems in Accounting, Finance and Management”, 18.
Kirtland A., 2006, Executive Dashboard, http://DSSResources.com, Access on: 10.02. 2006.
Larose D.T., 2005, Discovering Knowledge in Data. An Introduction to data Mining, New York, John Wiley & Sons, Inc.
Larson B., 2008, Delivering Business Intelligence with Microsoft SQL Server 2008, New York, McGraw-Hill Osborne Media.
Meyer S.R., 2001, Which ETL Tool is Right for You?, “DM Review Magazine“, June 1.
Moss L., Atre S., 2003, Business Intelligence Roadmap: The Complete Lifecycle for
Decision-Support Applications, Boston, Addison-Wesley.
Negash S., Gray P., 2008, Business Intelligence, [in:] F. Burstein and C.W Holsapple (Eds.), Decision Support Systems, Berlin, Springer.
Newman M.E.J., 2010, Networks. An Introduction, Oxford, Oxford University Press. Olszak C.M., 2014a, An overview of information tools and technologies for competitive
intelligence building. Theoretical approach, “Issues in Informing Science and
Information Technology”, 11.
Olszak C.M., 2014b, Business Intelligence and Analytics in Organizations, [in:] M. Mach-Król, C.M. Olszak, T. Pełech-Pelichowski (Eds.), Advanced in ICT for Business, Industry and Public Sector, London, Springer.
Olszak C.M, 2014c, Business Intelligence in cloud, “Polish Journal of Management
Studies”, 10(2).
Olszak C.M., 2015, Towards better understanding and using of Business Intelligence in
organizations, “Information Systems Management” (in print).
Poul S., Gautman N., Balint R., 2003, Preparing and data mining with Microsoft SQL
Server 2000 and Analysis Services, New York, Addison-Wesley.
Riad A.M., Hassan Q.F.,2008, Service-Oriented Architecture – A New Alternative to
Traditional Integration Methods in B2B Applications, “Journal of Convergence
Information Technologies”.
Robins G., Pattison P., Kalish Y., Lusher D., 2007, An Introduction to Exponential Random
Graph (p*) Models for Social Networks, “Social Networks”, 29(2).
Sahay B.S., Ranjan J., 2008, Real time business intelligence in supply chain analytics, „Information Management & Computer Security“, 16(1).
SAS, 2013, https://www.sas.com/technologies/bi/visualization, Access on: 15.09. 2013. Schick A., Frolick M., Ariyachandra T., 2011, Competing with BI and Analytics at Monster
Worldwide, [in:] Proceedings of the 44 Hawaii International Conference on System
Sciences, Hawaii.
Tan P.N., Steinbach M., Kumar V., 2005, Introduction do Data Mining, New York, Addison-Wesley.
Vasiliu A., 2009, Dashboards and scorecards: linking Management Reporting to
Execution, http://DSSResourcess.com, Access on: 10.02. 2009.
Veber J. 2012, Operational-economic aspects of cloud computing, [in:] M. Tvrdikova, J. Minster and P. Rozenhal (Eds.), IT for Practice, Ostrava, VSB-TU Economicka Faculta. Vercellis C., 2009, Business Intelligence, Chichester, Wiley.
Witten I.H., Frank E., Hall M., 2011, Data Mining: Practical Machine Learning Tools and
Wixom B.H., Watson H.J., Werner T., 2011, Developing an Enterprise Business
Intelligence Capability: The Norfolk Southern Journey, “MIS Quarterly Executive”,
10(2).
NARZĘDZIA TECHNOLOGII INFORMACYJNEJ W ROZWOJU BUSINESS INTELLIGENCE W ORGANIZACJACH
Streszczenie: Celem artykułu jest rozpoznanie możliwości różnych narzędzi IT do budowy aplikacji Business Intelligence (BI). Na wstępie zidentyfikowano istotę BI oraz opisano trzy etapy rozwoju systemów BI. Następnie omówiono różne narzędzia IT, jakie mogą być stosowane do budowy BI w organizacjach. Ostatecznie, mocne i słabe strony tych narzędzi zostały zaprezentowane. Badania zostały przeprowadzone w oparciu o krytyczną analizę literatury przedmiotu. Wyniki badań mogą być interesujące dla specjalistów IT oraz menedżerów, którzy planują tworzenie aplikacji BI w swoich organizacjach.
Słowa kluczowe: Business Intelligence, organizacja, narzędzia technologii informacyjnych
信息技術手段的商業智能發展組織中 摘要:本研究的研究目的是研究商業智能(BI)開發不同的信息技術(IT)工具。 首先,BI的問題是確定和不同年齡的BI開發被提出。然後,在BI開發中最重要的IT 工具進行了討論。最後,一些優勢和描述工具的優缺點進行了論證。這項研究主要 是基於文學,創造性思維和解釋哲學的批判性分析。這項研究的結果可以通過IT和 商界領袖作為他們計劃和發展在他們的組織BI應用程序。 關鍵詞:商業智能,組織,信息技術工具