CHAPTER 20. JOB CREATION AND EMPLOYMENT IN A TIME OF CRISIS
Kosovka OGNJENOVIĆ
2Aleksandra BRANKOVIĆ
3Abstract:
Serbian economy has been severely affected by the latest global economic crisis. After salient slowdown in the last quarter of 2008, the national economy went into recession that was followed by gradual reductions in GDP and employment, transient fall in the rate of inflation and sustained rise in unemployment. Despite the fact that the corporate sector has even slightly enlarged during the observed period, it is evident that this sector has experienced significant contractions too. These contractions are evident due to permanent decline in firm size, owing to the negative employment growth, and due to deterioration in key business performance indicators. The dynamic of the growing number of enterprises was driven by micro and to some extent by small firms, which have narrow potentials for further growth of employment without significant enlargement of the number of enterprises. The Serbian economy is a vulnerable transition economy that strongly reacts to shocks. In regular conditions, before the global economic crisis, expansion of the corporate sector was not sufficient to absorb majority of workers. Following the background facts, in this chapter we have examined potentials for job creation and destruction by size of enterprises and main sectors of economic activity. For this purpose we have used the nationally representative survey of firm-level data collected during May 2011. We have found that Serbian economy creates 7.6% of new jobs per year. Almost the same percentage of jobs has been destroyed, meaning that job destruction in contracting firms contributes in almost the same proportion to the excess job reallocation as creation of new jobs in expanding firms.
Key words: job creation, excess job reallocation, employment, economic crisis, Serbia.
1
This paper is a part of research projects: 179015 (Challenges and prospects of structural changes in Serbia: Strategic directions for economic development and harmonization with EU requirements) and 47009 (European integrations and social and economic changes in Serbian economy on the way to the EU), financed by the Ministry of Education, Science and Technological Development of the Republic of Serbia.
2
Kosovka Ognjenović, MSc, Institute of Economic Sciences, 12 Zmaj Jovina, 11000 Belgrade, Serbia. E-mail: [email protected].
3
Aleksandra Branković, MA, Institute of Economic Sciences, 12 Zmaj Jovina, 11000 Belgrade, Serbia. E-mail: [email protected].
INTRODUCTION
Effects of the global economic crisis intensified during the first quarter of 2009 when the Serbian economy went into recession, which was followed by a significant decline in annual industrial production (-12.6%) and gross domestic product (GDP) – real GDP growth rate recorded a year-on-year decline of 3.5%. A slowdown of the national economy decelerated the rate of inflation that in 2009 accounted for 6.6%, but went up to 10.3% in 2010 and then slowly decreased to 7% in 2011. Principal indicators of economic development indicate unfavourable environment for job creation and job flows, so, as a result, the labour market has been severely affected by the global economic crisis too. In 2009 unemployment rate of the economically active population increased to 16.9%, while the employment-to-population ratio dropped to 50.4%, i.e. both rates deteriorated in relation to 2008 by 2.5 and 3.3 percentage points, respectively. Sharp continuous reduction in employment and increase in unemployment significantly worsened both rates, so that in 2011 the unemployment rate rose to 23.6%, while the employment rate fell to 45.4% (Statistical Bureau of Serbia’s LFS 2011). Contemporaneously, in the EU the GDP growth stagnated and in 2008 the average real growth rate for EU-27 accounted for 0.9% (European Commission 2009: 13). The EU-27 unemployment rate in 2008 was 7.1%, while in 2011 this rate rose to 9.7%. The EU experienced a fall in employment that was particularly sharp in 2009 (-1.8%), and then stabilised in 2011 with smooth increment of 0.2%. Consequently, the employment rate for EU-27 deteriorated from 65.8% in 2008 to 64.3% in 2011.
The labour market dynamic in Serbia cannot be observed partially, taking into account only influences of the latest global economic crisis, without perceiving the developments over the course of the transition that occurred in the early 2000s. In fact, the economic crisis caused the deepening of the recession that had already determined the first half of the 2000s and the continuation of a disrupted process of privatization and restructuring of the corporate sector that commenced in the early 1990s. Gradual employment decrease, followed by permanent increase in unemployment and separation of economically active population from the labour market, uniquely describe paths of transitional economies at least at the beginning of the ownership transformation processes in those countries (see Lehmann et al. 2005; Jurajda and Terrell 2003; Vujčić 1998). Despite the high real GDP growth rates of over six percent in the mid-2000s, Serbia experienced almost jobless growth, as most of other countries experienced during transition periods (Micevska 2008). Actually, in Serbia certain recovering of the employment growth occurred with a time lag of one or two years, but it was interrupted by the economic crisis and all positive influences were diminished.
This chapter particularly examines the shape of employment growth dynamic and job creation in Serbia in the light of the latest economic crisis that pushed the national economy into recession. We explore all available data – national Labour force survey (LFS) data, official statistical data on firms’ dynamic and firm-level data on job creation and job destruction – in order to discover main sources of potential employment and job growth in Serbia. We start our research with a known premise, which claims that the overall employment of advanced transitional economies is affected more by the dynamic of insufficient new jobs creation than by destruction of old jobs.
The chapter is structured into four sections. In section two we started with the background analysis of economic conditions and business environment changes over the course of the global economic crisis and in the post-crisis period. This section is enriched by screening of employment growth and firm dynamics over the observed periods. In section three we presented an empirical analysis of job creation, job destruction and excess job reallocation using firm-level data of the sample of Serbian enterprises. The chapter ends with main findings and conclusions.
BACKGROUND
Economic Conditions and Business Environment
The Serbian economy entered recession in the first quarter of 2009 (although substantial deceleration of the GDP growth rates was observed during several preceding quarters (Ognjenović and Branković 2010b: 121)). In 2010 the situation somewhat improved, and production started to increase (Fig. 1). However, since the second half of 2011 situation seems to be deteriorating again: GDP started to stagnate, and in the first quarter of 2012 it dropped in relation to the same period a year before by 1.1%.
Figure1: Quarterly rates of real GDP growth, Q1 2009- Q1 2012, in %
-4.1 -4.2 -2.3 -1.6 0.6 2.0 2.7 2.0 3.1 2.3 0.5 0.4 -1.1
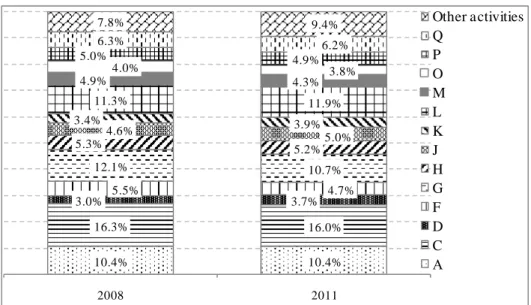
However, despite the fact that since the beginning of the global crisis economic situation in Serbia cannot be regarded as favourable, given that only in the second half of 2010 and the first half of 2011 quarterly rates of GDP growth could be deemed as somewhat satisfactory, GDP data do not show that restructuring of the economy has taken place. Namely, as evident in Fig. 2, the structure of gross value added (GVA), according to activities, remained virtually the same in 2011 as it was in 2008.
Figure 2: Structure of GVA according to economic activities, 2008 and 2011, in %
10.4% 10.4% 16.3% 16.0% 3.0% 5.5% 3.7% 4.7% 12.1% 10.7% 5.3% 5.2% 4.6% 5.0% 3.4% 3.9% 11.3% 11.9% 4.9% 4.3% 4.0% 3.8% 5.0% 4.9% 6.3% 6.2% 7.8% 9.4% 2008 2011 Other activities Q P O M L K J H G F D C А
Abbreviations: А-Agriculture, forestry and fishing; C-Manufacturing; D-Electricity, gas, steam and air condition supply; F-Construction; G-Wholesale and retail trade, repair of motor vehicles and motorcycles; H-Transportation and storage; J-Information and
communication; K-Financial and insurance activities; L-Real estate activities; M-Professional, scientific and technical activities; O-Public administration and defence, compulsory social security; P-Education; Q-Human health and social work activities. Note: “Other activities” refer to activities whose share in the value of GVA was less than
2% and these were: Mining and quarrying; Water supply, sewage waste management and remediation activities; Accommodation and catering; Administrative and support
service activities; Arts, entertainment and recreation; Other service activities, and Activities of households as employers.
Source: Statistical Bureau of Serbia 2011, p. 120, and Statistical Bureau of Serbia 2012. Environment for conducting business activities has also remained pretty unchanged since the beginning of the economic crisis, according to the World Bank data (World
Bank 2008 and World Bank 2011).4 Namely, the overall position of Serbia according to the “Ease of doing business” index has slightly improved relative to other countries in the latest edition of the “Doing Business” report in relation to the one published in 2008. However, by analysing data on Serbia in more detail, one can note that the rankings related to most of the observed indicators did deteriorate: except for starting a business and getting credit rankings, in all other categories Serbia’s position in relation to other countries has worsened. Data on the ranks of Serbia regarding various components that comprise the overall “Ease of doing business” rank are given in Table 1.
Table 1: Ranking of Serbia in the World Bank’s “Doing Business” publications
Indicator Doing Business 2009 Doing Business 2012
Ease of doing business 94 92
Starting a business 106 92
Dealing with construction
permits 171 175 Getting electricity – 79 Registering property – 39 Getting credit 28 24 Protecting investors 70 79 Paying taxes 126 143
Trading across borders 62 79
Enforcing contracts 96 104
Resolving insolvency 99 113
Note: In the report “Doing Business 2009” a total of 181 countries was observed, while in the 2012 edition that was the case with 183 countries.
Source: World Bank (2008), p. 132; World Bank (2011b), p. 124.
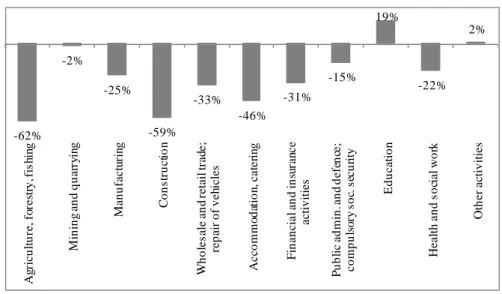
Unlike data on the sectorial structure of GDP and indicators of business environment, data on employment show that certain changes did occur, and that for many Serbian enterprises one of the ways to deal with the global economic crisis was to lay-off workers. However, employees were not equally affected across different economic sectors. Due to the fact that the new Classification of activities was introduced in 2010, data on employment across various economic activities are not fully compatible for 2008 and 2011, but, despite that, one can note that for some of the major activities data on changes in employment show drastic changes. As evident from data presented in Fig. 3, in the sector of agriculture, forestry and fishing and in the sector of construction, the number of employed persons during
4
In the publication “Doing Business 2009” period June 2007-June 2008 is observed, while in the latest publication, “Doing Business 2012”, period June 2010-June 2011 is taken into account.
the observed three-year period decreased by as much as around 60%. Largest employers, sectors of manufacturing and trade, who comprised 40% of the number of employed persons in 2008, also faced major lay-offs, so that the number of employed in 2011 in relation to 2008 decreased by ¼ and 1/3, respectively.
Figure 3: Changes in the number of employed persons across economic activities, 2011/2008, in % -62% -2% -25% -59% -33% -46% -31% -15% 19% -22% 2% A gr ic u lt u re , fo re st ry , f is hi ng M in in g an d q u ar ry in g M an u fa c tu ri ng C o n st ru ct io n W h o le sa le a n d re ta il tr ad e; re p ai r o f v e hi cl es A c co m m o d at io n , c a te ri n g F in a n ci a l a n d i n su ra nc e a ct iv it ie s P u b li c ad m in . a n d d ef en ce ; c o m p u ls o ry s o c. s ec u ri ty E d u ca ti o n H ea lt h a n d s o ci al w o rk O th er a ct iv it ie s
Source: Authors’ own calculations based on data from the Labour Force Survey. One can also argue, based on data shown in the previous figure, that employees in the private sector were overwhelmingly affected by the crisis, while in the case of those mainly employed in the state sector the situation did not so drastically deteriorate. Although lay-offs occurred in the state sector as well, decrease in the number of employees was less pronounced. Fig. 3 shows that in 2011 in relation to 2008 22% of those employed in activities related to health and social work ceased to work, while it was the case with 15% of those engaged by public administration, defence and social security. In the case of education, which is also dominantly state-owned, the number of employed even increased during the observed period, by 19%.
Employment and Firm Dynamics
The labour market in Serbia has been severely affected by the global economic crisis. Labour market flows show a gradual fall in the total number of economically active working age population, while at the same time inactivity has been on the increase. The global economic crisis has not been the most prevalent reason for unfavourable
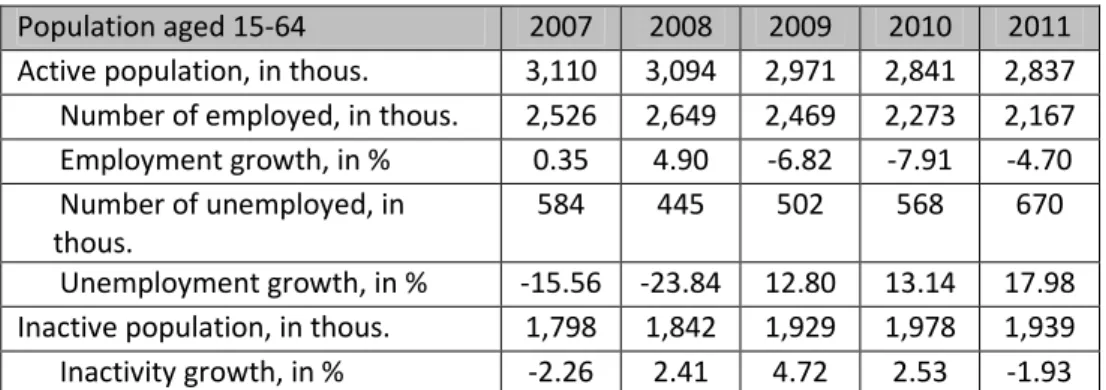
features of the Serbian labour market. Chronic insufficiency of new jobs, aided by the structural unemployment and unfavourable conditions for running business, are among the most significant obstacles for the improvement of the labour market conditions. Those conclusions are supported by the latest OECD assessment of the investment climate in the region of South-East Europe (SEE), that puts Serbia at the seventh position out of ten countries in terms of performances of the human capital development (OECD 2010: 95). Serbia left only three countries behind – Bosnia and Herzegovina, Albania and the territory of UNMIK/Kosovo – whose scores on this dimension of the investment reform index were assessed to be the worst. As Table 2 indicates, employment flows have been reverse in relation to non-employment flows since the beginning of the crisis in a second half of 2008 to 2011. Over a four-year period total employment declined by 18%, while contemporaneously total number of unemployed persons was higher by ½. The difference between those who stayed economically active and those who left the labour market between 2008 and 2011 indicates that there occurred a loss of more than 350 thousand people, who became separated from the labour market (including those who achieved requirements on retirement). Thereto, due to recent demographic trends, the gap between the economically active and inactive working age population has narrowed. Table 2: Dynamics of the working age population 15-64 by activity status, 2007-2011
Population aged 15-64 2007 2008 2009 2010 2011
Active population, in thous. 3,110 3,094 2,971 2,841 2,837
Number of employed, in thous. 2,526 2,649 2,469 2,273 2,167
Employment growth, in % 0.35 4.90 -6.82 -7.91 -4.70
Number of unemployed, in thous.
584 445 502 568 670
Unemployment growth, in % -15.56 -23.84 12.80 13.14 17.98
Inactive population, in thous. 1,798 1,842 1,929 1,978 1,939
Inactivity growth, in % -2.26 2.41 4.72 2.53 -1.93
Source: Statistical Bureau of Serbia, Bulletin on the Labour Force Survey, various issues. Authors’ own calculations.
In particular, discouraging labour market developments during the period of the global economic crisis have been peculiar for the youth aged 15-24 years and for women. For these two categories of labour market participants common characteristics have been gradual decreases of the employment and increases of the unemployment rates. The youth unemployment and employment rates in 2007 stood at 43.3% and 18.7%, respectively. In 2011 these two rates were deteriorated and the youth unemployment rate rose to 50.9%, while the employment rate declined to 14%. A steady increase in the number of employed women was stopped
in 2008 when their employment rate was 45.3%, and after gradual annual decreases it stood at 38.3% in 2011. The unemployment rates of women were 16.7% and 24.3% in 2008 and 2011, respectively. Therefore, the main difference between young people and women who actively participate in the Serbian labour market has been the divergence of the unemployment and employment rates for the former and the convergence of these two rates for the latter. Both observations are discouraging, and they indicate the need to review previous governmental labour market policy measures that were created to support employment of these categories of registered unemployed people.
Gradual ownership transformation of the Serbian economy through the processes of privatisation and restructuring significantly contributed to the changes of the national labour market, particularly in the first half of the 2000s, when large scale privatisations took place. Labour market was overloaded by thousands of workers with previous work experience, who were laid-off from their former jobs. Only around 10% of former employees who returned to labour market had quit their jobs voluntarily (Stošić et al. 2012: 367). This situation produced a new category of participants in the Serbian labour market, known as redundant workers. Results of the analyses of the success of privatisations of state-owned enterprises indicate that the governments of the SEE and former Soviet Union countries failed to solve the problem of redundant workers (Rutkowski and Scarpetta 2005). For instance, the Government of Serbia founded the Transition fund that was intended to support redundant workers and help them reintegrate into the labour market, but resources of the Fund melted down in the first years of the ownership transformation of enterprises. There also exist positive examples of solving the problem of displaced workers, and it is the case of those transition economies that were strongly oriented towards performing structural reforms. One of these countries is Estonia that started comprehensive reforms in 1992. This country experienced propulsive transformation of its economy that was followed by high incidence of quits and displacements of workers from their previous jobs. The incidence of quits was common for those workers who voluntarily left jobs or opted for retirement, and it dominated over the incidence of displacement during the first several years of transition. At the same time, a significant labour reallocation from state-owned to privatized or new privately-owned enterprises occurred. During the period 1992-1998 Estonia gradually downsized the state sector, and the share of displaced workers who moved from the state to the private sector amounted to ¾ at end-1998 (Lehmann et al. 2005: 66).
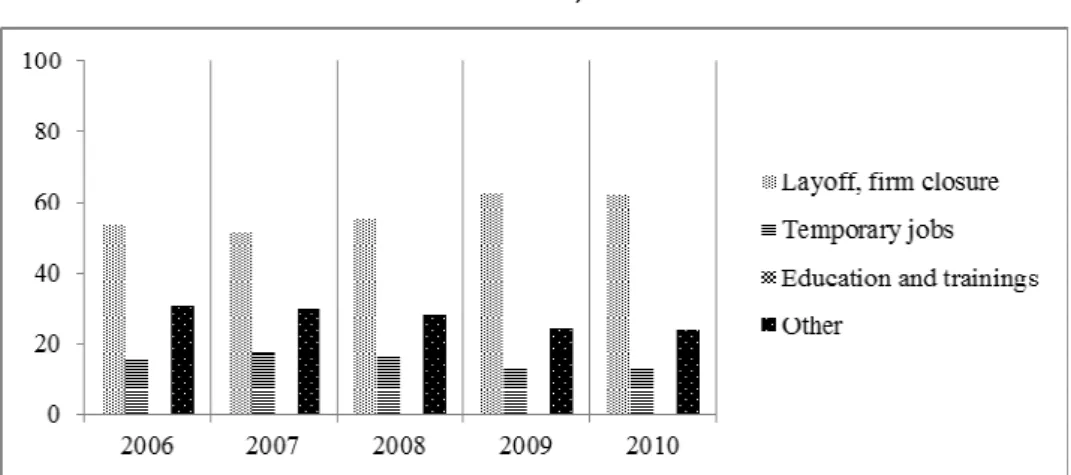
The problem of redundant workers in Serbia is still accurate. The most recent data for 2011 show that the share of unemployed people with previous work experience is 64%, while the rest of the unemployed are new comers to the labour market – the share of the former rose by 6.2 percentage points in comparison to 2008. As Fig. 4
reveals, the most significant reasons for termination of employment contracts have been lay-offs and firms closures. After the beginning of the crisis the share of those whose jobs were terminated due to these reasons exceeded 3/5 of the total number of unemployed people, which means that the crisis contributed to the negative dynamic of firm developments as well. Separations from jobs due to pursuing further education and trainings are almost negligible and have been on the permanent decline from 2008 to 2011 – the share has decreased from 0.8% to 0.3%. In addition, the share of separations from employment due to expiration of temporary employment contracts and some other personal reasons has been slowly decreasing over the period of crisis.
Figure 4: Reasons for permanent or temporary termination of employment, 2006-2010, in %
Source: Statistical Bureau of Serbia, Bulletin on the Labour Force Survey, various issues. Authors’ own calculations.
Growth of the private sector employment in Serbia is not sufficient as one may expect, because a significant number of socially- and state-owned enterprises are already privatized or closed down. The private sector in Serbia employs a little more that ½ of the salaried workers, and this share has slightly decreased over the period of crisis. On the contrary, the state sector has increased the number of the employed during the crisis. This increase was stopped in 2011 when the share of the state sector as an employer exceeded 2/5 of the overall employment. By analysing structural reforms in the Croatian labour market at the beginning of economic transition, Vujčić (1998) came to the conclusion that a transition economy needs to be determined and faster in performing structural reforms in order to increase productivity of enterprises and overall employment. Comparing progressive countries of the SEE and those with delayed restructuring during the 1990s, which is the case of Serbia as well, Vujčić (1998) confirmed the significance of the relationship between employment and GDP, showing that the employment decrease
causes almost instantaneously a decline in GDP. Depending on the success of structural reforms, this decline can be observed as a short-term or a long-term feature of an economy. Consequently, transition economies with delayed and slow restructuring of the corporate sector would suffer from recessions even without occurrence of the global economic crises.
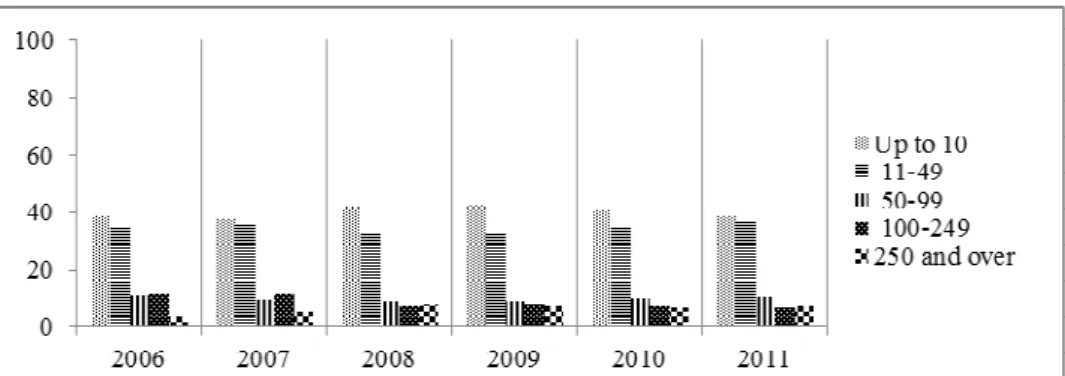
The previous paragraph is an introduction to the analysis of employment growth in the light of firms’ dynamics. As can be seen in Fig. 5, two extremes in the distribution of firm size, i.e. micro (up to 10 employees) and large-sized enterprises (more than 249 employees), have experienced decline in the total number of employed during the crisis period. The share of small firms that employ between 10 and 49 workers and medium-sized firms of the first quartile (50-99 workers) barely increased, while the share of medium-sized firms with 100 to 249 workers slowly decreased. According to the 2011 data micro enterprises employ around 2/5, small firms together with the first quartile of medium-sized ones almost a half, while the rest of the employed is equally distributed between the median and upper quartiles of medium- and large-sized enterprises.
Figure 5: Distribution of employed population aged 15-64 years by firm size, 2006-2011, in %
Source: Statistical Bureau of Serbia, Bulletin on the Labour Force Survey, various issues. Authors’ own calculations.
There is a conventional wisdom that employment legislation may slow down or suppress employment growth, in particular in economies that transform their corporate sectors. In terms of the OECD measure on the Employment Protection Legislation (EPL), the Serbian EPL is less flexible than is the case in most of the old EU member states and in new member states of the EU (except Slovenia), but it is less strict than in other former Yugoslav republics (Table 3). The strictness of the Serbian EPL comes primarily from restrictive terms for collective dismissals, and, to a lesser
extent, from restrictive conditions set up for temporary and regular employment
contracts.5
Table 3: Employment protection legislation indices for Serbia and selected countries; scale from 0 (least restrictions) to 6 (most restrictions)
Country Regular employment Temporary employment Collective dismissals Overall protection Serbia 2.2 2.4 2.9 2.4 Croatia 2.6 2.6 3.5 2.8 FYR Macedonia 2.0 3.1 4.0 2.8 New EU countries Czech Republic 3.1 0.9 2.1 2.0 Estonia 2.5 1.8 3.3 2.1 Poland 2.1 1.8 3.6 1.9 Slovak Republic 2.5 0.4 3.8 1.4 Slovenia 3.2 1.9 2.9 2.5 Old EU countries Denmark 1.6 1.4 3.1 1.5 France 2.5 3.6 2.1 3.1 Germany 3.0 1.3 3.8 2.1 Italy 1.8 2.0 4.9 1.9 Sweden 2.9 0.9 3.8 1.9 United Kingdom 1.1 0.4 2.9 0.8 United States 0.2 0.3 2.9 0.2 OECD average 2.1 1.8 3.0 1.9 Russian Federation 3.0 0.9 1.9 1.9
Notes: For Serbia indices incorporate changes of the 2005 Labour Law. For FRY Macedonia data refer to 2003, while for all other countries data refer to 2008.
Source: OECD (2008) for Serbia, Table 2.5, pp. 57-58; The World Bank (2011a) for Croatia, Fig. 7, p. 17; Micevska (2008) for FRY Macedonia, Table 1, p. 350; For the rest of the countries OECD data base available at: www.oecd.org/employment/protection.
There is no such analysis for Serbia that would rate the influence of the EPL on job creation and employment flows. However, certain analysis based on experiences of
5
In 2001 the first Labour Law was introduced as a support to the incoming processes of privatisation and restructuring and enlargement of the private sector in Serbia. During the four years of its enforcement, more than two fifths of all privatisations were finished (out of 2.4 thousand enterprises in total), with the similar share of workers in these enterprises (employment in all privatized enterprises during the period 2001-2011 has amounted to 333 thousand). In 2005, the previous law sustained significant changes and after that it was amended twice – later in 2005 and in 2009 – but without changes regarding the provisions on employment protection.
transition economies confirmed that the major source of the EPL strictness that comes from protection of employees against dismissals has negative influence on employment growth and on job creation (see the World Bank (2011a) for Croatia;
Micevska (2008) for FRY Macedonia).6
The labour market in Serbia suffers from persistent long-term non-employment that is also result of the lack of structural reforms and new job openings. Before the crisis the share of unemployed people who were searching for jobs for two years and longer was more than 3/5. This share slowly decreased and in 2011 it stood at 55%. At the same time, the shares of those who have been searching for jobs up to twelve months and between one and two years converged over time, and in 2011 the rates for the former and the latter were ¼ and 18%, respectively. Almost surely, the labour market policy measures, such as subsidized employment for young people and apprenticeships, as a support to filling the gap between the knowledge earned during the schooling and required practical experience needed to those who want to get placed in jobs immediately after school, as well as temporary employment of disadvantaged people through public jobs, have mitigated the distribution of time spent on searching for employment. Over the transition period Serbia gradually increased the share of resources spent on active labour market policies, which account for around 0.1% relative to GDP (OECD 2008: 62), but this share is significantly lower in comparison to 0.5% of GDP spent by the OECD countries on average. Despite the fact that active labour market policies tend to become as important policy instrument as passive labour market policies were during the previous years (including unemployment benefits, early retirements and severance payments), their impact on employment growth is still of limited scope.
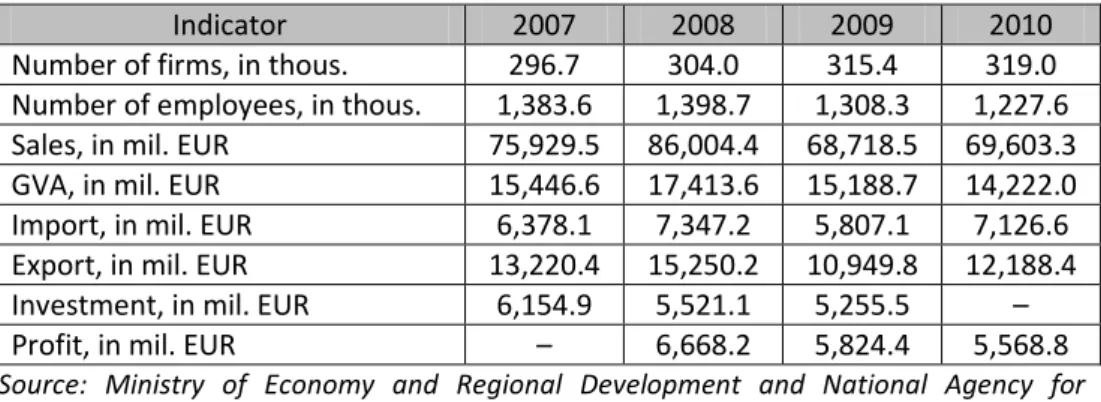
The nonfinancial corporate sector is employer of more than a half of the salaried workers in Serbia. The global economic crisis obviously broke down the employment growth in 2008, but the rise in the total number of enterprises was not affected by the crisis in such a way; however, it did face slowdown (Table 5). This can be partly explained by the fact that the government introduced a set of measures, including direct support through credits and grants, aimed at sustaining employment and enhancing liquidity of enterprises (Ognjenović and Branković 2010a: 262). However,
6
From the theory, it is known that strict protection against dismissals maintains the employment-to-population ratio below the level of half of the working age population. The case of Serbia shows that during the years 2007-2008, i.e. before the crisis deepened, the last major privatisations were finished, but also employment growth was recovered –employment rates exceeded 50%. After 2008 the privatisation process almost stopped. In addition, there is evidence that some reallocations of jobs from firms under privatisation to the private sector occurred due to the rises in gross job creation rates. As an illustration, Table 5 reveals that the rates of firm openings, which were predominantly driven by a growing number of micro enterprises and shops, were higher during the period before than in the post-crisis period.
when key business indicators of enterprises, given in Table 4, are deeply analysed backwards, we can see that all of them have deteriorated since 2008 onwards. The continuous falls in the two most important business indicators, which measure GVA and investments, and which may jeopardize potential growth of employment in the future, are particularly troublesome. Profits of enterprises permanently follow a downward trend as well.
Table 4: Key indicators of the nonfinancial corporate sector development in Serbia, 2007-2010
Indicator 2007 2008 2009 2010
Number of firms, in thous. 296.7 304.0 315.4 319.0
Number of employees, in thous. 1,383.6 1,398.7 1,308.3 1,227.6
Sales, in mil. EUR 75,929.5 86,004.4 68,718.5 69,603.3
GVA, in mil. EUR 15,446.6 17,413.6 15,188.7 14,222.0
Import, in mil. EUR 6,378.1 7,347.2 5,807.1 7,126.6
Export, in mil. EUR 13,220.4 15,250.2 10,949.8 12,188.4
Investment, in mil. EUR 6,154.9 5,521.1 5,255.5 –
Profit, in mil. EUR – 6,668.2 5,824.4 5,568.8
Source: Ministry of Economy and Regional Development and National Agency for Regional Development (2011), Annual Reports on SMEEs, various issues. Authors’ own calculations.
Over the last decade the number of established private enterprises more than doubled. In 2000, the number of enterprises established by private owners was barely 4.5 thousand, while in 2009 this number jumped to more than 10 thousand (Business Registration Agency of Serbia 2011: 19). The positive turn occurred in 2005 when certain requirements for the registration of enterprises (and sole traders or owners of shops) were liberalized, but obviously it was not sufficient for firms’ entry to the market and for being fully operative in business.
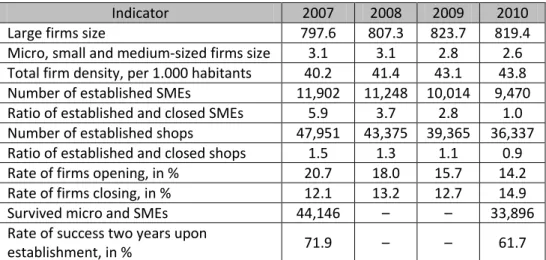
Large-sized enterprises participate in the total number of enterprises with a share of around 0.2%, which indicates the importance of micro and small- and medium-sized enterprises (Ministry of Economy and Regional Development and National Agency for Regional Development 2011: 14). Apart from the growing number of large-sized enterprises, discouraging is the fact that the size of micro and small- and medium-sized enterprises has been shrinking. In particular, since 2008 the size of these enterprises has become even smaller, meaning that one way to mitigate these differences is to further increase their number (Table 5). These unfavourable developments can be observed from the dynamics of establishment and closure of firms. In regard to the rates of firms’ opening and closing, Table 5 reveals that in 2010 the net effect of firms opening was negative – it stood at -0.7 percentage
points. These obvious negative effects on the employment growth are additionally supported by the decrease in the rate of firms that managed to survive over at least two years upon their establishments.
Table 5: Principal indicators of firm growth in Serbia, 2007-2010
Indicator 2007 2008 2009 2010
Large firms size 797.6 807.3 823.7 819.4
Micro, small and medium-sized firms size 3.1 3.1 2.8 2.6
Total firm density, per 1.000 habitants 40.2 41.4 43.1 43.8
Number of established SMEs 11,902 11,248 10,014 9,470
Ratio of established and closed SMEs 5.9 3.7 2.8 1.0
Number of established shops 47,951 43,375 39,365 36,337
Ratio of established and closed shops 1.5 1.3 1.1 0.9
Rate of firms opening, in % 20.7 18.0 15.7 14.2
Rate of firms closing, in % 12.1 13.2 12.7 14.9
Survived micro and SMEs 44,146 – – 33,896
Rate of success two years upon
establishment, in % 71.9 – – 61.7
Source: Ministry of Economy and Regional Development and National Agency for Regional Development (2011), Annual Reports on SMEEs, various issues. Authors’ own calculations.
AN EMPIRICAL ANALYSIS OF JOB FLOWS
Data and Methods
In order to analyse possible effects of the global economic crisis on job flows in Serbia, we will use firm-level data based on the Employer survey that was carried out for the first time by the National Employment Service during May 2011. Data collection was primarily based on the representative sample of Serbian enterprises that were selected from the National Statistical Register of Business Entities. The selected sample units represent only legal business entities (in this article interchangeably called enterprises and firms), which in their financial reports for 2009 noted to employ at least 10 workers. Sole trades or physical persons, which own their small businesses and shops, were excluded from the survey. The realized sample contains 4,096 enterprises. The sample covers enterprises of primary ownership structure, which are distributed by size given the standard accounting classification, starting with the provisional minimum enterprise size threshold of 10
employees,7 and by primary sectors of economic activity. The methodology of sample selection and key characteristics of the realized sample of enterprises are provided by Vasić et al. (2011).
We will define the job creation and job destruction rates following the theoretical concepts given by Mortensen and Pissarides (1994) and applied on similar sets of firm-level data for Poland and the U.S. (Rutkowski 2002; Haltiwanger 2011) or on worker-level data for Estonia and the Czech Republic (Jurajda and Terell 2003). In order to decrease the bias that is likely to be present in the rates of job creation and destruction that are obtained by using the truncated sample of firm-level data, we will correct these rates at the national level by adding the total number of openings and closures of shops and micro enterprises in a given year. This may partly substitute for the jobs created and terminated in micro enterprises, which were originally excluded from the sample. Unfortunately, we will not be able to further redistribute micro enterprises through sectors of economic activity.
Definition of the rates of job creation and job destruction starts as an expression of the change in employment at the level of an enterprise or sector of economic activity between two time periods. Let the time index denote the year of interest
and the initial year, while i denotes a business entity (or sector of economic
activity). If E is a measure of overall employment, then the difference or the change in employment between these two time periods can be written as . Based on the Employer survey data, employment is defined as the sum of all full-time workers with permanent (regular) and temporary labour contacts, but also the number of employees who are engaged in occasional and
seasonal jobs is recorded.8 Besides the total numbers of employees at the end of
two observed periods, the survey provides data on the number of employed workers due to the expansion of activities in growing firms, and the number of laid-off workers due to decreased activities in contracting firms. This way of measuring the employment gains and losses separates job creation from vacancies, but excludes
7
Despite the fact that small enterprises of up to 10 employees (that refers to micro enterprises) have significant share in the total employment, the threshold of 10 employees was provisionally given due to the expected gradual contractions of jobs in small firms over the course of the economic crisis and in the post-crisis period. The main intention of the Employer survey was to collect basic data on changes in the labour market requirements regarding the expansion of new and contraction of old occupations and skills, as well as on lacking of specific knowledge and skills that could be filled through firm-based trainings of employees. Due to this, job destructions and net employment gains for both small enterprises and overall economy are likely to be downward biased.
8
Permanent employment is the most common type of employment in Serbia. Temporary and seasonal jobs are less represented among the labour contracts. The 2011 LFS data show that the share of permanent or regular labour contracts in the total employment was 87.5%, while temporary employment accounted for 9.9% and occasional and seasonal jobs for just 2.6%.
those who quit jobs without replacement, causing that a measure of job destruction is likely to be to some extent underestimated. Knowing that the gross job creation rate by definition measures all employment gains in expanding enterprises as a proportion of total employment at the beginning of the year of interest, from the above expression it follows that in enterprises with positive changes in employment the job creation rate can be expressed as a positive difference,
i.e. , while otherwise, if the difference is negative,
the job creation rate is set to zero. Similarly, the gross job destruction rate by definition measures total employment losses in contracting enterprises as a
proportion of total employment, and can be expressed as
. The gross job destruction rate will be observed if the absolute value of the difference in employment between two time periods is greater than zero, while otherwise, the rate will be equal to zero. Accordingly, net gains in employment are positive differences between job creation and job destruction. At the end, the excess job reallocation rate is given as the difference between job turnovers – that summarise all job creations and job destructions – and the absolute value of the net employment rate, or it is expressed in the following
notation as .
Job Creation and Job Destruction
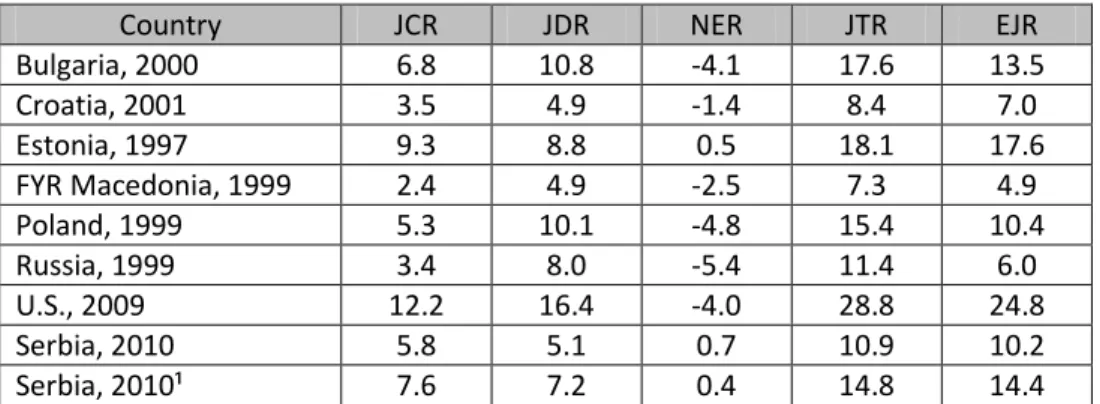
9In the Serbian economy a relatively low number of jobs is created and destroyed per year. Even if the rates presented in Table 6 differ throughout time periods and sectors of ownership, they can allow us to draw on some general conclusions. Except for the U.S., where data show a picture that can be related to the global economic crisis, data for all other observed countries cover periods of their prominent transitional changes. The rates of job creation and job destruction for Bulgaria, Estonia, FYR Macedonia and Russia refer only to the private sector enterprises, but they show that Bulgaria and Estonia were more determined in restructuring their enterprises through destroying unproductive jobs, which resulted in higher job turnover rates and in faster reallocation of jobs from the firms that experienced contraction of activity to the growing firms. In comparison with the U.S., which has one of the most flexible labour markets in the world, all other observed countries have significantly lower dynamics of job flows, which probably results in their sustained non-employment. Based on Table 6, that summarizes several indicators of job flows, we can conclude that transitional economies suffer from insufficient job creation. A small number of new productive jobs, created annually, is one of the main reasons of high unemployment rates in most of the transition economies.
9
We are grateful to the National Employment Service of Serbia for providing a firm-level micro data set of the Employer survey.
The rates of job creation and destruction for Serbia that are corrected by job flows in micro firms (enterprises and shops) are changed to some extent, but they do not show any further diversity between jobs created and destroyed. Those two rates are almost identical, showing small but positive net employment gains (the net employment rate is probably upward biased, due to underestimated job destruction rates, as we already explained above).
Table 6: Job creation, job destruction and excess job reallocation for selected countries, in %
Country JCR JDR NER JTR EJR
Bulgaria, 2000 6.8 10.8 -4.1 17.6 13.5 Croatia, 2001 3.5 4.9 -1.4 8.4 7.0 Estonia, 1997 9.3 8.8 0.5 18.1 17.6 FYR Macedonia, 1999 2.4 4.9 -2.5 7.3 4.9 Poland, 1999 5.3 10.1 -4.8 15.4 10.4 Russia, 1999 3.4 8.0 -5.4 11.4 6.0 U.S., 2009 12.2 16.4 -4.0 28.8 24.8 Serbia, 2010 5.8 5.1 0.7 10.9 10.2 Serbia, 2010¹ 7.6 7.2 0.4 14.8 14.4
Abbreviations: JCR-Job creation rate, JDR-Job destruction rate, NER-Net employment rate, JTR-Job turnover rate, EJR-Excess job reallocation rate.
Notes: Firm start-ups and closures are not involved. The estimated rates correspond to continuing establishments. ¹ Estimates for Serbia corrected by the employment dynamics in shops and micro enterprises.
Source: Micevska (2008) for Bulgaria, Croatia, Estonia, FRY Macedonia and Russia; Rutkowski (2002) for Poland; Haltiwanger (2011) for the U.S.; Authors’ own calculations for Serbia.
The upper panel of Table 7 contains job creation, job destruction and excess job reallocation rates throughout sectors of economic activities. There are only few economic activities for which excess job reallocations are result of higher job creation rates in comparison to job destruction rates. Economic sectors that absorb more new jobs placed in expanding enterprises are Manufacturing, Wholesale and retail trade, repair of motor vehicles and motorcycles and Administrative and support service activities. On the other side, sectors that contribute more to reallocation of jobs by destroyed jobs in contracting firms are Agriculture, forestry and fishing, Construction, Accommodation and food service activities and Professional, scientific and technical activities. The highest reallocation of jobs is characteristic of service activities, while the lowest reallocation of jobs occurred in energy-supply sectors and mining, real estate, financial services, transportation, information and communication and communal service activities.
Table 7: Job creation, job destruction and excess job reallocation by sector of economic activity and firm size, 2010, in %
JCR JDR NER JTR EJR
Economic activity
Agriculture, forestry and fishing 5.9 7.5 -1.6 13.3 11.7
Mining and quarrying 3.5 1.9 1.6 5.4 7.0
Manufacturing 6.4 5.7 0.7 12.1 12.8
Electricity, gas, steam and air condition supply 0.6 1.0 -0.5 1.6 1.1
Water supply, sewerage, waste management and
remediation activities 4.1 3.0 1.2 7.1 8.2
Construction 7.9 8.7 -0.8 16.6 15.8
Wholesale and retail trade, repair of motor
vehicles and motorcycles 6.4 6.0 0.4 12.3 12.8
Transportation and storage 3.1 2.2 1.0 5.3 6.3
Accommodation and food service activities 7.2 8.3 -1.2 15.5 14.3
Information and communication 3.9 5.5 -1.5 9.4 7.8
Financial and insurance activities 2.5 1.1 1.4 3.6 5.0
Real estate activities 1.9 0.4 1.5 2.2 3.7
Professional, scientific and technical activities 8.1 9.1 -1.0 17.2 16.2
Administrative and support service activities 12.4 3.0 9.4 15.3 24.8
Other activities 4.2 3.8 0.4 8.1 8.5 Size of enterprises 10-49 7.3 12.3 -5.0 19.6 14.6 50-99 7.6 6.7 0.9 14.3 15.2 100-249 7.4 5.2 2.2 12.6 14.7 250 and over 4.4 2.7 1.6 7.1 8.7
Notes: Economic activities such as O (Public administration, defence, social security), P (Education), Q (Human health and social work activities, the state sector), S (Other services), T (Households) and U (Exterritorial organizations) were exempt from the survey.
Source: Authors’ own calculations based on the survey data of the National Employment Service.
Small firms with 10-49 employees have destroyed more jobs than they have managed to create due to the crisis, so that the majority of jobs reallocation occurred due to separations from jobs in contracting firms (see the bottom panel of Table 7). The medium-sized enterprises of the first quartile and median and upper quartiles create almost the same proportion of jobs, but the latter destroy fewer jobs. It implies that the number of contracted firms diminishes as the firm size grows. The higher job reallocations are more often characteristic of small-sized and
the first quartile of medium-sized enterprises than the large-sized ones, showing that they are less resistant to be affected by the crisis that larger firms.
Job flows are faster in the private sector. The private sector creates 6.2% of new jobs per year, while the state sector creates several times fewer jobs (1.6%). Both sectors are net creators of new jobs, ranked between 0.7% and 0.3% for the former and the latter, respectively (Vasić et al.: 25) The state sector refers to public enterprises only, while state institutions, households and exterritorial organizations, as providers of service activities, are excluded from micro data.
MAIN FINDINGS AND CONCLUSIONS
There are at least three most important reasons for unfavourable pattern of the employment rate dynamics in Serbia. These are insufficient new job openings, structural unemployment contributed by skill mismatches and insufficient labour mobility, as well as quits without replacements. In this chapter we have contributed to some extent to the analysis of the first reason of the insufficient employment growth dynamics. Unfavourable labour market developments are characteristic of the Serbian labour market, not only due to the influence of the latest global economic crisis, but also because that has been persistent feature of the labour market since transition reforms started at the beginning of 2000s onwards. The analysis of economic transition in Serbia before the period of the economic crisis is out of scope of the analysis presented in this chapter.
It is well documented in academic papers for some other transition economies that the rates of job destruction are relatively high, while the rates of job creation are low, indicating negative net employment gains over the course of the transition (see Micevska 2008; Jurajda and Terell 2003; Rutkowski 2002). This implies that the gross job turnover rate – the sum of all jobs created and destroyed as a percentage of initial employment at a level of an economy or sector of economic activity – can be taken as a good approximation for the attained level of economic restructuring. In this chapter we have calculated the rates of job creation, job destruction and excess job reallocation for 2010, by using firm-level data collected by the representative sample of Serbian enterprises. Our results show that Serbian enterprises create and destroy almost the same proportion of jobs per year. It is obvious that the Serbian economy is not able to create more jobs, despite the fact that the firm-level data show the occurrence of some net employment gains. We have also estimated that the excess job reallocation rate, due to transient shocks caused by the economic crisis, is contributed to almost equally by created and destroyed jobs and that it accounts for around 14.4% of initial employment.
Furthermore, the coping strategy of the majority of enterprises over the course of the global economic crisis was to reduce employment rather than to close down a firm. The global economic crisis obviously broke down the employment growth in 2008, but dynamic of the total number of enterprises was not so affected by the crisis but rather slowdown. The economic crisis manifests differently depending on the size of enterprises. Micro and small-sized enterprises were more affected by the crisis, while medium-sized enterprises of median and upper quartiles as well as large-sized enterprises experienced less job destruction rates and to some extent recorded net employment gains.
However, certain caveats need to be underlined regarding the used micro set of firm-level data. The left tail of the firm distribution is truncated, because micro enterprises and owners of shops were excluded from data collection. Despite the fact that the private sector is well represented by enterprises of all other sizes, the state sector covers only public enterprises, while state institutions are excluded. The firm-level data provide figures on employment gains in expanding firms and employment losses in contracting firms, due to positive or negative turn in performing their activities, while the number of workers who quit jobs without replacement is not properly captured by the survey. All those caveats may have effect on rising bias of estimated rates of job creation and job destruction in the Serbian labour market.
References
[1] European Commission, 2009, Employment in Europe 2009. Luxembourg: Office for Official Publications of the European Communities.
[2] Business Registration Agency of Serbia, 2011, Business Informer for 2010.
Belgrade: December 2010.http://www.apr.gov.rs/Информаторораду.aspx [3] Haltiwanger, J. 2011, “Job Creation and Firm Dynamics in the United States” in:
J. Lerner and S. Stern (eds.) Innovation Policy and the Economy, Volume 12. The University of Chicago Press and NBER, pp. 17-38.
[4] Jurajda, Š., Terrell, K. 2003, “Job Growth in Early Transition: Comparing Two Paths”, Economic of Transition, vol. 11, no. 2, pp. 291-320.
[5] Lehmann, H., Philips, K., Wadsworth, J. 2005, “The Incidence and Cost of Job Loss in a Transition Economy: Displaced Workers in Estonia, 1989 to 1999”, JoCE, vol. 33, no. 1, pp. 59-87.
[6] Micevska, M. 2008, “The Labour Market in Macedonia: A Labour Demand Analysis”, Labour, vol. 22, no. 2, pp. 345–368.
[7] Министарство економије и регионалног развоја, Национална агенција за
регионални развој, 2011, Извештај о малим и средњим предузећима и
[8] Mortensen, D., Pissarides, C. 1994, “Job Creation and Job Destruction in the Theory of Unemployment”, The Review of Economic Studies, vol. 61, no. 3, pp. 397-416.
[9] OECD, 2010, Investment Reform Index 2010. Paris: OECD Pub.
[10] OECD Reviews of Labour Market and Social Policies, 2008, Serbia: A Labour
Market in Transition. Paris: OECD Pub.
[11] Ognjenović, K., Branković, A. 2010a, “Comparative Analysis of the Institutional Support to SMEs in Serbia: Strengthening the Sector during the Crisis” in: J. Grabara, B. Skowron-Grabowska, H. Hanić and D. Erić (eds.) Global Crisis in the Central-Eastern European Region: Influence on Financial Systems and Small and Medium-Sized Enterprises. Czestochowa: Czestochowa University of Technology in collaboration with Belgrade Banking Academy and Institute of Economic Sciences Belgrade, pp. 261-274.
[12] Ognjenović, K., Branković, A. 2010b, “Factors with Significant Impact on Individual Employment Plans of Enterprises: A Short-Term Assessment Based on Data of the Serbian Economy” in: V. Šoltés, H. Hanić and D. Erić (eds.) Influence of Global Economic Crisis on CEE Region – Possible Way Out. Košice: Technical University of Košice in collaboration with Belgrade Banking Academy and Institute of Economic Sciences Belgrade, pp. 120-128.
[13] Rutkowski, J.J. 2002, “Job Creation and Job Destruction in Poland (1993-1999)”,
the 22nd NBP Conference “Monetary Policy in the Environment of Structural
Changes”.http://www.nbp.pl/konferencje/falenty2002/pdf_en/rutkowski.pdf [14] Rutkowski, J.J., Scarpetta, S. 2005, Enhancing Job Opportunities: Eastern Europe
and the Former Soviet Union. Washington D.C.: The World Bank.
[15] Statistical Bureau of Serbia, Bulletin on the Labour Force Survey, various issues. [16] Statistical Bureau of Serbia, 2012, “Quarterly GDP in the Republic of Serbia – 1st
Quarter 2012”, Statistical Release NR 40, no. 180 of 29.06.2012. [17] Statistical Bureau of Serbia, 2011, Statistical Yearbook 2011. Belgrade.
[18] Stošić, I., Redžepagić, S., Brnjas, Z. 2012, “Privatization, Restructuring and
Employment: The Case of Serbia” in: J. Zubović and I. Domazet (eds.) New
Challenges in Changing Labour Markets. Belgrade: Institute of Economic
Sciences,pp.355-372.http://www.rrpp-westernbalkans.net/en/library/Research-Results.html
[19] Vasić, V., Tancioni, M., Ognjenović, K. 2011, Labour Market Analysis and
Forecasting Labour Market Needs in the Republic of Serbia. Belgrade: Technical Assistance to Enhance the Data Management, Forecasting and Monitoring and Evaluation Capacity of the National Employment Service.http://www.eunes-project.eu/documents/C1_engleski_final.pdf
[20] Vujčić, B. 1998, “Structural Changes in Employment in Croatia”, Zagreb International Review of Economics and Business, vol. 1, no. 2, pp. 107-125. [21] World Bank, 2011a, “Employment Protection Legislation, and Labor Market
World Bank. http://www-wds.worldbank.org/external/default/WDSContentServer/WDSP/IB/2012/06/21 /000386194_20120621020147/Rendered/PDF/702260PNT0P1230a0Policy0Not es0Labor.pdf
[22] World Bank, 2011b, Doing Business 2012. Washington D.C.: The World Bank. [23] World Bank, 2008, Doing Business 2009. Washington D.C.: The World Bank.