Flood Risk Management
Page | 2
Table of Contents
1. Background ... 3
1.1 European Experiences as a Pioneer in Flood Risk Management ... 3
1.2 What is flood risk management? ... 4
1.3 Strategies in Managing Flood Risk ... 5
1.4 Difference between Flood Map and Flood Risk Map? ... 7
2. Methodology for Risk Assessment and Reduction ... 8
2.1 Quantifying Flood Risk – Annual Average Damages (AAD) ... 8
2.2 Deciding where to invest - flood risk management benefits ... 9
2.3 Flood Damage evaluation ... 10
2.3.1 Necessary Information for flood damage evaluation ... 10
2.3.2 Damage evaluation methods in Europe... 11
2.3.3 Different types of flood damages ... 13
2.3.4 Basic implementation steps of direct, tangible damage evaluation ... 14
3. Problems in current practice of flood risk management ... 16
4. Flood risk management examples ... 18
4.1 Investment Scenario Modeling (Excerpted from Environment Agency Wales, 2010) ... 18
4.1.1 Investment scenario modeling ... 18
4.1.2 Modeling risk and uncertainty ... 19
4.1.3 Summary for flood risk of different investment scenarios: results from scenario modeling .... 19
4.2 GIS-based multicriteria evaluation of flood damage and risk (Excerpted from Meyer, 2009) ... 21
4.2.1 A methodological framework ... 21
4.2.2 Problem Definition ... 22
4.2.3 Evaluation Criteria ... 22
4.2.4 Alternatives (Spatial Units) ... 23
4.2.5 Criteria Evaluation: Risk Maps ... 23
4.2.6 Criteria Weights ... 27
4.2.7 Decision Rules ... 28
4.2.8 Results and Sensitivity ... 29
Page | 3 1. Background
1.1European Experiences as a Pioneer in Flood Risk Management
Between 1998 and 2004, Europe suffered over 100 major damaging floods, including the catastrophic floods along the Danube and Elbe rivers in summer 2002. Severe floods in 2005 further reinforced the need for concerted action. Since 1998 floods in Europe have caused some 700 deaths, the displacement of about half a million people and at least €25 billion in insured economic losses.
In 2000, the Water Framework Directive (more formally the Directive 2000/60/EC of the European Parliament and of the Council of 23 October 2000 establishing a framework for Community action in the field of water policy) was initiated as a European Union directive which commits European Union member states to achieve good qualitative and quantitative status of all water bodies (including marine waters up to kilometer from shore) by 2015. It is a framework in the sense that it prescribes steps to reach the common goal rather than adopting the more traditional limit value approach (Wikepedia, 2010).
In addition, the Directive 2007/60/EC was proposed by the European Commission on 18/01/2006, and was finally published in the Official Journal on 6 November 2007. Its aim is to reduce and manage the risks that floods pose to human health, the environment, cultural heritage and economic activity. The Directive requires Member States to first carry out a preliminary assessment by 2011 to identify the river basins and associated coastal areas at risk of flooding. For such zones they would then need to draw up flood risk maps by 2013 and establish flood risk management plans focused on prevention, protection and preparedness by 2015. The Directive applies to inland waters as well as all coastal waters across the whole territory of the EU (European Commission Environment, 2010).
In April 2007, the Parliament and Council of the European Union agreed the wording on a new European Directive on the assessment and management of flood risks. The Integrated Project FLOODsite is listed as one of the European actions which support the Directive. FLOODsite is active in stimulating the uptake of research advances through guidance for professionals, public information and educational material. FLOODsite is an “Integrated Project” in the Global
Page | 4 Change and Ecosystems priority of the Sixth Framework Programme of the European Commission. It commenced in 2004 and runs to 2009. The FLOODsite consortium includes 37 of Europe‟s leading institutes and universities and the project involves managers, researchers and practitioners from a range of government, commercial and research organizations, specializing in aspects of flood risk management (PEGASO, 2008). Most of the valuable information herein is attributed to the projects and papers which FLOODsite researches are involved.
1.2What is flood risk management?
Flood events are part of nature. It is neither technically feasible nor economically affordable to prevent all properties from flooding. Then, what could be the best strategy to minimize the harm from the flood? In recent years, a paradigm shift on flood policy is recognized from the old concept of “flood protection” to “flood risk management” (Schanze 2006). “Flood protection”
aims at preventing flood hazards up to a certain magnitude by providing a certain protection level (e.g. against floods of an exceedance probability once in 100 years). Such protection levels are mostly established by means of flood defense structures such as dikes, dunes, etc. Hereby we need to clearly define the concept of “flood risk” for comparison. The term flood risk is the product of the likelihood or chance of flooding, multiplied by the consequences or impacts of flooding (See e.g. Knight 1921, Gouldby & Samuels 2005, Environment Agency Wales 2010), i.e.,
Flood risk = likelihood (chance) of flooding × the consequences (impacts) of flooding => Annual Average Damage (AAD)
In other words, this is the expected annual average negative consequence of flooding (Annual Average Damage (AAD)), whereas negative “consequences” covers economic, social as well as
environmental consequences (Meyer, 2007). It tries to adjust flood protection to the risk situation by concentrating protection efforts to areas with a high expected damage, in order to spend public funds in an economically efficient way (Messner & Meyer, 2006). Therefore a risk-based approach is to achieve the best management results possible using the budget and resources available.
In more detail, the likelihood (or chance) of flooding occurring in any one year can be expressed as a probability or an annual chance; for example, a 1% annual probability of flooding or 1 in
Page | 5 100 chance of flooding at a location in any year, while the consequences (or impacts) of flooding can have serious effects not only on people and property, but also on essential services, infrastructure and the environment. The Pitt Review (Pitt, 2008) into the 2007 floods in UK highlighted the significance of the impacts of flooding on health. This included the stress caused by being flooded; the loss of irreplaceable personal items; the length of time before people can return to their homes; and the huge cost to people if they are inadequately insured.
Flood risk management can be broadly divided in two steps (Schanze 2006): flood risk assessment and flood risk reduction. Flood risk analysis and assessment are often called as a
flood risk assessment without separation. While the objective of flood risk assessment is to provide information on current or future flood risks in order to find out where these risk are unacceptably high, risk reduction aims at finding measures to decrease these risks. The Figure 1 below shows the schematic diagram of flood risk management. It is important to note that hazard determination is the step associated with the determination of likelihood of flooding and inundation characteristics, and therefore assessing and mapping flood risk map is the necessary step at this stage. This will further be discussed at Section 2.3, „damage evaluation –necessary information for flood damage evaluation‟.
Figure 1. A diagram of flood risk management scheme (Modified from Schanze (2006))
1.3Strategies in Managing Flood Risk
A risk management approach requires a mix of actions to manage both the likelihood and consequences of flooding. The historic approach has mainly focused on defenses and managing the likelihood of flooding. Going forward the balance of investment needs to be considered and
Page | 6 even more focus given to actions to manage the consequences as well. For example, the removal of existing properties from flood risk areas, directing new development away from flood risk areas or the construction of flood defenses all reduce the likelihood of flooding. Actions to raise flood awareness, to provide timely flood warnings, or to make individual properties more resilient to flooding, reduce the consequences of flooding (Environment Agency Wales, 2010). The followings below show the details.
Some of the wider range of actions that could help to manage the consequences of flooding
include:
increased coverage and improved flood warning;
increased awareness to enable property owners to take action before flooding occurs to reduce their damages;
increased awareness amongst the owners of essential services and infrastructure to enable them to plan for and manage their flood risk;
increased resistance of new and existing property to flooding, for example installing flood gates or covers for air-brick vents;
increased resilience of new and existing property to flooding, for example, raising electrical sockets, using lime-free plaster and tiled or stone surfaces and floors to reduce the time after flooding before the property is habitable or usable.
The wider range of actions could also include changes in land use or land management to reduce the likelihood of flooding.
restoring currently defended floodplains to increase the capacity for storage of flood flows and to reduce the flood risk downstream;
removing artificial land drainage and restoring more natural and slower rates of surface run-off;
using tree planting and shelter belts to reduce surface run-off;
encouraging and supporting good soil management – reducing soil compaction and therefore surface water run-off;
Page | 7 The most appropriate balance of flood risk management actions will vary between locations and communities. Choices will need to be made about how and where investment in managing flood risk is best directed. The Section 2.2 below briefly presents an example showing the determination of where to invest. Communities and those directly affected should be involved in this debate.
1.4Difference between Flood Map and Flood Risk Map?
To prevent confusion, we need to clarify at this point the difference between flood map and flood risk map. They both involve modeling the behavior of the sea and river basins in different weather and tidal conditions, and matching this to knowledge of land topography to see where floods are likely to arise and how often. However, these two mapping approach can be differentiated as followings (Environment Agency Wales, 2010):
• The Flood Map is for use by property owners and Local Authorities and shows where floods may occur and how severe they could be. It is a map of the natural floodplain showing areas that could flood if no defense structures were in place. It helps property owners recognize risks and prepare for floods.
• The Flood Risk Map differs from the flood map because it considers the impact of flood defense structures and other measures that reduce risk. Its purpose is contribute to flood risk management policy and investment priorities for government, and to help insurance industry in setting risk-based premiums and excesses as well as to people for raising awareness and preparedness on individual flood risk.
Page | 8 2. Methodology for Risk Assessment and Reduction
2.1Quantifying Flood Risk – Annual Average Damages (AAD)
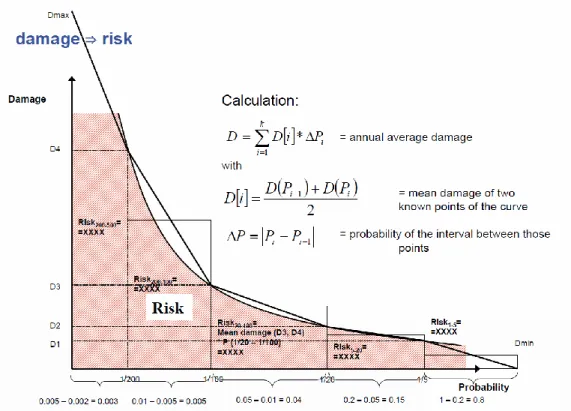
Flood risk is generally quantified in monetary terms as Annual Average Damages (AAD). This has units of „money/year‟ and is a function of both the likelihood and consequences of flooding. Annual Average Damages take account of a wide range of floods, from the relatively frequent, to rare and more severe incidents. Rare incidents have a low likelihood but may have high consequences and may therefore be a significant risk. The full cost of flooding from all sources is, however, significantly higher. This is partly due to neglecting the wider impacts on society and business, such as loss of essential services, transport delays, disruption to businesses and impacts on agriculture and the environment which are not included in the general calculation of AAD. From the risk assessment perspective, the negative consequences have to be evaluated for flood events of different probability in order to construct a damage-probability curve (see Figure 2). The risk (or AAD) is shown by the area or the integral under the curve (see Figure 3).
a) b)
Page | 9 Figure 2. Damage-probability curve: a) and b) procedure of flood risk calculation; c) and d) evaluation of measures by cost-benefit analysis: risk reduction=benefit (adapted from Meyer,
2007)
Figure 3. Calculation of Annual Average Damage (AAD) (adapted from Meyer, 2007) The AAD can be calculated according to the formula presented in Figure 3. That is, the variable 𝐷 is calculated by summing up several small rectangles which are risk or AAD.
2.2Deciding where to invest - flood risk management benefits
(This chapter is excerpted from Environment Agency Wales, 2010)
The benefit from a flood risk management intervention is measured by the flood damages avoided. This can be quantified in monetary terms, and public money is invested to reduce flood damages. This investment is economically justified if the amount of „benefit‟ (or damages avoided, calculated from the AAD) exceeds the amount invested (or the „cost‟).
Page | 10 if £0.6 million is spent on flood defenses to reduce the likelihood of flooding to a group
of properties, and the total flood damages avoided (benefit) over the life of these defenses is, say, £1 million, then;
the net benefit of this investment (benefits – costs) is £1m - £0.6m = £0.4m, and;
the benefit cost ratio for this investment (benefits/cost) is £1m/ £0.6m = 1.7
•the positive net benefit and a benefit cost ratio greater than 1 demonstrate this is an economically justified investment.
Alternatively the £0.6m from the earlier example, could be invested in actions to manage the consequences of flooding, rather than the likelihood. This could involve works to the properties, to either prevent flood water entering, or to enable the properties to be habitable more quickly after flooding occurs, such as raising the electrical sockets above flood levels and the use of tiled or stone surfaces which are less susceptible to flood damage and quicker to clean up after a flood. The £0.6m could be used to provide timely flood warnings. These reduce the risk to life and property by giving people and the emergency services advance warning, thereby enabling them to take action to reduce the consequences of flooding. Provided the benefits of these actions exceed the costs, these would be economically justified investments.
If the £0.6m could be used to purchase the properties at flood risk and relocate the residents to equivalent properties outside of the flood risk area, this could also be an economically justified investment option. This option would remove the flood risk completely.
2.3 Flood Damage evaluation
2.3.1 Necessary Information for flood damage evaluation
Damage evaluation approaches usually deploy the following kind of input data in order to estimate flood damage (Messner et al. 2007):
Inundation characteristics, i.e. data especially on the estimated area and depth of a certain flood event, calculated by hydrodynamic models.
Information on number and type of the exposed elements at risk (people, properties, biotopes etc.), usually gathered from land use data sources.
Information about the value of these elements at risk (either in monetary or non-monetary terms).
Information about the susceptibility of these elements at risk, usually expressed by depth/damage-relationships (Depth/damage functions).
Page | 11 Figure 4. Damage evaluation – necessary information (Adapted from Meyer, 2007)
Apart from these general components, a huge variety of damage evaluation approaches exist. Regarding their spatial scale and accuracy level, the existing methods can be broadly differentiated into macro-, meso- and micro-scale approaches. Macro scale approaches e.g. often rely on land use information with a low spatial resolution and/or low typological differentiation in order to reduce the effort of analysis and hence be able to consider large river basins as a whole (see e.g. IKSR 2001, Sayers et al. 2002). Micro-scale approaches on the other side try to achieve more accurate results by applying very detailed land use data, as well as value and susceptibility information (see e.g. Penning-Rowsell et al. 2003). Of course this requires more effort which restricts these approaches often to small research areas.
2.3.2 Damage evaluation methods in Europe
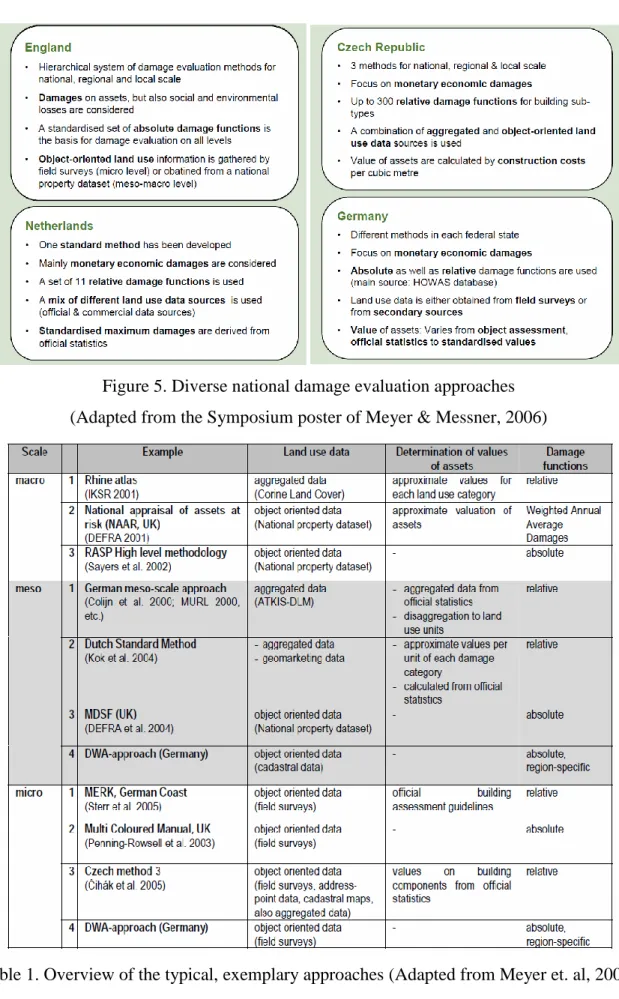
Even though Damage evaluation methods all have similar data requirements as described in Figure 4, a great variety of methods exists in practice. In this sub-chapter, existing damage evaluation approaches applied in England, the Netherlands, the Czech Republic and Germany were analyzed. The objective of the study was to describe different methods, to compare the different approaches but also to unveil deficits in current practice (Meyer & Messner, 2006).
Page | 12 Figure 5. Diverse national damage evaluation approaches
(Adapted from the Symposium poster of Meyer & Messner, 2006)
Page | 13 Figure 5 above shows very similar characteristics among countries, but they are slightly different with respect to the detail methods and sources they are using. In addition, Table 1 above presents different kinds of method which are currently being used in European countries depending on different spatial scales.
The main common deficits found in four European countries‟ approaches are as follows:
Social and environmental effects of floods are rarely considered.
Uncertainties in the results are usually not documented.
Sometimes full replacement costs are used to estimate flood damages, not depreciated values (overestimation of flood damages).
Lack in transboundary co-operation: different approaches in one river basin. These common problems will be more discussed in Section 3.
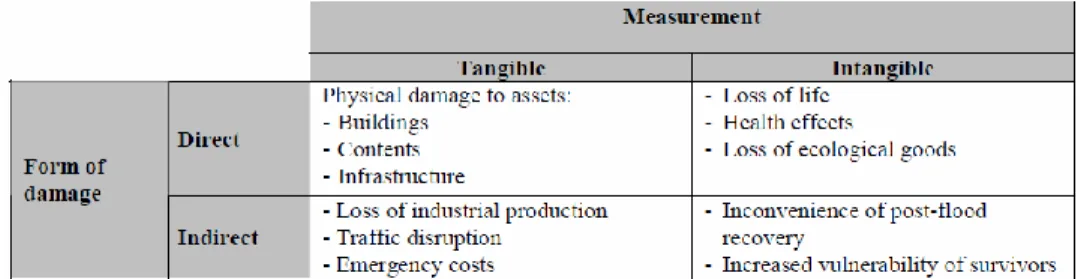
2.3.3 Different types of flood damages
Different types of flood damages can be classified as presented in Table 2. As stated earlier in Section 1.2, damages can be classified as economic, social, and environmental damages. Economic damages such as buildings, contents, etc which is tangible and direct can be easily estimated using AAD concepts described in Section 2.1, however; social and environmental damages are usually considered as tangible indirect, intangible direct, or intangible indirect damages and they are not easy to estimate. The detailed methods for these three damage categories have been reviewed and reported in Floodsite project report: T09-07-03 by Meyer et.al, 2009. For the simplification, this paper will only present basic implementation steps of direct and tangible damage evaluation in the next Section, however; recently developed alternative method, called multicriteria analysis (MCA) will be introduced instead. The MCA method is an appropriate method of incorporating all relevant types of consequences without measuring them on one monetary scale.
Page | 14
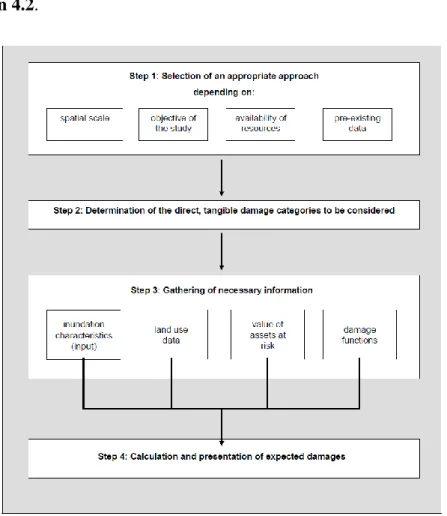
2.3.4 Basic implementation steps of direct, tangible damage evaluation
Figure 6 briefly shows the schematic diagram of direct, tangible damage evaluation, and the below of this figure explains a little bit details of these procedures.
Once we finished the calculation of the expected damages at the step4, then that means we are now ready to proceed to the next stage, which is risk reduction strategies. It is very important to note this. For example, we have to compare the current risks based on each flooding scenarios with several alternatives when we plan to build new structural or non-structural measures to reduce flood risk. Therefore, damage evaluation steps described below are purely to present the risks on each flooding scenario. In order to build an appropriate flood risk reduction plan, one always should be done by means of cost-benefit analysis. The investment scenario modeling
based on cost-benefit analysis will be introduced as an example in Section 4.1, and alternative method, MCA to account for all kinds of flood consequences as mentioned above will be presented in Section 4.2.
Page | 15
Step1: For the choice of an appropriate method of damage evaluation the following questions are crucial:
Spatial scale: Which spatial level is planned to be considered? Is it of local, regional, national or even international scale?
Objective: What is the objective of the study? Are detailed results required or are approximate results sufficient to achieve this objective?
Availability of resources: How much time and money is at hand to carry out the study? Is there a considerably high, average or low amount of resources?
Pre-existing data: Is there already data at hand which is necessary for damage evaluation? Of which type is that data?
Step2: is to choose which kind of direct, tangible damages should be included in the analysis (see Section 2.3.3).
Step3: is to gather the necessary information for flood damage evaluation: inundation characteristics, land use data, information on the value of elements at risk and depth/damage functions (see Section 2.3.1)
Step4: For the calculation of damages the information gathered in step 3 has to be related to each other. By adding up the estimated damages to each land use unit the total damage of each flooding scenario can be calculated. Especially for meso- and micro-scale studies or when the objective of the study requires spatially differentiated results (identification of hot-spots, evacuation planning) we recommend not only calculating total damage amounts but also carrying out damage mapping by means of a GIS. Even the most detailed approaches of flood damage evaluation are still characterized by uncertainties in their results. To provide good decision support, these uncertainties should be documented, e.g., by minimum and maximum damage amounts or by confidence intervals.
Page | 16 3. Problems in current practice of flood risk management
Currently, the evaluation of alternative measures is mostly done by means of cost-benefit analysis (CBA). In this case, the costs of a certain measure are compared with their benefits in terms of risk reduction. In theory, this procedure leads to an efficient allocation of funds and finally to an optimized protection against flooding. For both parts, risk assessment and the evaluation of risk mitigation measures (CBA), it is required to quantify flood risk as exactly as possible. In this context, three deficits in today‟s practice of flood risk management can be identified (Meyer, 2009):
a. The current practice of flood risk assessment and cost-benefit analysis still focuses on economic damages, especially damages on buildings and their inventories. In contrast,
social and environmental effects of flooding, like e.g. loss of life, stress or destruction of biotopes, are often not considered. This is partly because they are not, or at least not easily measurable in monetary terms and hence not comparable with economic damages. In consequence, flood risk management often manages only certain parts of flood risk. On that basis, an optimized allocation and design of flood mitigation measures cannot be ensured
b. The spatial distribution of risks as well as of the benefits of flood mitigation measures is rarely considered. That is, the evaluation and selection of appropriate mitigation measures is mostly based on their overall net benefit. Therefore, it is often not considered which areas benefit most from a measure and which areas do not. This may lead to
spatial disparities of flood risk which are not desirable or acceptable.
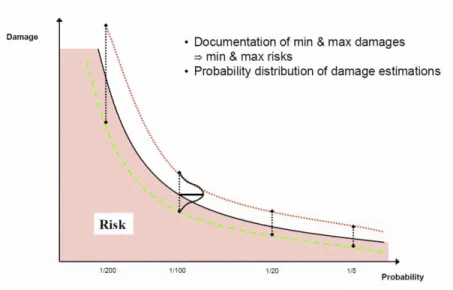
c. Uncertainties in the results of risk assessment are often ignored. Although sophisticated methods in all parts of risk analysis and assessment have been elaborated over the past decades in order to give a reasonably exact estimation of flood risk, the results of risk assessment are still to some degree uncertain or imprecise. These uncertainties are often not communicated to the decision makers, i.e. a non-existent precision of estimation is pretended. This might facilitate the decision for the decision
Page | 17 maker but reduces the scope of decision and could lead to a solution which is not optimal. Figure 7 below shows a graphical representation of uncertainties in risk assessment.
Figure 7. Uncertainties in risk assessment
In this context, multicriteria analysis (MCA) is recently developed as an appropriate method of incorporating all relevant types of consequences without measuring them on one monetary scale by Meyer, 2009. It provides an alternative to the complex monetary evaluation and internalization of intangible consequences in a cost-benefit analysis as emphasized in Section 2.3.3.
Page | 18 4. Flood risk management examples
4.1Investment Scenario Modeling (Excerpted from Environment Agency Wales, 2010)
This example uses financial modeling to consider the current levels of investment in building and maintaining river and coastal flood defenses, and the predicted impacts on flood risk of various changes in investment in the future.
4.1.1 Investment scenario modeling
Five different investment scenarios (see Box 1 below) have been used to examine a wide range of investment options. Scenarios 1 and 2 are financially constrained, whereas 3 to 5 are not limited by finances but by the requirements of the scenarios.
Over the next 25 years investment will be required to maintain the existing asset stock, construct new defenses and replace those defenses that reach the end of their design life. In addition,
climate change impacts will progressively reduce the level of protection provided by current defenses and will increase the requirements for maintenance investment. This is particularly the case around the coast, where defenses will be subjected to more frequent and violent storms and wave action. The five investment scenarios take into consideration these factors, and therefore they represent progressively increasing levels of investment.
Scenario 1 maintains the current total level of annual investment (public and private) of approximately £44m into the future and over the 25 year assessment period.
Page | 19 Scenario 2 also includes an additional £1m year-on-year increase. In this assessment it is
assumed that all this additional investment is directed to river and coastal flood defenses, rather than other flood risk management activities.
Scenario 3 considers the investment required to deliver the policies contained in the current published Catchment Flood Management Plans and Shoreline Management Plans. As above, this assessment assumes that these policies are delivered only by investment in flood defenses whereas the Catchment Flood Management Plans advocate a much wider range of actions to complement investment in defenses.
Scenario 4 targets the investment to locations of highest flood risk and where the benefits are at least equal to the costs. This represents an economically justified investment.
Scenario 5 is the same as scenario 4 except that further investment is required to maintain the current level of risk for all other properties regardless of cost. These locations may have costs which exceed the benefits. They are more difficult and therefore more costly to defend.
4.1.2 Modeling risk and uncertainty
Estimates of both risks and costs are based on assumptions and as with all modeling there are uncertainties that are reflected in the results. Future costs cannot be precisely known and are estimated to have a margin of error of plus or minus 25%. The margin of error for future numbers of properties at risk and the future damages is also at least plus or minus 25%. Hence, the results are not definitive or exact; they are indicative of the possible costs and flood risks.
4.1.3 Summary for flood risk of different investment scenarios: results from scenario modeling
Figure 8 shows the numbers of properties at significant and moderate flood likelihood in 2035, for each of the scenarios. According to the National Flood Risk Assessment (NaFRA) in UK classified the flood risks depending on the chance of flooding in any year at that location, i.e., Low(1 in 200 chance), Moderate (1 in 200 to 1 in 75), and Significant (1 in 75) (Environment Agency Wales, 2010). Figure 9 a) and b) show the „net benefits‟ (that is, benefit minus cost) and the „benefit‟ (that is flood damages avoided) of each investment scenario, respectively.
Page | 20 Figure 8. Investment scenarios: properties at significant and moderate likelihood of flooding in 2035.
a) b)
Figure 9. Investment scenarios: a) the net benefit of investment; b) the benefit of investment In summary the results of the scenario modeling show:
All scenarios are economically positive and justifiable investments in terms of the flood risk benefits gained.
For all scenarios there are significant net benefits of around £20 billion or greater and the benefit-cost ratios are all around three or greater, indicating a significant return on investment.
The net benefits of scenarios 1 and 2 are comparable. However the number of properties in the significant likelihood category increases substantially under both scenarios from the present day 65,000 to almost 100,000 in 2035.
The additional investment of scenario 2 does generate approximately £1 billion more benefit than scenario 1 over 100 years. However scenario 2 also costs approximately £1
Page | 21 billion more than scenario 1 over the same period. Therefore the net benefits are comparable.
Substantially increased and high levels of investment are needed to maintain the 2035 risk level, (considering significant and moderate likelihood) to around the current level. Scenario 3 is broadly comparable to the present day, and requires an annual spend of around £135m in 2035. This is around three times the current spend.
Even higher levels of investment are needed to reduce the numbers of properties in the significant and moderate likelihood categories. Scenario 4 indicates an annual spend of around £170m by 2035 would achieve this. This is around four times the current level of investment.
Scenario 5 has an estimated annual spend of £290m per year in 2035 – around seven times the current levels. However the number of properties in the significant and moderate likelihood categories are not substantially less than those for scenario 4. This is because scenario 5 also maintains current level of risk for all properties whereas scenario 4 does not. This means that under scenario 5 defenses are replaced to keep pace with climate change, and many of the benefits from scenario 5 are not realized until after year 25.
4.2GIS-based multicriteria evaluation of flood damage and risk (Excerpted from Meyer, 2009)
Geographical information systems (GIS) with their ability to handle spatial data are an appropriate tool for processing spatial data on flood risk. In our framework we therefore describe and test approaches which combine MCA with GIS. In addition, some possibilities of integrating the uncertainties in the results of risk analysis in this GIS-based MCA approach are presented in order to provide good decision support for the responsible decision makers.
Therefore, we firstly discuss and develop a methodological framework for spatial MCA for flood risk mapping and secondly apply and test our approach at the FLOODsite pilot site Mulde, a tributary to the Elbe River.
4.2.1 A methodological framework
Page | 22 1. Problem Definition 2. Evaluation Criteria 3. Alternatives 4. Criteria Evaluation 5. Criterion Weights 6. Decision Rules 7. Results & Sensitivity
In the following we will briefly explain the different steps and hereby describe the approach we applied at the Mulde pilot site. From Section 4.2.2 to 4.2.8, we will describe the details about this framework.
4.2.2 Problem Definition
At the beginning of any decision making process the problem needs to be recognized and defined. With regard to flood risk management the underlying problem can be structured into two parts:
Multicriteria risk assessment
First of all, the current magnitude and spatial distribution of flood risk needs to be identified in order to find out where further mitigation measures are necessary. This multicriteria assessment
of different areas is therefore an important prerequisite for multicriteria project appraisal below. Multicriteria project appraisal
After identifying high risk areas, the second part of the decision problem is to find the best strategies or measures to reduce flood risk to an appropriate level. These mitigation measures need to be evaluated in order to find the best alternative or combination of alternatives.
In this report we concentrate mainly on the multicriteria risk assessment and mapping.
Nevertheless, our approach can be also used as a basis for the evaluation of risk management measures. However, the problem is that a relatively high number of alternatives might restrict the MCA-approaches practicable.
4.2.3 Evaluation Criteria
The choice of an appropriate criteria is an iterative process where experts in the field of interest are firstly asked independently from each other to identify relevant criteria. These results are
Page | 23 then discussed together and the experts can revise their choice in a second round. This process is continued until a consensus is achieved about a common set of criteria. For our multicriteria assessment of flood risks at the Mulde River we apply the following risk criteria:
Economic: Annual Average Damage
Social: Annual average affected population and Probability of social hot spots (hospitals, schools etc.) being affected.
Environmental: Erosion potential (of material), Accumulation potential (of material), and Inundation of oligotrophic biotopes
4.2.4 Alternatives (Spatial Units)
This is the section to compare alternatives with those derived in Section 4.2.2 Multicriteria risk assessment and mapping
Multicriteria risk assessment does not really compare different actions or decision alternatives. It is an assessment of different areas regarding their risk status. Hence the alternatives to be compared in this case are different spatial units within the research area. Depending on the underlying spatial data, or the GIS-model chosen, these spatial units to be compared could be grid cells (raster GIS) or points, lines and polygons in a vector GIS.
Multicriteria project appraisal
The second multicriteria problem deals with the comparison and selection of alternative flood mitigation measures. I.e. the decision problem is to choose among a given set of flood risk management measures ranging from structural measures like dikes and dams to non-structural measures such as land use changes or warning systems.
4.2.5 Criteria Evaluation: Risk Maps
For each alternative or grid cell the performance of each criterion needs to be evaluated. Regarding GIS-based flood risk assessment, the result is a risk map for each criterion.
For the practical application of flood risk assessment this means that the negative consequences have to be evaluated for flood events of different probability. Based on these damage evaluations for different events a damage-probability curve can be constructed (see Figure 3 in Section 2.1). The risk (or the annual average damage) is shown by the area or the integral under the curve.
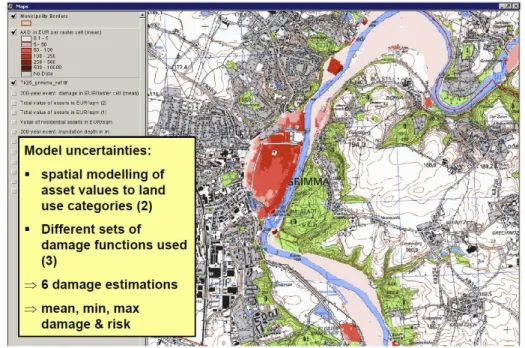
Page | 24 The basis for all our damage evaluations in the Mulde pilot site is inundation data for events of different exceedance probabilities calculated by a 1D-hydrodynamic modeling by HELMHOLTZ Center for Environmental Research(UFZ) (Schanze et al., 2008). For each of these events the inundation area and depth is mapped for a grid with a spatial resolution of a 10m (See Figure 10 below). Damage is calculated for each of these grid cells, so that a damage map for each of the events mentioned above is produced. By using the risk formula described in Section 1.2 above, the annual average damage per grid cell can be computed. All computations are carried out by the software tool FloodCalc (Scheuer & Meyer 2007). It allows the uploading of grid data of inundation depth, value of assets, inhabitants, environmental values and to combine them with different sets of depth/damage function and thereby producing damage and finally risk grids.
It is important to note that all methods chosen here to estimate the different risk criteria (inundation modeling as well as damage evaluation) are fairly approximate approaches. This means risk estimations of single raster cells may have high uncertainties.
Figure 10. Expected inundation depth for a 200-year flood event (City of Grimma)
For the economic risk criterion, flood damage for each of the events mentioned above is calculated by means of a meso-scale damage evaluation approach (Meyer 2005). The general procedure is the following:
Page | 25 The total value of assets at risk and its spatial distribution are estimated based on data
from official statistics (the net value of fixed assets for different economic sectors) which is then assigned to corresponding land use categories.
Relative depth/damage curves are then used to calculate the damaged share of the values, depending on inundation depth.
Methodological uncertainties in damage evaluation are shown by applying 1) different spatial modeling keys of asset value to land use categories and 2) different sets of depth/damage curves. An annual average damage per raster cell is calculated based on the different damage estimations for inundation events of different exceedance probabilities (1:10, 1:25, 1:50, 1:100, 1:200, 1:500). This is conducted for the mean as well as for the minimum and maximum damage estimations so that the final output is a mean, minimum and maximum annual average damage per grid cell, accordingly. The mean annual average damage is shown in Figure 11.
Figure 11. Annual Average Damages (AAD) (City of Grimma): mean estimation
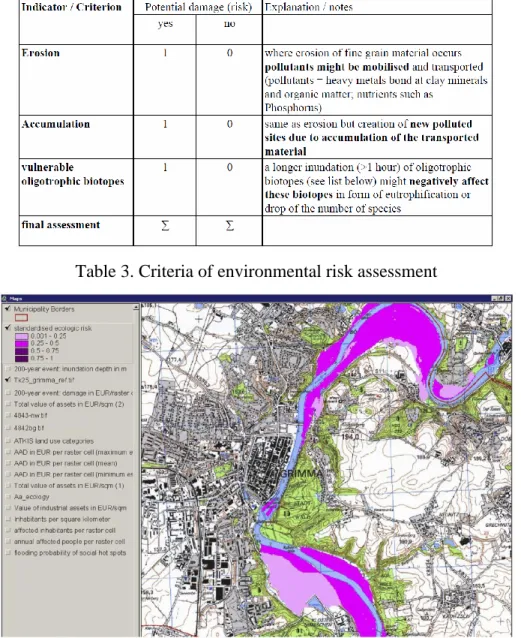
For the environmental risk criterion, a simple yes/no damage function as shown in Table 3 is applied for each three criterion, depending on if the area is affected or not, and then calculate the sum of the values given for each criterion to estimate a first environmental impact potential of a flood. Analogous to the calculation of economic damage, damage maps for environmental consequences can be produced for each flooding event. Each raster cell can hereby achieve “damage values” between 0-3. Based on these different damage maps an environmental risk map
Page | 26 is calculated by using the risk formula described in Section 1.2. This risk value can be interpreted as annual average environmental consequence. In Figure 12, these values are already standardized in values from 0 to 1.
Table 3. Criteria of environmental risk assessment
Figure 12. Environmental risk (City of Grimma): standardized values (0-1)
For the social criteria (affected population & social hot spots), the spatial distribution of the
affected population is calculated by a meso-scale approach more or less in the same way as the asset values (Meyer, 2005): Therefore, the number of inhabitants is taken from official statistics on municipality level and broken down to corresponding land use categories. By intersecting this population density map with the inundation data the number of affected people can be estimated
Page | 27 for each event. According to the risk formula, the number of the annual average affected population can be calculated (Figure 13). As “social hot spots” the locations of hospitals,
schools, old people‟s and children‟s homes are identified. By intersecting the map with the social hot spots with the inundation maps it can be determined for which inundation scenario the hot spots would be affected. By applying the risk formula an approximate estimation of the probability of being affected can be calculated for each hot spot (Figure 14).
Figure 13. Annual affected population (City of Grimma)
Figure 14. Social hot spots at risk and their probability of being flooded (City of Grimma)
Page | 28 Regarding a multicriteria flood risk assessment, the decision makers have to decide on the
relative importance of the different economic, social and environmental risk criteria. Our software tool provides the possibility to carry out the point allocation approach, a rating technique where 100 points have to be allocated among the criteria. The criterion ranked first is given 100 points and the following criteria receive points according to their relative importance to the preceding criterion.
4.2.7 Decision Rules
The decision rule aggregates the different criteria maps under consideration of the weights given to each criterion. It can be therefore considered as the core of MCA. Two different approaches are used: the Disjunctive approach and an MAUT approach (simple additive weighting) to be implemented in our software tool.
Disjunctive approach
The general idea of the Disjunctive approach is that the decision maker has to define a threshold level for each criterion. E.g. in order to select areas which have a high risk of flooding, the decision maker has to determine for each risk criterion a critical value which defines the border between low/acceptable risk and high/unacceptable risk. If this threshold value is exceeded in only one of the criteria the area is selected as a high risk area. This simple approach seems to be appropriate e.g. for a quick screening and pre-selection of high risk areas.
Multi attribute utility theory approaches (MAUT)
The general concept of additive MAUT approaches is to generate a weighted average of the single criterion values for each area (or alternative). The procedure for this is the following:
Standardize the criteria scores to values (or utilities) between 0 and 1.
Calculate the weighted values for each criterion by multiplying the standardized value with its weight.
Calculate the overall value (utility) for each alternative by summing the weighted values (utilities) of each criterion.
Rank the alternatives according to their aggregate value (utility). Figure 15 shows a MAUT approach applied.
Page | 29 Figure 15. Standardised multicriteria risk (City of Grimma)
: equal weighting of economic, social and environmental criteria
4.2.8 Results and Sensitivity
Uncertainty and sensitivity analysis can be done to investigate how the changes or errors in the inputs of the analysis might affect the results. These changes or errors can concern either the criterion values, i.e. uncertainties in risk assessment, or the weights given to the criteria.
As an uncertainty analysis, the economic criteria score uncertainty was considered by calculating a mean, minimum and maximum annual average damage, depending on the spatial modeling of asset values and the set of damage functions chosen. Furthermore, the sensitivity of the overall results to the weights given to the criteria also was investigated. For the simplification, the Figures associated with those analysis are not presented herein.
Page | 30 5. Recommendation and Future works needed
Summarizing the theses above, some recommendations can be given for the improvement of flood risk assessment in order to provide better support for flood risk management decisions:
In overall perspectives,
Flood risk assessment is always to some degree uncertain, but these uncertainties in the results should be documented in order to provide decision makers with information on the quality of the data they are using as a decision support.
Social and environmental flood risks should be also considered in an overall risk assessment e.g. by means of multicriteria analysis (MCA).
The spatial distribution of flood risks and risk reducing effects of mitigation measures should be shown by appropriate risk mapping approaches.
For the practical point of views for the IOWA Flood Center (IFC),
Based on the information above, we need to initiate the project for flood risk assessment and reduction management for the state of Iowa by deploying available methodologies
such as MCA or approaches listed in Table 1 in Section 2.3.2 and by testing available software.
Identified software for Flood Risk Management
Floodcalc (Scheuer & Meyer 2007) which is used for MCA in this paper. HR-Wallingford software (Flood risk 2008, Issue13)
RASP (System based risk model) to support different flood risk management decision levels (Also see Table 1 for the 3rd Macro Scale Approach).
RASP-NaFRA: allows a rapid assessment of the national risk picture, enabling decision makers to quickly indentify high risk areas as well as where resources should be focused.
RASP-strategic planning with the modeling and decision support framework 2 (MDSF2): Embed the RASP methods within the MDSF. Once complete, this will incorporate risk based methods and defense performance in the original MDSF(modeling and decision support framework)
RASP-Performance based asset management (PAMs)
RASP-Long-term planning
The details about the software should be investigated.
For the inundation modeling, Infoworks CS (2D urban flood modeling by HR-Wallingford), Delft3D (coastal waters and estuaries and rivers) and SOBEK (urban water
Page | 31 management) by Deltares can be alternatives compared to expensive MIKE by DHI Software.
Useful links for the flood risk management information
Environmental Agency - Flood update: www.environment-agency.gov.uk/flood
FRMRC (Flood Risk Management Research Consortium) -www.floodrisk.org.uk
Risk and uncertainty: FRMRC reviewed the different techniques available for uncertainty estimation for different types of flood risk management applications (see
www.floodrisknet.org.uk/methods)
Flood related papers and information – www.Floodsite.net, www.floodrisk2008.net
Investigation of extreme flood processes and uncertainty – www.impact-project.net Flood risk assessment and mapping –
http://www.hrwallingford.co.uk/index.aspx?activities=floods&topic=Flood risk assessment %26 mapping&facets=floods
HR Wallingford publication - http://eprints.hrwallingford.co.uk/
The future works needed for the establishment of solid framework for the flood risk management plan would be as Figure 16 below (FRMRC2- Paul Sayers, 2010).
Page | 32 REFERENCES
[1] EU DIRECTIVE 2000/60/EC OF THE EUROPEAN PARLIAMENT AND OF THE COUNCIL (2000), Establishing a framework for Community action in the field of water policy Available at
http://eur-lex.europa.eu/LexUriServ/site/en/oj/2000/l_327/l_32720001222en00010072.pdf. Accessed 28th November 2007.
[2] European Commission Environment (2010),
http://ec.europa.eu/environment/water/flood_risk/index.htm
[3] Environment Agency Wales(2010), Flooding in Wales: A National Assessment of Flood Risk
[4] Flood Risk (2008), Issue 13
[5] FRMRC2, Overview presentation on research undertaken in FRMRC phase 2 (2010),
http://www.floodrisk.org.uk/images/stories/Dissemination/FRMRC2_Extended_Overview_v2_p ublic.pdf
[6] Gouldby, B. and Samuels, P. (2005), Language of risk - project definitions. FLOODsite project report T32-04-01.
[7] IKSR (International Commision for the Protection of the Rhine) (2001), Übersichtskarten der Überschwemmungsgefährdung und der möglichen Vermögensschäden am Rhein. bschlußbericht: Vorgehensweise zur Ermittlung der hochwassergefährdeten Flächen, Vorgehensweise zur Ermittlung der möglichen Vermögensschäden.
[8] Knight F H. (1921), Risk, Uncertainty, and Profit. Boston
[9] Messner F, Meyer V, (2006), Flood damage, vulnerability and risk perception – challenges for flood damage research. In: Schanze, J.; Zeman, E.; Marsalek, J. (Eds.), 2006: Flood Risk Management - Hazards, Vulnerability and Mitigation Measures, 149-167. Springer.
[10] Messner F., Penning-rowsell E, Green C, Meyer V, Tunstall S, Van der veen A, (2007), Evaluating flood damages: guidance and recommendations on principles and methods. FLOODsite-Report T09-06-01, 176 pp.
[11] Meyer, V. (2005), Methoden der Sturmflut-Schadenspotenzialanalyse an der deutschen Nordseeküste, Vom Fachbereich Geowissenschaften und Geographie der Universität Hannover genehmigte Dissertation, UFZ Dissertation 3/2005
[12] Meyer V, Messner, F (2006), Methods and Deficits in flood damage evaluation , A comparison of four European countries, Poster presentation at the International Symposium of Integrated Water Resources Management in Bochum, Germany 2006.
[13] Meyer, V. (2007), GIS-based Multicriteria Analysis as Decision Support in Flood Risk Management. UFZ Discussion Papers 6/2007. Leipzig.
Page | 33 [14] Meyer, V (2009), Developing methodological foundations for GIS-based multicriteria evaluation of flood damage and risk, FLOODsite-Report T10-08-13
[15] Meyer V, Messner F, Penning-Rowsell E, Green C, Tunstall S, Van der Veen A (2009), Evaluating flood damages: guidance and recommendations on principles and methods. FLOODsite-Report T09-07-03, 7 pp.
[16] Munda, G. (1995), Multicriteria Evaluation in a Fuzzy Environment - Theory an Applications in Ecological Economics. Heidelberg, Physica Verlag.
[17] PEGASO (People for Ecosystem-based Governance in Assessing Sustainable Development of Ocean and Coast) (2008), http://pegasoproject.eu/wiki/FLOODsite
[18] Penning-Rowsell, E., Johnson, C., Tunstall, S., Tapsell, S., Morris, J., Chatterton, J., Coker, A. and Green, C. (2003), The benefits of flood and coastal defence: techniques and data for 2003. Enfield, Flood Hazard Research Centre.
[19] Sayers, P; Hall, J; Dawson, R; Rosu, C; Chatterton, J; Deakin, R (2002), Risk assessment of flood and coastal defences for strategic planning (RASP) – a High Level Methodology. DEFRA Conference for Coastal and River Engineers, September 2002.
[20] Pitt, M (2008). Learning Lessons from the 2007 Floods. Final Report. Cabinet Office, London. http://archive.cabinetoffice.gov.uk/pittreview/thepittreview/final_report.html
[21] Schanze J (2006), Flood risk management - a basic framework. In: Schanze, J.; Zeman, E.; Marsalek, J. (Eds.), 2006: Flood Risk Management - Hazards, Vulnerability and Mitigation Measures, 149-167. Springer.
[22] Schanze, J., Bernhofer, C., Caletkova, J., Gorner, C., Ferger, K-H., Franke, J., Haase, D, Hutter, G., Kodrova, Z., Kominkova, D., Lennartz, F., Luther, J., Meister, S., Meyer, V., Olfer, A., Rode, M., Scheuer, S,. Sequeira, M., Wahren, A., Weng, G., Zikmund, V. (2008), Floodsite Pilot Study “Elbe River Basin” – Executive Summary. Floodsite Report T21-08-01.
[23] Scheuer, S. & Meyer, V. (2007), FloodCalc. Software tool for the calculation of multicriteria flood damage and risk maps. Version 1.0 alpha.