Research Online
Research Online
Faculty of Business - Papers (Archive) Faculty of Business and Law 1-1-2017
Big data analytics and firm performance: effects of dynamic capabilities
Big data analytics and firm performance: effects of dynamic capabilities
Samuel Fosso Wamba
Toulouse Business School, [email protected] Angappa Gunasekaran
University of Massachusetts Shahriar Akter
University of Wollongong, [email protected] Steven Ji-Fan Ren
Shenzhen University Rameshwar Dubey
Constituent Of Symbiosis International University
See next page for additional authors
Follow this and additional works at: https://ro.uow.edu.au/buspapers Part of the Business Commons
Recommended Citation Recommended Citation
Fosso Wamba, Samuel; Gunasekaran, Angappa; Akter, Shahriar; Ren, Steven Ji-Fan; Dubey, Rameshwar; and Childe, Stephen J., "Big data analytics and firm performance: effects of dynamic capabilities" (2017). Faculty of Business - Papers (Archive). 977.
https://ro.uow.edu.au/buspapers/977
Research Online is the open access institutional repository for the University of Wollongong. For further information contact the UOW Library: [email protected]
Abstract Abstract
Drawing on the resource-based view and the literature on big data analytics (BDA), information system (IS) success and the business value of information technology (IT), this study proposes a big data
analytics capability (BDAC) model. The study extends the above research streams by examining the direct effects of BDAC on firm performance (FPER), as well as the mediating effects of process-oriented
dynamic capabilities (PODC) on the relationship between BDAC and FPER. To test our proposed research model, we used an online survey to collect data from 297 Chinese IT managers and business analysts with big data and business analytic experience. The findings confirm the value of the entanglement conceptualization of the hierarchical BDAC model, which has both direct and indirect impacts on FPER. The results also confirm the strong mediating role of PODC in improving insights and enhancing FPER. Finally, implications for practice and research are discussed.
Disciplines Disciplines Business
Publication Details Publication Details
Fosso Wamba, S., Gunasekaran, A., Akter, S., Ren, S. Ji-fan., Dubey, R. & Childe, S. J. (2017). Big data analytics and firm performance: effects of dynamic capabilities. Journal of Business Research, 70 356-365.
Authors Authors
Samuel Fosso Wamba, Angappa Gunasekaran, Shahriar Akter, Steven Ji-Fan Ren, Rameshwar Dubey, and Stephen J. Childe
Big Data Analytics and Firm Performance: Effects of Dynamic Capabilities
Samuel Fosso Wamba
NEOMA Business School, Rouen, France Angappa Gunasekaran
University of Massachusetts Dartmouth, USA Shahriar Akter
University of Wollongong, Australia Steven Ji-fan Ren
Harbin Institute of Technology Shenzhen Graduate School, China Rameshwar Dubey
Symbiosis International University, India Stephen J. Childe
Plymouth University, United Kingdom
Submission: January 2016 First Revision: March 2016 Second Revision: May 2016
Acceptance: June 2016
The authors extend their thanks to the Guest Editors of the Special Issue, Professor Love and Professor Irani, and to the anonymous reviewers. Send correspondence to Angappa Gunasekaran, Charlton College of Business, University of Massachusetts Dartmouth, North Dartmouth, MA 02747 2300, USA E-mail: [email protected]
Big Data Analytics and Firm Performance: Effects of Dynamic Capabilities
Abstract
Drawing on the resource-based view and the literature on big data analytics (BDA), information system (IS) success and the business value of information technology (IT), this study proposes a big data analytics capability (BDAC) model. The study extends the above research streams by examining the direct effects of BDAC on firm performance (FPER), as well as the mediating effects of process-oriented dynamic capabilities (PODC) on the relationship between BDAC and FPER. To test our proposed research model, we used an online survey to collect data from 297 Chinese IT managers and business analysts with big data and business analytic experience. The findings confirm the value of the entanglement conceptualization of the hierarchical BDAC model, which has both direct and indirect impacts on FPER. The results also confirm the strong mediating role of PODC in improving insights and enhancing FPER. Finally, implications for practice and research are discussed.
Keywords: Big Data Analytics, Big Data Analytics Capability, Business Values, Process-oriented Dynamic Capabilities, Firm Performance
1 INTRODUCTION
Big data analytics (BDA) is emerging as a hot topic among scholars and practitioners. BDA is defined as a holistic approach to managing, processing and analyzing the 5 V data-related dimensions (i.e., volume, variety, velocity, veracity and value) to create actionable ideas for delivering sustained value, measuring performance and establishing competitive advantages (Fosso Wamba et al., 2015). Some practitioners and scholars have gone so far as to suggest that BDA is the “fourth paradigm of science” (Strawn, 2012, p.34), a “new paradigm of knowledge assets” (Hagstrom, 2012, p. 2), or “the next frontier for innovation, competition, and productivity” (Manyika et al., 2011, p.1). All these assertions are primarily driven by the ubiquitous adoption and use of BDA-enabled tools, technologies and infrastructure including social media, mobile devices, automatic identification technologies enabling the internet of things, and cloud-enabled platforms for firms’ operations to achieve and sustain
competitive advantage. For example, BDA allows for improved data-driven decision making and innovative ways to organize, learn and innovate (Kiron, 2013, Yiu, 2012); thus, reinforcing customer relationship management, improving the management of operations risk, and enhancing operational efficiency and overall firm performance (Kiron, 2013).
Yet prior studies of the business value derived from information systems (IS) investments have reported mixed results, resulting in the so-called ‘IT productive paradox’. Indeed, some scholars have argued that IS investments do not necessarily lead to improved operational efficiency and effectiveness (Solow, 1987, Strassmann, 1990, Roach et al., 1987), while others identified a positive association between IS investments and firm performance (Brynjolfsson and Yang, 1996, Barua et al., 2004, Barua et al., 1995). Their findings suggest that the absence of a positive link between IS investment and firm performance found by prior studies may be explained by several factors including the unavailability of appropriate data, the existence of time lags between IS investments and the business value generated
from these investments, the absence of an assessment of the indirect benefits of IT, and the level of analysis of IS-related benefits (Brynjolfsson and Hitt, 2000, Devaraj and Kohli, 2003, Brynjolfsson and Yang, 1996, Anand et al., 2013). In fact, within this stream of research, eminent scholars argue that the impact of IT on firm performance may be mediated by a number of intermediate variables (Mooney et al., 1996, Anand et al., 2013). Furthermore, they propose applying a broader view of IT resources by integrating a multidimensional perspective into studies of the business value of IT or IT capabilities (Bharadwaj, 2000, Bhatt and Grover, 2005, Santhanam and Hartono, 2003). In this paper, we extend this stream of research by examining factors that contribute to improved firm performance as a result of BDA investments. More specifically, the study aims to examine the following research questions:
i. How are BDA capabilities measured and are their overall uses linked with firm performance? ii. Do process-oriented dynamic capabilities (PODC) play a mediating role in the relationship
between BDAC and FPER?
To address these research questions, this research draws on the emerging literature on BDA, IT capabilities as well as the resource-based view (RBV). The remainder of this paper is structured as follows: First, definitions of big data analytics are provided. This is followed by the presentation of selected studies on IT capabilities and big data analytics capabilities. Then, the research model and our research hypotheses are presented, followed by the research design. The subsequent sections present the data analysis and findings of the study, the discussion, and the conclusion and implications for research and practice.
2 BIG DATA ANALYTICS AS A NEW ENABLER OF COMPETITIVE ADVANTAGE
BDA is now considered as a game changer enabling improved business efficiency and
identified a positive relationship between the deployment of customer analytics and firm performance (Germann et al., 2014). For example, BDA allows firms to analyze and manage strategy through a data lens (Brands, 2014). Indeed, BDA is increasingly becoming a crucial component of decision-making processes in businesses (Hagel, 2015). BDA is now considered as “a major differentiator between high-performing and low-high-performing organizations,” as it allows firms become proactive and forward-looking, decreases customer acquisition costs by about 47% and enhances firm revenue by about 8% (Liu, 2014). The literature provides the example of Target Corporation, which uses BDA through its loyalty card program to track customers’ purchasing behaviors and predict their future buying trends. Amazon.com is another example of a firm that is capitalizing on BDA. Indeed, almost 35% of purchases made on Amazon.com are generated from personalized purchase recommendations to customers based on BDA (Wills, 2014). Another example discussed in the literature is GE, which is planning to use BDA to improve the efficiency of the 1,500 gas turbines it monitors by means of software and network
optimization, as well as to improve the dispatching of service and the coordination of gas and power systems. If realized, these benefits could lead to $66 billion in fuel savings over the next 15 years (Ward, 2014).
BDA is expected to have tremendous impacts within a variety of industries. For example, major retailing firms are presently leveraging big data capabilities to improve the customer experience, reduce fraud, and make just-in-time recommendations (Tweney, 2013). In the healthcare sector, BDA is
expected to reduce operational costs and improve the quality of life (Liu, 2014). In manufacturing and operations management, BDA is considered to be an enabler of asset and business process monitoring (Davenport et al., 2012b), supply chain visibility, enhanced manufacturing and industrial automation (Wilkins, 2013), and improved business transformation (Gardner, 2013).
3 IT CAPABILITIES AND BIG DATA ANALYTICS CAPABILITIES
Eminent scholars argue that it is important to take a broader view of IT to better capture the business value of IS investments and deal with the IT ‘productive paradox’ (Bharadwaj, 2000, Bhatt and Grover, 2005, Santhanam and Hartono, 2003). They suggest focusing on IT capability, which is defined as the “firm’s ability to mobilize and deploy IT-based resources in combination or co-present with other resources and capabilities” (Bharadwaj, 2000). Studies on IT capability have commonly used the RBV (Bharadwaj, 2000, Santhanam and Hartono, 2003), which originated from strategic management (Ryu and Lee, 2013, Zee and Jong, 1999). In this stream of research, studies argue that competitive advantage is achieved by deploying and using distinctive, valuable, and inimitable resources and capabilities (Bhatt and Grover, 2005). In fact, the concept of IT capability is based on the assumption that, while resources can easily be replicated, a distinctive set of capabilities mobilized by a firm is not easy to replicate and will lead to sustained competitive advantages (Santhanam and Hartono, 2003). Strategic management scholars argue that “investments into different IT assets are guided by firms’ strategies and deliver value along performance dimensions consistent with their strategic purpose” (p.763) (Aral and Weill, 2007). For this stream of research, IT capability will be used to achieve strategic integration by applying the capability for IT functionality to both shape and support business strategy (Zee and Jong, 1999). Moreover, any original capability will always lead to sustained competitive advantage through its path dependency, causal ambiguity, and social complexity (Porter and Millar, 1985). Consistent with prior studies (Davenport, 2006, Davenport and Harris, 2007, Goes, 2014, McAfee and Brynjolfsson, 2012b), we view BDAC as an important organizational capability leading to sustainable competitive advantage in the big data environment. The study also argues that original capability will always lead to sustained competitive advantage through its path dependency, causal ambiguity, and social complexity (Porter and Millar, 1985). Consistent with several earlier studies (Davenport, 2006, Davenport and Harris, 2007,
Goes, 2014, McAfee and Brynjolfsson, 2012b), in this study, we view BDAC as an important organizational capability leading to sustainable competitive advantage in the big data environment.
Many typologies of IT capabilities have been proposed. For example, Bhatt and Grover (2005) characterized IT capability through value, heterogeneity, and imperfect mobility. They argued that IT capability value and heterogeneity are “necessary conditions for competitive advantage,” while imperfect mobility is “necessary for sustained advantage” (p. 258). They further conceptualized three different types of capabilities: value capability (e.g., quality of IT infrastructure), competitive capability (e.g., quality of IT business expertise), and dynamic capability (e.g., intensity of organizational learning) in order to better understand the sources of IT-based competitive advantage. Using a sociomaterialistic perspective in conceptualizing a firm’s IT capability, Kim et al. (2012) considered IT capability to be a function of IT management capability, IT personnel capability and IT infrastructure capability. They argued that sociomaterialism-based modeling underscores complementarities among the three IT capabilities identified, as opposed to the dominant traditional approaches in IS, in which IT capability was characterized in terms of “unidirectional and unrelated conceptualization” (p. 329). The authors also tested and found a positive relationship between IT capability and firm performance (business process and financial). This result is consistent with prior studies that assessed the relationship between IT capability and related outcomes (e.g., firm performance, firm agility, stock market returns) (Lin, 2007, Gibb et al., 2011).
In a similar spirit to the IT capabilities literature, we conducted a review on big data analytics capabilities which presents us with three predominant dimensions, that is, management, infrastructure and personnel capabilities. For instance, McAfee and Brynjolfsson (2012b) put forward personnel management, technology infrastructure, and corporate decision making as critical capabilities across organizations in data economy. Similarly, Kiron, Prentice, & Ferguson (2014) identify organization
culture, analytics platform, and employees’ analytics skills as core dimensions of BDA . Furthermore, Davenport et al. (2012a) highlights that management, people and technology dimensions are interlinked in big data environment, which help each other to enhance broader firm performance . These dimensions of BDA and their relationships are supported by Barton and Court (2012) who point out that
management capability is important to optimize decision models; technology capability is essential to explore and manage variety of data; and finally, data science capability is important to understand, develop and apply analytics models.
4 RESEARCH MODEL AND RESEARCH HYPOTHESES
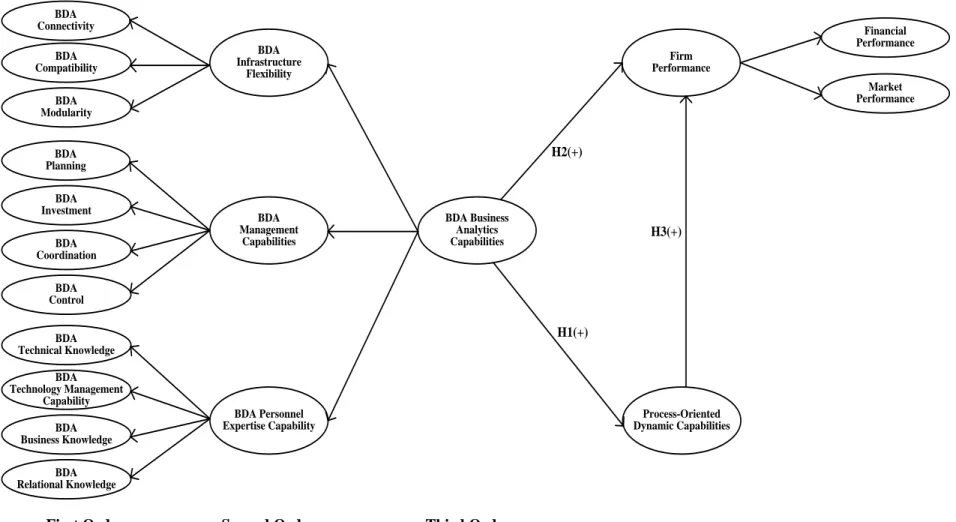
Drawing on the emerging literature on BDA capabilities and IT capabilities, this study proposes the research model shown in Figure 1 using RBV and sociomaterialism theory. Contrary to the literature on IT capabilities (e.g., Kim et al., 2011), this study proposes BDA capabilities as a third-order,
hierarchical model manifested in three second-order constructs – BDA infrastructure capability, management capability, and personnel capability – and eleven first-order constructs: BDA planning, investment, coordination, control, connectivity, compatibility, modularity, technical knowledge, technology management knowledge, business knowledge and relational knowledge (see Figure 1). The study also argues that BDA capabilities have a significant impact on PODC, which in turn influences FPER.
Drawing on the RBV (Grant, 1991), relational sociomaterialism (Orlikowski and Scott, 2008, Orlikowski, 2007, Kim et al., 2012), process-oriented dynamic capabilities, and the emerging literature on BDA (Barton and Court, 2012, McAfee and Brynjolfsson, 2012a, Davenport and Harris, 2007, Davenport et al., 2012a, Kiron et al., 2014), this study proposes an ‘entanglement’ view of BDAC that has multiple complementary dimensions that synergistically allow unique firm performance to be
2012) (Figure 1). Similar to (Kim et al., 2012), we argue that BDA infrastructure capability, personnel capability and management capability are the key components of a firm’s BDAC (see Table 1).
Table 1 here.
Prior studies have identified a positive link between IT capability and firm outcomes. For example, (Lu and Ramamurthy, 2011, p. 931), using a matched-pair field survey of business and information systems executives in 128 organizations, identified a significant positive relationship
between IT capability and two types of organizational agility: market capitalizing agility and operational adjustment agility. Similarly, on the basis of matched survey data collected from 214 Chinese IT and business executives from manufacturing firms,(Chen et al., 2014) found that IT capability has a positive effect on firm performance. They also found that dynamic capability of the business process mediates the relationship between IT capability and firm performance. Using a cross-sectional sample of 155 banking firms, (Lin, 2007, p. 93) showed that IT capability and human capital investment “contribute directly to the overall value-creation performance of banking firms”. (Kim et al., 2012) applied a relational sociomaterialistic conceptualization of IT capability and found a positive and significant relationship between IT capability and a firm’s performance. Based on this observation, our study suggests testing not only the direct effects of BDAC on FPER but also the mediating effects of PODC on the relationship between BDAC and FPER (Figure 1).
Therefore, we put forward the following hypotheses: H1: BDAC has a significant positive effect on PODC. H2: BDAC has a significant positive effect on FPER.
H3: BDAC has a significant positive indirect effect on FPER, which is mediated by a positive effect on PODC.
5 RESEARCH METHOD
The study is based on positivist research approach assuming that the world of phenomena has an objective reality which can be expressed in causal relationships and measured in data (Straub et al., 2004). Using the positivist approach, the study captured the objective and social reality by survey measures to identify the BDA capabilities in order to address the research questions. As part of this approach, we initially explored literature to identify the dimensions of BDA capabilities, their overall impact on firm performance and the mediating role PODC between BDAC and FPER. Based on RBV and sociomaterialism theory, we conceptualized the research model, developed the survey and validated the hypothesized relationships using partial least squares (PLS) based structural equation modelling (SEM).
5.1 Survey, Scaling and Sampling
This study adopted the questionnaire based survey method because it captures causal
relationships between constructs and hence provides generalizable statements on the research setting (Pinsonneault and Kraemer, 1993). Moreover, surveys can accurately document the norm, identify extreme information and delineate associations between variables in a sample (Gable, 1994). Straub et al. (2004) also recommended survey research for explanatory and predictive theory in order to ensure greater confidence in the generalizability of the results.
The survey questionnaire used in the study consists of previously published multi-item scales with favorable psychometric properties (see Table 3). All the constructs in the model were measured using 7-point Likert scales (strongly disagree – strongly agree). A cross-sectional survey was used to collect the data and test the research model.
The data collection consisted of three steps. Before the main survey, a pilot study was conducted to ensure that the measures were valid and reliable. The questionnaires were distributed to on-the-job postgraduate students in the Master of Engineering program in one of the leading Chinese universities. Among them only those who had big data and business analytics experiences were invited to fill in the questionnaire. 42 usable questionnaires were collected and the measures ensured good reliability and validity. The final items used in the questionnaire and their sources are listed in Table 3.
We collected data from China as one of the most active areas in e-commerce and m-commerce development and the online markets of China account around for 60% of retail in Asia (Harca 2015). This is a hugely significant retail market that attracts scholars and practitioners because of the wealth of data gathered. Chinese practitioners have opportunities to pin it down and make the data useful, however these practices are not limited to China alone; it can be used for other countries. By designing the study on the general capabilities that these practitioners need to have in big data analytics and avoiding culture-sensitive concepts, we believe our data has generalisability to other countries.
The main survey was conducted by a market research firm with a database of more than 10,000 Chinese IT managers and business analysts. There are two reasons why we choose this market firm: 1) it has the resource of a large list of more than 10,000 Chinese IT managers and business analysts, 2) it has a professional reputation for its survey quality control. An online questionnaire was distributed to 500 people using simple random sampling. In around two weeks, we received responses from 315 people. Due to the online nature of the data collection, the study did not provide any missing values because respondents were not allowed to proceed to the next question if they did not answer a particular question. However, this option resulted into 20 incomplete answers and the study excluded those responses from the dataset. We also excluded those responses from the study that were provided by managers without any big data and business analytic experience. After these procedures, 225 questionnaires were usable.
To collect more data, we asked the market research firm to distribute the survey to another 200 people, and 90 more responses were received. In the end, there were 297 usable questionnaires. Of the
respondents, 77.7% were male, and the majority (more than 86%) had a college qualification or above. Table 2 represents the respondents’ demographic characteristics and the characteristics of their firms.
Table 2 here.
6 CONFIRMATORY FACTOR ANALYSIS USING PLS-SEM
In order to assess the higher-order BDA capabilities model, the study applied partial least squares based structural equation modeling (PLS-SEM) because it estimates hierarchical models by removing the uncertainty of inadmissible solutions using its flexible assumptions (Hair et al., 2011, Hulland et al., 2010). We applied PLS-SEM because it ensures greater theoretical parsimony and less model
complexity to estimate the hierarchical model (Edwards, 2001, Wetzels et al., 2009). For instance, using PLS path modeling, Wetzels et al. (2009) recently developed a fourth-order, hierarchical-reflective model of online experiential value to predict e-loyalty. Hierarchical modeling can be done in two different ways depending on the relationship between latent variables and manifest variables:
hierarchical-reflective modeling and hierarchical-formative modeling. In the reflective model, the latent variables affect the manifest variables (LVsMVs), whereas in the formative model, the manifest variables affect the latent variables (MVsLVs). The reflective construct is generally viewed as giving rise to its indicators (Fornell and Bookstein, 1982), but the formative construct views its indicators as defining characteristics. Based on the established guidelines on hierarchical modelling (Wetzels et al., 2009, Becker et al., 2012, Akter et al., 2010), the study applied PLS-SEM to estimate the third-order, reflective BDA capabilities model.
6.1 Measurement Model
In order to assess the hierarchical research model, we used PLS Graph 3.0 (Chin, 2001) to estimate the parameters in the outer and inner models. In this case, we applied PLS-SEM with a path weighting scheme for the inside approximation. Then we applied nonparametric bootstrapping (Efron and Tibshirani, 1993, Chin, 2010b) with 5,000 replications to obtain the standard errors of the estimates (Hair et al., 2013). The measurement model was evaluated prior to the structural model, in terms of construct reliability, unidimensionality, convergent validity, and discriminant validity. The BDA capability model is a third-order hierarchical model with 3 second-order constructs and 11 first-order constructs with a total of 50 items. In Table 3, some descriptive statistics on the constructs are presented. Convergent validity, unidimensionality and discriminant validity are evaluated in the following sections.
Following Anderson and Gerbing (1988), we confirmed convergent validity as all the items were significantly loaded on their designated latent variables. A higher-order confirmatory factor analysis (CFA) (Bentler, 1989) was carried out to test the convergent validity of each construct. The standardized CFA loadings in Table 4 present evidence of convergent validity. All the item loadings were greater than the threshold of 0.70 (Fornell and Larcker, 1981a). We ensured unidimensionality of the measurement model using four criteria. First, unidimensionality was supported by higher internal consistency (i.e., loadings > 0.707, p < 0.01) of items under each construct (Chin, 2010a). Second, unidimensionality was established by Cronbach’s alpha, which exceeds 0.70 for all the constructs (Nunnally and Bernstein, 1994). Third, the AVEs of each construct were greater than 0.50, which adequately reflects
unidimensionality (Fornell and Larcker, 1981b). Higher AVEs indicate that the observed items explain more variance than the error terms. Finally, unidimensionality was supported by the composite
reliability of each construct, which exceeds the 0.80 cut-off value (Segers, 1997, Hair et al., 2013). Composite reliability is the most robust measure of a construct’s internal consistency because it
prioritizes items by their reliability in estimating measurement model (Hair et al., 2011). We also ensured discriminant validity by estimating the square root of the AVEs in the diagonals of the
correlation matrix in Table 5. The findings show that the square root of AVE of a construct was higher than its correlations with other constructs, suggesting that the measurement model in this study has good discriminant validity. This test highlights that the latent constructs have different items and they are conceptually distinct from each other (Chin, 2010a).
Table 3 here. Table 4 here.
We also tested whether the principal factor accounted for the majority of the variance explained in order to identify a potential common method bias (Podsakoff and Organ, 1986). The first factor accounted for 57% of total variance; this result is a bit high and indicates that there is a possibility of common method bias. However, the correlation matrix (Table 5) shows that the highest inter-construct correlation is 0.83, while common method bias is usually evidenced by extremely high correlations (r>0.90) (Bagozzi et al., 1991). Therefore, common method bias is not a serious issue in this research. To check for multicollinearity, collinearity diagnostics for constructs were also conducted. The analysis shows that the collinearity indicator (variance inflation factor) falls below the acceptable cut-off point (VIF<5) (Hair et al., 2006), suggesting that multicollinearity is not an issue in our study. Finally, we
estimated the goodness of fit ( communality R2 ) following Tenenhaus et al. (2005) for PLS path modelling and the results show that the model has adequate goodness-of-fit as it exceeds the 0.36 suggested by Wetzels et al. (2009).
6.2 Structural Model
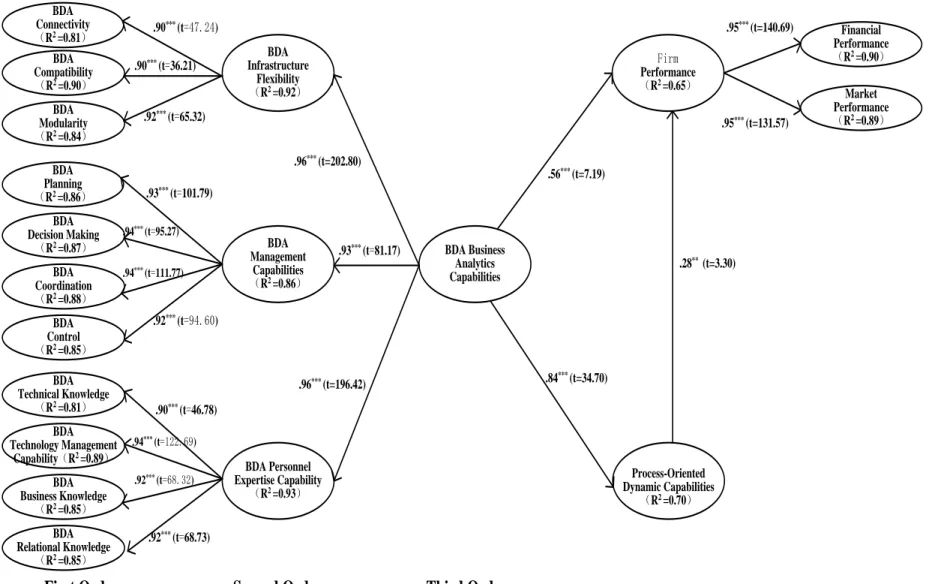
The structural model indicates that BDAC and PODC enhanced FPER, with path coefficients of 0.56 (p < 0.001) and 0.28 (p < 0.01) respectively, explaining 65% of the variance. BDAC enhanced PODC, with a path coefficient of 0.84 (p < 0.001), explaining 70% of the variance. Thus, all three hypotheses, H1 to H3, were supported as the path coefficients were significant at p < 0.001. In sum, the R² scores for all dependent variables (FPER: 65%; PODC: 70%) explained by the research model were significantly large according to the effect sizes defined for R2 by Cohen (1988) and (Chin, 2010b).
Figure 2 here.
6.3 Test for Mediating Effects
Our proposed research model includes potential mediation effects. Specifically, PODC may mediate the impact of BDAC on FPER. The procedure for mediation analysis is based on the path coefficients and standard errors of the direct paths between (i) independent and mediating variables (i.e., iv→m), and (ii) mediating and dependent variables (i.e., m→dv). The results of the PLS analysis are used to calculate the extent to which a construct mediates the relationship between the independent variable and the dependent variable (Hoyle and Kenny, 1999). In this study, the magnitude of the mediation effect between BDAC (iv) and FPER (dv) mediated by PODC (m) is the product of the standardized paths between iv and m and between m and dv. The standard deviation of the mediated path can be computed based on the magnitudes and the variance of the paths among iv, m, and dv. The results of the analyses of paths in the model are shown in Table 6. The results showed that PODC mediated BDAC and FPER with a z-statistic of 3.19 using the Sobel test.
7 CONCLUSIONS
The primary objective of this study was to examine the direct impact of BDAC on FPER, as well as the mediating effects of PODC on the relationship between BDAC and FPER. The results show that all the causal links posited by our model are supported. More specifically, both BDAC and PODC explain 65% of the variance of FPER in which 30% of the variance is explained by the mediator. The study estimated the size of the indirect effect using variance accounted for (VAF) value, which indicates the ratio of the indirect effect to the total effect (0.84*0.28/0.84*0.28+0.56). The findings show that the higher-order BDAC construct has a stronger effect on FPER than the PODC. However, PODC appears to be a significant partial mediator, which suggests improving both BDAC and PODC in order to enhance FPER. Among all the dimensions of BDAC, infrastructure and personnel capabilities (β=0.96) were relatively more important than management capability (β=0.93). Although we identified these differences in measuring the importance of BDAC dimensions, we note that differences are very small, thus all the dimensions should be given equal importance in building BDAC. The findings also show that second-order constructs have significant positive association with their corresponding first order components. For instance, infrastructure capability was reflected by connectivity (β=0.90), compatibility (β=0.90) and modularity (β=0.92) in which modularity reflects the highest variance (85%) of
infrastructure capability. Accordingly, variance of management capability and personnel capability were calculated to reflect their corresponding components (Figure 2). Overall, the nomological validity of the study was ensured as the findings show that BDAC has a significant positive impact on both PODC (R2 = 0.70) and FPER (R2 = 0.65) in which PODC was recognized as a strong mediator.
7.1 Implications for Research
This study has several theoretical implications for BDAC research. First of all, it is among the first studies to assess the impact of BDAC on firm performance and process-oriented dynamic
capabilities and evaluate the mediation effect of PODC on the relationship between BDAC and FPER. Although there is a rich body of literature on BDAC (Kim et al. 2012) and PODC (Kim, Shin, Kim, & Lee, 2011), research on integration of the two constructs is scant. The role of BDAC on FPER emerges clearly from the previous literature. What is less understood is the mediating effect of PODC on
BDAC’s impact on FPER. Hence, our study tested the mediating effect on BDAC and FPER using data gathered from Chinese firms. This study also integrates BDAC and PODC in a single model and
reconciles what had previously been assumed to be independent constructs. In the existing literature, the combined effects of BDAC and PODC have rarely been studied. Finally, by adopting the approach of decomposing BDAC into three constructs, as shown in the theoretical model (Figure 1), we show that this method helps to understand the linkage between BDAC and FPER.
7.2 Implications for Practice
Many of our findings provide guidance to managers and consultants who are engaged in implementing BDAC in firms. The mediating role of PODC clearly highlights how, in uncertain
environments, BDAC can be leveraged as a source of sustainable competitive advantage. Conversely, if PODC is missing, then BDAC, which may be effective in the present scenario, can lose its competitive advantage, given that the business environment is highly dynamic in nature. The finding that the three BDAC components strongly influence firms’ performance indicates that, in order to translate BDAC into firm performance, managers need to concentrate on infrastructure capability, which includes BDA connectivity, compatibility and modularity. Similarly, managers may examine the microstructure of BDA planning, investment, coordination and control. This helps to ensure BDA management capability,
which is one of the pillars of BDAC. Finally, the most important pillar of BDAC is BDA personnel expertise capability. To strengthen this aspect of BDAC, an organized effort must be made to build technical knowledge, technological management knowledge, business knowledge and relational
knowledge related to BDA. We recognize that the idea of recommending that organizations embrace the three-pillar strategy of BDAC may sound highly theoretical. However, this conclusion is based on our findings from the data.
7.3 Limitations and Future Research
We believe that our model is sound and firmly grounded in theory and we have tested it with reliable survey instruments and data. Nevertheless, some limitations and unanswered questions must be addressed. First, we conducted the study within the specific domain of big data analytics and in one context. Although BDA by its nature is context-specific due to the variations in analytics industry, replications of the conceptual model in other settings would enhance its generalizability. Second, we tested our model using cross-sectional data, thus we recommend retesting the findings using panel data to investigate its stability. Third, in our study we adopted perceptual performance measures, which could be replaced by objective measures to present a concrete picture of BDAC’s impact on firm performance. Fourth, we recommend developing context specific BDAC instrument (e.g., customer analytics, supply chain analytics etc.) through rigorous scale validation procedure in order to better measure BDAC for various industries. Finally, we did not investigate the impact of organizational culture and top
management commitment on the implementation of BDAC in a firm, which could be taken into account as moderating variables to extend knowledge in the big data economy.
References
AKTER, S., D’AMBRA, J. & RAY, P. 2010. Service quality of mHealth platforms: development and validation of a hierarchical model using PLS. Electronic Markets, 20, 209-227.
ANAND, A., FOSSO WAMBA, S. & SHARMA, S. The Effects of Firm IT Capabilities on Firm Performance: The Mediating Effects of Process Improvement 24th Australasian Conference on Information Systems, 4-6 December 2013 Melbourne, Australia.
ANDERSON, J. C. & GERBING, D. W. 1988. Structural equation modeling in practice : a review and recommended two-step approach Psychological Bulletin, 103, 411-423.
ARAL, S. & WEILL, P. 2007. IT Assets, Organizational Capabilities, and Firm Performance: How Resource Allocations and Organizational Differences Explain Performance Variation. Organization Science, 18,
763-780.
BAGOZZI, R. P., YI, Y. & PHILLIPS, L. W. 1991. Assessing construct validity in organizational research.
Administrative Science Quarterly, 36, 421-458.
BARTON, D. & COURT, D. 2012. Making advanced analytics work for you. Harvard business review, 90, 78. BARUA, A., KONANA, P., WHINSTON, A. B. & YIN, F. 2004. An Empirical Investigation of Net-Enabled
Business Value. MIS Quarterly, 28, 585-620.
BARUA, A., KRIEBEL, C. & MUKHOPADHYAY, T. 1995. Information technology and business value: an analytic and empirical investigation. INFORMATION SYSTEMS RESEARCH, 6, 3-23.
BECKER, J.-M., KLEIN, K. & WETZELS, M. 2012. Hierarchical latent variable models in PLS-SEM: guidelines for using reflective-formative type models. Long Range Planning, 45, 359-394.
BENTLER, P. M. 1989. EQS 6 structural equations program manual Los Angeles: Multivariate Software, Inc. BHARADWAJ, A. 2000. A resource-based perspective on information capability and firm performance: an
empirical investigation. MIS Quarterly, 24, 169-196.
BHATT, G. D. & GROVER, V. 2005. Types of Information Technology Capabilities and Their Role in Competitive Advantage: An Empirical Study. Journal of Management Information Systems, 22, 253-277. BRANDS, K. C. M. A. 2014. Big Data and Business Intelligence for Management Accountants. Strategic
Finance, 95, 64-65.
BRYNJOLFSSON, E. & HITT, L. M. 2000. Beyond Computation: Information Technology, Organizational Transformation and Business Performance. The Journal of Economic Perspectives, 14, 23-48.
BRYNJOLFSSON, E. & YANG, S. 1996. Information technology and productivity: a review of the literature.
Advances in computers, 43, 179-214.
CHEN, Y., WANG, Y., NEVO, S., JIN, J., WANG, L. & CHOW, W. S. 2014. IT capability and organizational performance: the roles of business process agility and environmental factors. European Journal of Information Systems, 23, 326-342.
CHIN, W. W. 2001. PLS-graph user’s guide. CT Bauer College of Business, University of Houston, USA. CHIN, W. W. 2010a. How to write up and report PLS analyses. Handbook of partial least squares. Springer. CHIN, W. W. 2010b. How to write up and report PLS analyses. Handbook of partial least squares, 655-690. CLEMONS, E. K. & ROW, M. C. 1991. Sustaining IT advantage: the role of structural differences. MIS
quarterly, 275-292.
COHEN, J. 1988. Statistical power analysis for the behavioral sciences, Routledge Academic. DAVENPORT, T. H. 2006. Competing on analytics. harvard business review, 84, 98-107.
DAVENPORT, T. H., BARTH, P. & BEAN, R. 2012a. How ‘Big Data’is Different. MIT Sloan Management Review, 54, 43-46.
DAVENPORT, T. H., BARTH, P. & BEAN, R. 2012b. How Big Data Is Different. MIT Sloan Management Review, 54, 43-46.
DAVENPORT, T. H. & HARRIS, J. G. 2007. Competing on analytics: the new science of winning, Harvard Business School Press.
DEVARAJ, S. & KOHLI, R. 2003. Performance impacts of information technology: Is actual usage the missing link? Management science, 49, 273-289.
EDWARDS, J. R. 2001. Multidimensional constructs in organizational behavior research: An integrative analytical framework. Organizational Research Methods, 4, 144-192.
EFRON, B. & TIBSHIRANI, R. 1993. An introduction to the bootstrap, Chapman & Hall/CRC.
FORNELL, C. & BOOKSTEIN, F. L. 1982. Two Structural Equation Models: LISREL and PLS Applied to Consumer Exit-Voice Theory. Journal of Marketing Research, 19, 440-452.
FORNELL, C. & LARCKER, D. F. 1981a. Evaluating structural equation models with observable variables and measurement error. Journal of Marketing Research, 18, 39-50.
FORNELL, C. & LARCKER, D. F. 1981b. Evaluating structural equation models with unobservable variables and measurement error. Journal of Marketing Research, 39-50.
FOSSO WAMBA, S., AKTER, S., EDWARDS, A., CHOPIN, G. & GNANZOU, D. 2015. How ‘big data’ can make big impact: Findings from a systematic review and a longitudinal case study. International Journal of Production Economics, 0, xx-xx.
GABLE, G. G. 1994. Integrating case study and survey research methods: an example in information systems.
European Journal of Information Systems, 3, 112-126.
GARDNER, D. 2013. Ford scours for more big data to bolster quality, improve manufacturing, streamline processes [Online]. Available: http://www.zdnet.com/ford-scours-for-more-big-data-to-bolster-quality-improve-manufacturing-streamline-processes-7000010451/ [Accessed 19th February 2014].
GERMANN, F., LILIEN, G. L., FIEDLER, L. & KRAUS, M. 2014. Do Retailers Benefit from Deploying Customer Analytics? Journal of Retailing, 90, 587-593.
GIBB, F., THORNLEY, C., FERGUSON, S. & WECKERT, J. 2011. The application of RFIDs in libraries: an assessment of technological, management and professional issues. International Journal of Information Management, 31, 244-251.
GOES, P. B. 2014. Big Data and IS Research. MIS Quarterly, 38, iii-viii.
GRANT, R. M. 1991. The resource-based theory of competitive advantage: implications for strategy formulation.
Knowledge and Strategy.(Ed. M. Zack) pp, 3-23.
HAGEL, J. 2015. Bringing Analytics to Life. Journal of Accountancy, 219, 24-25.
HAGSTROM, M. 2012. High-performance analytics fuels innovation and inclusive growth: Use big data, hyperconnectivity and speed to intelligence to get true value in the digital economy. Journal of Advanced Analytics, 3-4.
HAIR, J. F., HULT, G. T. M., RINGLE, C. & SARSTEDT, M. 2013. A primer on partial least squares structural equation modeling (PLS-SEM), SAGE Publications, Incorporated.
HAIR, J. F., RINGLE, C. M. & SARSTEDT, M. 2011. PLS-SEM: Indeed a silver bullet. The Journal of Marketing Theory and Practice, 19, 139-152.
HAIR, J. F., TATHAM, R. L., ANDERSON, R. E. & BLACK, W. 2006. Multivariate data analysis, NJ, Pearson Prentice Hall.
HULLAND, J., RYAN, M. J. & RAYNER, R. K. 2010. Modeling customer satisfaction: a comparative performance evaluation of covariance structure analysis versus partial least squares. Handbook of partial least squares. Springer.
KIM, G., SHIN, B., KIM, K. K. & LEE, H. G. 2011. IT Capabilities, Process-Oriented Dynamic Capabilities, and Firm Financial Performance Journal of the Association for Information Systems, 12, 487-517.
KIM, G., SHIN, B. & KWON, O. 2012. Investigating the Value of Sociomaterialism in Conceptualizing IT Capability of a Firm. Journal of Management Information Systems, 29, 327-362.
KIRON, D. 2013. Organizational Alignment is Key to Big Data Success. MIT Sloan Management Review, 54, 1-n/a.
KIRON, D., PRENTICE, P. K. & FERGUSON, R. B. 2014. The analytics mandate. MIT Sloan management review, 55, 1-25.
LIN, B.-W. 2007. Information technology capability and value creation: Evidence from the US banking industry.
Technology in Society, 29, 93-106.
LIU, Y. 2014. Big Data and Predictive Business Analytics. The Journal of Business Forecasting, 33, 40-42. LU, Y. & RAMAMURTHY, K. 2011. Understanding the link between information technology capability and
organizational agility: an empirical examination. MIS Quarterly, 35, 931-954.
MANYIKA, J., CHUI, M., BROWN, B., BUGHIN, J., DOBBS, R., ROXBURGH, C. & BYERS, A. H. 2011. Big data: the next frontier for innovation, competition and productivity. McKinsey Global Institute. MCAFEE, A. & BRYNJOLFSSON, E. 2012a. Big data: the management revolution. Harvard business review, 1. MCAFEE, A. & BRYNJOLFSSON, E. 2012b. Big data: the management revolution. Harvard business review,
MITHAS, S., RAMASUBBU, N. & SAMBAMURTHY, V. 2011. How information management capability influences firm performance. MIS Quarterly, 35, 237-256.
MOONEY, J. G., GURBAXANI, V. & KRAEMER, K. L. 1996. A process oriented framework for assessing the business value of information technology. SIGMIS Database, 27, 68-81.
NUNNALLY, J. C. & BERNSTEIN, I. 1994. The assessment of reliability. Psychometric theory, 3, 248-292. ORLIKOWSKI, W. J. 2007. Sociomaterial practices: Exploring technology at work. Organization studies, 28,
1435-1448.
ORLIKOWSKI, W. J. & SCOTT, S. V. 2008. 10 Sociomateriality: Challenging the Separation of Technology, Work and Organization. The academy of management annals, 2, 433-474.
PINSONNEAULT, A. & KRAEMER, K. L. 1993. Survey research methodology in management information systems: an assessment. Journal of Management Information Systems, 75-105.
PODSAKOFF, P. M. & ORGAN, D. W. 1986. Self-Reports in Organizational Research: Problems and Prospects.
Journal of Management, 12, 531-544.
PORTER, M. E. & MILLAR, V. E. 1985. How information gives you competitive advantage. Harvard Business Review, Reprint Service.
POWELL, T. C. & DENT-MICALLEF, A. 1997. Information technology as competitive advantage: The role of human, business, and technology resources. Strategic management journal, 18, 375-405.
ROACH, S. S., STANLEY, M. & CO 1987. America's Technology Dilemma: A Profile of the Information Economy, Morgan Stanley.
RYU, H.-S. & LEE, J.-N. Effect of IT Capability on the Alignment between Business and Service Innovation Strategies. Pacific Asia Conference on Information Systems (PACIS), June 18th to 22nd 2013 Jeju Island, Korea
SANTHANAM, R. & HARTONO, E. 2003. Issues in Linking Information Technology Capability to Firm Performance. MIS Quarterly, 27, 125-153.
SEGERS, A. H. 1997. Assessing the unidimensionality of measurement: A paradigm and illustration within the context of information systems. Omega, 25, 107-121.
SOLOW, R. 1987. We'd better watch out, New York Times Book Review.
STRASSMANN, P. A. 1990. The Business Value of Computers: An Executive's Guide, Information Economics Press.
STRAUB, D., BOUDREAU, M.-C. & GEFEN, D. 2004. Validation guidelines for IS positivist research.
Communications of the Association for Information Systems, 13, 380-427.
STRAWN, G. O. 2012. Scientific Research: How Many Paradigms? EDUCAUSE Review, 47, 26.
TENENHAUS, M., VINZI, V. E., CHATELIN, Y.-M. & LAURO, C. 2005. PLS path modeling. Computational statistics & data analysis, 48, 159-205.
TIPPINS, M. J. & SOHI, R. S. 2003. IT competency and firm performance: is organizational learning a missing link? Strategic Management Journal, 24, 745-761.
TWENEY, D. 2013. Walmart scoops up Inkiru to bolster its ‘big data’ capabilities online [Online]. Available: http://venturebeat.com/2013/06/10/walmart-scoops-up-inkiru-to-bolster-its-big-data-capabilities-online/ [Accessed 15 October 2013].
WANG, N., LIANG, H., ZHONG, W., XUE, Y. & XIAO, J. 2012. Resource Structuring or Capability Building? An Empirical Study of the Business Value of Information Technology. J. Manage. Inf. Syst., 29, 325-367. WARD, D. G. J. D. 2014. A Guide to the Strategic Use of Big Data. Information Management, 48, 45-47.
WETZELS, M., ODEKERKEN-SCHRODER, G. & VAN OPPEN, C. 2009. Using PLS path modeling for assessing hierarchical construct models: guidelines and empirical illustration. MIS Quarterly, 33, 177. WILKINS, J. 2013. Big data and its impact on manufacturing [Online]. Available:
http://www.dpaonthenet.net/article/65238/Big-data-and-its-impact-on-manufacturing.aspx [Accessed 17 February 2014].
WILLS, M. J. 2014. Decisions Through Data: Analytics in Healthcare. Journal of Healthcare Management, 59,
254-62.
YIU, C. 2012. The Big Data Opportunity: Making Government faster, smarter and more personal. Policy Exchange. London.
ZEE, J. T. M. V. D. & JONG, B. D. 1999. Alignment Is Not Enough: Integrating Business and Information Technology Management with the Balanced Business Scorecard. Journal of Management Information Systems, 16, 137-156.
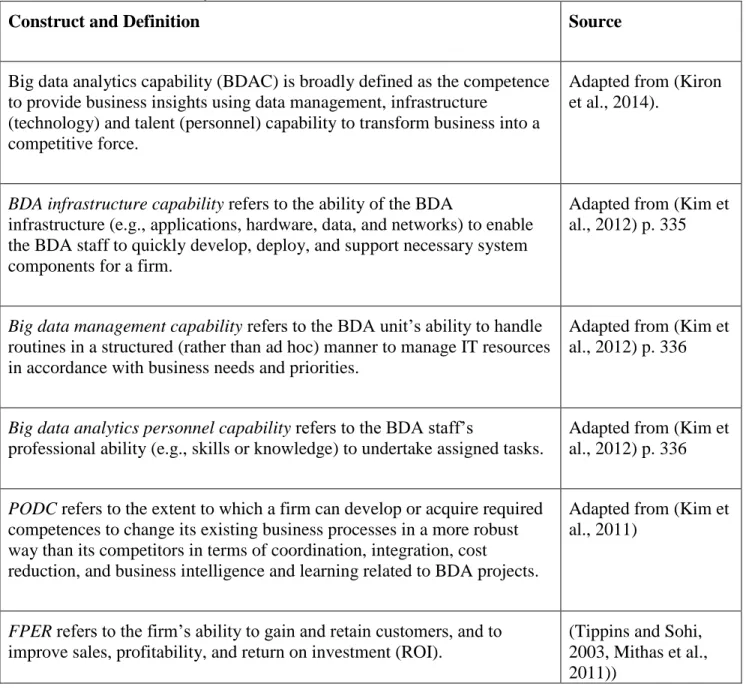
Table 1. Constructs and definitions
Construct and Definition Source
Big data analytics capability (BDAC) is broadly defined as the competence to provide business insights using data management, infrastructure
(technology) and talent (personnel) capability to transform business into a competitive force.
Adapted from (Kiron et al., 2014).
BDA infrastructure capability refers to the ability of the BDA
infrastructure (e.g., applications, hardware, data, and networks) to enable the BDA staff to quickly develop, deploy, and support necessary system components for a firm.
Adapted from (Kim et al., 2012) p. 335
Big data management capability refers to the BDA unit’s ability to handle routines in a structured (rather than ad hoc) manner to manage IT resources in accordance with business needs and priorities.
Adapted from (Kim et al., 2012) p. 336
Big data analytics personnel capability refers to the BDA staff’s
professional ability (e.g., skills or knowledge) to undertake assigned tasks.
Adapted from (Kim et al., 2012) p. 336
PODC refers to the extent to which a firm can develop or acquire required competences to change its existing business processes in a more robust way than its competitors in terms of coordination, integration, cost
reduction, and business intelligence and learning related to BDA projects.
Adapted from (Kim et al., 2011)
FPER refers to the firm’s ability to gain and retain customers, and to improve sales, profitability, and return on investment (ROI).
(Tippins and Sohi, 2003, Mithas et al., 2011))
Table 2. Demographic profile of respondents
Dimension Category Percentage
(%)
Education
No formal qualification 0
Primary school qualification 1.35
Secondary school qualification 2.36
College qualification (diploma/certificate) 9.46
Undergraduate degree 67.57
Postgraduate degree (Master/Ph.D.) 19.26
Age
18–25 years old 22.30
26–33 years old 43.92
34–41 years old 30.07
42–49 years old 3.72
50 years old or older 0
Gender Male 77.70
Female 22.30
Industry
Accommodation and food service activities 5.74
Administrative and support service activities 6.76
Agriculture, forestry and fishing 1.35
Arts, entertainment and recreation 1.69
Construction 4.73
Education 2.36
Electricity, gas, steam and air conditioning supply 1.01
Financial and insurance activities 12.84
Human health and social work activities 0
Information and communication 36.15
Manufacturing 14.19
Mining and quarrying 0.68
Professional, scientific and technical activities 3.04 Public administration and defense; compulsory social
security 0
Transportation and storage 2.03
Water supply; sewerage, waste management 0
Wholesale and retail trade; repair of motor vehicles and
motorcycles 2.03
Figure 1. Research model Firm Performance BDA Infrastructure Flexibility BDA Connectivity BDA Compatibility BDA Modularity BDA Planning BDA Investment BDA Coordination BDA Control BDA Technical Knowledge BDA Technology Management Capability BDA Business Knowledge BDA Relational Knowledge BDA Management Capabilities BDA Personnel Expertise Capability BDA Business Analytics Capabilities Process-Oriented Dynamic Capabilities Financial Performance Market Performance
First Order Second Order Third Order
H2(+)
H1(+)
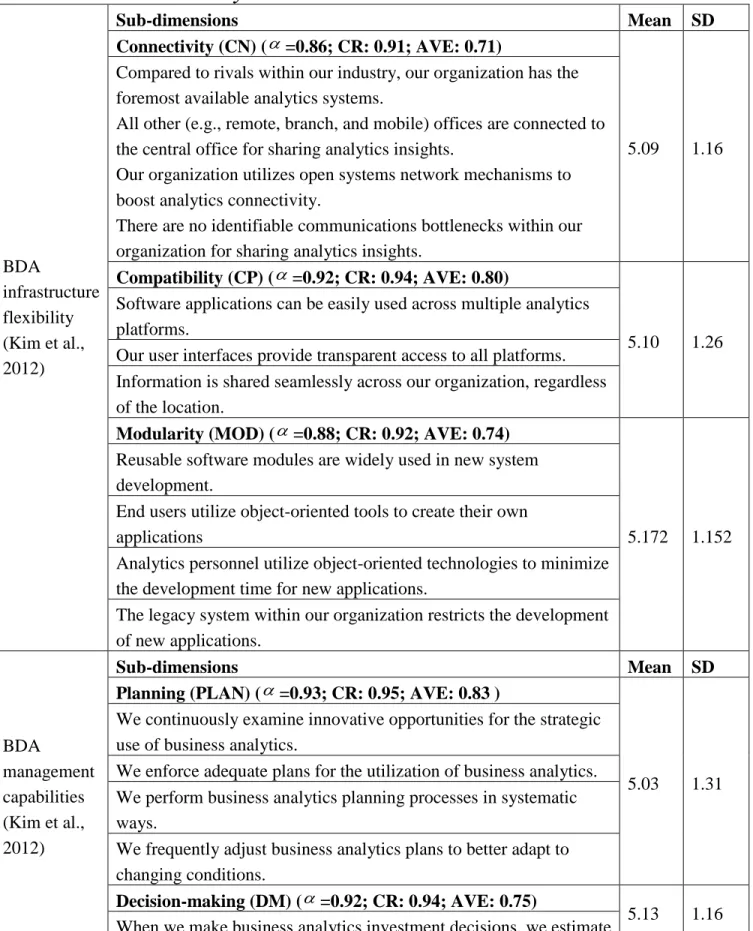
Table 3. Construct and survey items BDA infrastructure flexibility (Kim et al., 2012) Sub-dimensions Mean SD Connectivity (CN) (=0.86; CR: 0.91; AVE: 0.71) 5.09 1.16 Compared to rivals within our industry, our organization has the
foremost available analytics systems.
All other (e.g., remote, branch, and mobile) offices are connected to the central office for sharing analytics insights.
Our organization utilizes open systems network mechanisms to boost analytics connectivity.
There are no identifiable communications bottlenecks within our organizationfor sharing analytics insights.
Compatibility (CP) (=0.92; CR: 0.94; AVE: 0.80)
5.10 1.26 Software applications can be easily used across multiple analytics
platforms.
Our user interfaces provide transparent access to all platforms. Information is shared seamlessly across our organization, regardless of the location.
Modularity (MOD) (=0.88; CR: 0.92; AVE:0.74)
5.172 1.152 Reusable software modules are widely used in new system
development.
End users utilize object-oriented tools to create their own applications
Analytics personnel utilize object-oriented technologies to minimize the development time for new applications.
The legacy system within our organization restricts the development of new applications. BDA management capabilities (Kim et al., 2012) Sub-dimensions Mean SD
Planning (PLAN) (=0.93; CR: 0.95; AVE: 0.83 )
5.03 1.31 We continuously examine innovative opportunities for the strategic
use of business analytics.
We enforce adequate plans for the utilization of business analytics. We perform business analytics planning processes in systematic ways.
We frequently adjust business analytics plans to better adapt to changing conditions.
Decision-making (DM) (=0.92; CR:0.94; AVE:0.75)
5.13 1.16 When we make business analytics investment decisions, we estimate
the effect they will have on the productivity of the employees’ work. When we make business analytics investment decisions, we project how much these options will help end users make quicker decisions. When we make business analytics investment decisions, we estimate whether they will consolidate or eliminate jobs.
When we make business analytics investment decisions, we estimate the cost of training that end users will need.
When we make business analytics investment decisions, we estimate the time managers will need to spend overseeing the change.
Coordination (COD) (=0.91; CR: 0.94; AVE:0.79)
5.011 1.215 In our organization, business analysts and line people meet regularly
to discuss important issues.
In our organization, business analysts and line people from various departments regularly attend cross-functional meetings.
In our organization, business analysts and line people coordinate their efforts harmoniously.
In our organization, information is widely shared between business analysts and line people so that those who make decisions or perform jobs have access to all available know-how.
Control (COL) (=0.93; CR: 0.95; AVE:0.82)
5.29 1.21 In our organization, the responsibility for analytics development is
clear.
We are confident that analytics project proposals are properly appraised.
We constantly monitor the performance of the analytics function. Our analytics department is clear about its performance criteria. Our company is better than competitors in connecting (e.g., communication and information sharing) parties within a business process.
Our company is better than competitors in reducing cost within a business process.
Our company is better than competitors in bringing complex analytical methods to bear on a business process.
Our company is better than competitors in bringing detailed information into a business process.
BDA personnel
Sub-dimensions Mean SD
expertise (Kim et al., 2012)
Our analytics personnel are very capable in terms of programming skills (e.g., structured programming, web-based application, CASE tools, etc.).
Our analytics personnel are very capable in terms of managing project life cycles.
Our analytics personnel are very capable in the areas of data management and maintenance.
Our analytics personnel are very capable in the areas of distributed computing.
Our analytics personnel are very capable in decision support systems (e.g., expert systems, artificial intelligence, data warehousing, mining, marts, etc.).
Technological management knowledge (TMK) (=0.91; CR: 0.94; AVE:0.78)
5.19 1.17 Our analytics personnel show superior understanding of
technological trends.
Our analytics personnel show superior ability to learn new technologies.
Our analytics personnel are very knowledgeable about the critical factors for the success of our organization.
Our analytics personnel are very knowledgeable about the role of business analytics as a means, not an end.
Business knowledge (BK) (=0.91; CR: 0.94; AVE:0.80)
5.23 1.20 Our analytics personnel understand our organization’s policies and
plans at a very high level.
Our analytics personnel are very capable in interpreting business problems and developing appropriate solutions.
Our analytics personnel are very knowledgeable about business functions.
Our analytics personnel are very knowledgeable about the business environment.
Relational knowledge (RK)(=0.91; CR: 0.94; AVE:0.79)
5.30 1.14 Our analytics personnel are very capable in terms of managing
projects.
Our analytics personnel are very capable in terms of executing work in a collective environment.
Our analytics personnel work closely with customers and maintain productive user/client relationships.
Process-oriented dynamic capabilities (Kim et al., 2011) Constructs Mean SD
Process-oriented dynamic capabilities (PODC) (=0.88; CR: 0.92; AVE: 0.74)
5.192 1.219 Our company is better than competitors in connecting (e.g.,
communication and information sharing) parties within a business process.
Our company is better than competitors in reducing cost within a business process.
Our company is better than competitors in bringing complex analytical methods to bear on a business process.
Our company is better than competitors in bringing detailed information into a business process.
Firm performance (Tippins and Sohi, 2003) (Wang et al., 2012) Sub-dimensions Mean SD
Financial performance (FP) (=0.93; CR: 0.95; AVE: 0.78):
Using analytics improved ____ during the last 3 years relative to competitors: 5.55 1.07 ________Customer retention _________Sales growth __________Profitability __________Return on investment
__________Overall financial performance
Market performance (MP) (=0.90; CR: 0.93; AVE: 0.77): Using analytics improved ____ during the last 3 years relative to competitors
5.34 1.09 ______We have entered new markets more quickly than our
competitors
______ We have introduced new products or services to the market faster than our competitors.
______Our success rate of new products or services has been higher than our competitors.
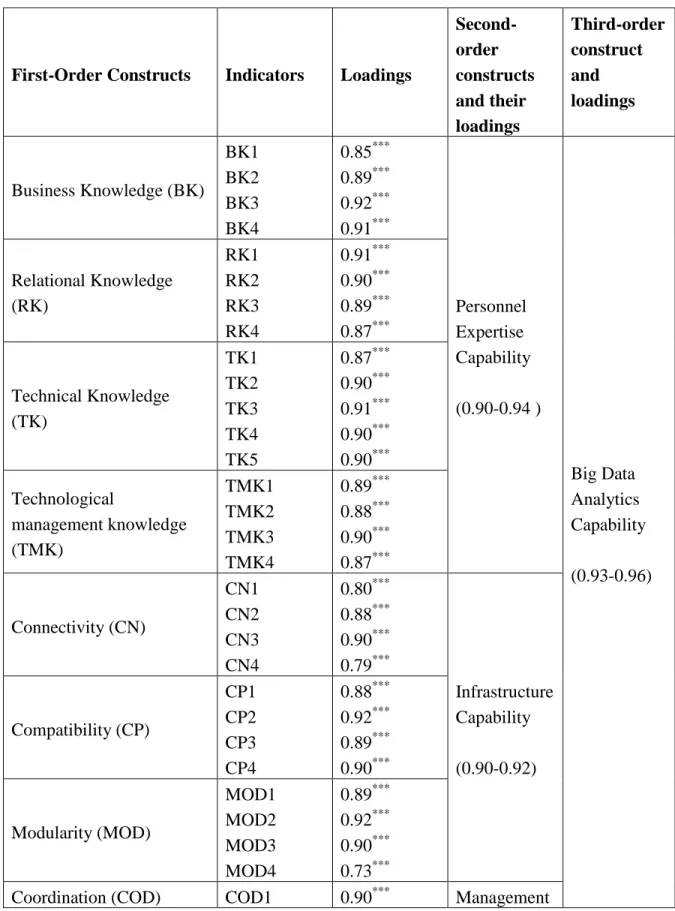
Table 4. Standardized loadings of the latent constructs in the model (***p < 0.001)
First-Order Constructs Indicators Loadings
Second-order constructs and their loadings Third-order construct and loadings Business Knowledge (BK) BK1 BK2 BK3 BK4 0.85*** 0.89*** 0.92*** 0.91*** Personnel Expertise Capability (0.90-0.94 ) Big Data Analytics Capability (0.93-0.96) Relational Knowledge (RK) RK1 RK2 RK3 RK4 0.91*** 0.90*** 0.89*** 0.87*** Technical Knowledge (TK) TK1 TK2 TK3 TK4 TK5 0.87*** 0.90*** 0.91*** 0.90*** 0.90*** Technological management knowledge (TMK) TMK1 TMK2 TMK3 TMK4 0.89*** 0.88*** 0.90*** 0.87*** Connectivity (CN) CN1 CN2 CN3 CN4 0.80*** 0.88*** 0.90*** 0.79*** Infrastructure Capability (0.90-0.92) Compatibility (CP) CP1 CP2 CP3 CP4 0.88*** 0.92*** 0.89*** 0.90*** Modularity (MOD) MOD1 MOD2 MOD3 MOD4 0.89*** 0.92*** 0.90*** 0.73***
COD2 COD3 COD4 0.89*** 0.90*** 0.88*** Capability (0.93-0.94) Control (COL) COL1 COL2 COL3 COL4 0.89*** 0.92*** 0.91*** 0.91*** Decision-making (DM) DM1 DM2 DM3 DM4 DM5 0.87*** 0.87*** 0.84*** 0.87*** 0.89*** Planning (PLAN) PLAN1 PLAN2 PLAN3 PLAN4 0.90*** 0.92*** 0.92*** 0.91*** Financial Performance (FP) FP1 FP2 FP3 FP4 FP5 0.84*** 0.87*** 0.91*** 0.90*** 0.90*** 0.84-0.91 - Market Performance (MP) MP1 MP2 MP3 MP4 0.89*** 0.89*** 0.92*** 0.81*** 0.81-0.92 - Process-oriented Dynamic Capabilities (PODC) PODC1 PODC2 PODC3 PODC4 0.90*** 0.89*** 0.93*** 0.89*** - -
Table 5. Inter-correlations of the first-order latent constructs 1 2 3 4 5 6 7 8 9 10 11 12 13 14 1 CN 0.84 2 CP 0.40 0.89 3 MOD 0.44 0.44 0.86 4 PLAN 0.41 0.34 0.37 0.91 5 DM 0.49 0.35 0.36 0.53 0.87 6 COD 0.45 0.44 0.46 0.55 0.52 0.89 7 COL 0.40 0.35 0.41 0.48 0.53 0.53 0.90 8 TK 0.43 0.44 0.49 0.39 0.37 0.46 0.45 0.91 9 TMK 0.45 0.49 0.48 0.38 0.43 0.45 0.46 0.51 0.89 10 BK 0.46 0.47 0.39 0.37 0.40 0.43 0.41 0.42 0.55 0.89 11 RK 0.48 0.41 0.30 0.35 0.40 0.42 0.44 0.48 0.51 0.51 0.89 12 PODC 0.44 0.49 0.33 0.37 0.35 0.43 0.36 0.46 0.48 0.49 0.42 0.86 13 FP 0.35 0.37 0.37 0.31 0.39 0.47 0.37 0.35 0.47 0.45 0.42 0.44 0.88 14 MP 0.32 0.38 0.44 0.38 0.30 0.42 0.35 0.34 0.36 0.35 0.38 0.37 0.49 0.88
Notes: CN-Connectivity; CP-Compatibility; MOD-Modularity; PLAN-Planning; DM-Decision Making; COD-Coordination; COL-Control; TK-Technical Knowledge; TMK-Technological Management Knowledge; BK-Business Knowledge; RK-Relational Knowledge; PODC-Process-oriented dynamic capabilities; FP- Financial Performance; MP-Market Performance.
Figure 2. Full structural model Firm Performance (R2 =0.65) BDA Infrastructure Flexibility (R2 =0.92) BDA Connectivity (R2 =0.81) BDA Compatibility (R2 =0.90) BDA Modularity (R2 =0.84) BDA Planning (R2 =0.86) BDA Decision Making (R2 =0.87) BDA Coordination (R2 =0.88) BDA Control (R2 =0.85) BDA Technical Knowledge (R2 =0.81) BDA Technology Management Capability(R2 =0.89) BDA Business Knowledge (R2 =0.85) BDA Relational Knowledge (R2 =0.85) BDA Management Capabilities (R2 =0.86) BDA Personnel Expertise Capability (R2 =0.93) BDA Business Analytics Capabilities Process-Oriented Dynamic Capabilities (R2 =0.70) Financial Performance (R2 =0.90) Market Performance (R2 =0.89)
First Order
Second Order
Third Order
.56*** (t=7.19) .84*** (t=34.70) .28** (t=3.30) .95*** (t=140.69) .95*** (t=131.57) .93*** (t=81.17) .96*** (t=202.80) .96*** (t=196.42) .90*** (t=47.24) .90*** (t=36.21) .92*** (t=65.32) .93*** (t=101.79) .94*** (t=95.27) .94*** (t=111.77) .92*** (t=94.60) .90*** (t=46.78) .94*** (t=122.69) .92*** (t=68.32) .92*** (t=68.73) Note: ***p < 0.001, **p<0.01,
Table 6. Significance of mediated paths
Indirect Effect Mediated Path Path Coefficient Z Statistic
BDAC→FPER BDAC→PODC→FPER 0.235 3.19**
Statistic is significant at **p<0.01.
The standard error of the mediated path is approximated based on the formula sqrt(b2Sa2 + a2Sb2 + Sa2Sb2), where a and b are the magnitudes of the paths between iv, m, and dv, and Sa and Sb are the standard deviations