Submitted April 2006 Accepted November 2006
Performance disclosure on the web:
an exploration of the impact of managers’
perceptions of stakeholder concerns
Walter Aerts. University of Antwerp. Belgium. [email protected]
Denis Cormier. Université du Québec à Montréal. Canada. [email protected]
Irene M. Gordon. Simon Fraser University. Canada. [email protected]
Michel Magnan. Concordia University. Canada. [email protected]
Abstract. Using an exploratory research perspective, we examine how multinational firms’ executives’ motivations map into corporate website performance disclosure. Our focus is on managements’ beliefs about the relevance of financial, social and environmental performance disclosures and how these beliefs relate to the firm’s website disclosure practices. For 56 companies, we use managers’ perceptions along with data captured from websites. Employing factor and regression analysis, we find that executives’ perceptions of stakeholders’ importance affect their firms’ web-based disclosure practices and foci. Additionally, strategic focus, media, size of organization, profitability, leverage and analyst following are found influential in explaining types of performance disclosures made.
Key words: Web-Based Disclosures, Managers’ Perceptions, Stakeholder Theory.
1 The data are available from the authors upon request. We acknowledge the financial support of the Social
Scien-ces and Humanities Research Council of Canada, le Fonds québécois de la recherche sur la société et la culture (FQRSC), l’Autorité des Marchés Financiers (Québec), and la Banque Nationale de Belgique for this study.
. INTRODUCTION
The effects of organizations’ voluntary disclosure decisions within society have been studied using legitimacy theory (e.g., Guthrie and Parker, 1989; Buhr, 1998; Wilmhurst and Frost, 2000; Cormier and Gordon, 2001) and stakeholder theory (e.g., Roberts, 1992; Henriques and Sardosky, 1999; Ruf et al., 2001). Recently, these two theories have been used jointly to explore managers’ stakeholder perceptions and how these perceptions relate to the legitimacy of those managers’ organizations (e.g., Cormier et al., 2004).
Studies examining the legitimacy and stakeholder views have employed a variety of research methods. The range in methods spans case-based research (e.g., Guthrie and Parker, 1989; Buhr, 1998; Cormier and Gordon, 2001) to large sample size and quantitative research methods (e.g., Ruf et al., 2001; Neu et al., 1998; Richardson and Welker, 2001). This scope in research methods parallels the rapid evolution over the past decade in the means used to reach stakeholders and to communicate legitimacy. This evolution has moved from primarily paper-based to web-based communications (Louwers et al., 1996; Wildstrom, 1997; Ashbaugh et al., 1999), leading to predictions that certain paper-based communications (e.g. corporate annual reports) will cease to exist (Staff Reports, 1999).
While many reasons have been offered for companies’ voluntary information disclosures (e.g., reduction of disclosure costs) (Atiase, 1985; Lang and Lundholm, 1993: Milgrom, 1981; Roberts, 1992) or information asymmetry (Gibbins et al., 1990; Clarkson et al., 1994; Frankel et al., 1999), most of these reasons are primarily related to financial stakeholders. To more broadly explore the reasons behind managers’ performance disclosure practices as reflected through corporate websites, we propose a model of the relationships among website disclosures, perceived stakeholder interests, firm-specific and contextual variables. We then explicitly examine how well our model portrays the disclosure-stakeholder relationships. We employ several types of data in our study. We first gathered perceptual data from a sample of executives of large international corporations. We next collected and content coded data from the executives’ corporate websites. Additionally, we gathered data informative of the sample companies’ financial setting and information environment. We use statistical analyses of these data to explore how managers’ perceptions of stakeholder concerns affect web disclosure in a strategic communication context.
Our model adds to the literature by examining web-based communications and managers’ perceptions of the interests of stakeholders with respect to these communications. In particular we focus on managements’ beliefs about the relevance of financial, social and environmental performance disclosures and how these beliefs relate to the firm’s actual website disclosure practices.
Our paper is organized in four sections. First, we review relevant literature. Second, we provide our model and a description of the sample data used to empirically illustrate the model. Third, we describe the results of our analysis of this data and discuss our findings. In our final section we outline our study’s limitations and conclusions as well as provide suggestions for future research.
2. BACKGROUND AND RELEVANT LITERATURE
2.. Stakeholders and performance disclosure
It is often assumed that shareholders are most directly affected by a firm’s transparency (or lack thereof) in performance disclosure because of the direct effect on their wealth. However, other stakeholders may also have a vested interest in a firm’s performance disclosure (Harrison and Freeman, 1999). Evan and Freeman (1993) argue that a firm has a stewardship obligation to all stakeholders as they are all affected by its strategy. As well, the quality of a firm’s relationships with its various stakeholders directly influences the firm’s performance (Ogden and Watson, 1999).
Stakeholders are concerned with a firm’s long-term survival as a way to preserve the value of their relationships. Hence, stakeholders’ information needs reflect dimensions of organizational performance that are close to their interests and encompass both financial and non-financial performance measures. Bowen et al. (1995) show that a firm’s accounting method choices are affected by the extent of its explicit and implicit contractual relationships with stakeholders. Cormier et al., (2004), indicate managers consider key stakeholders’ interests and concerns when determining their firm’s environmental performance disclosure, a non-financial measure.
While key stakeholder groups may have overlapping interests, the nature of their exchanges and relationships with the firm implies they also have specific concerns and interests that represent unique informational needs. Voluntary disclosure of firm information will be undertaken if doing so is less costly than having investors and other financial stakeholders incur information costs themselves (Atiase, 1985; Lang and Lundholm, 1993; Milgrom, 1981; Roberts, 1992). Two examples of when firms would follow a voluntary disclosure strategy are when expansion plans require access to capital markets or when there is a wide following of analysts. In these cases voluntary disclosure may reduce information asymmetry between managers and investors and lower financing costs (Gibbins et al., 1990; Clarkson et al., 1994; Frankel et al., 1999; Botosan, 1997; Sengupta, 1998). However, before a firm can benefit from information disclosure, it must build a reputation among stakeholders as a credible discloser (Healy et al., 1999).
Performance disclosure allows stakeholders (e.g., suppliers and customers) to assess the value of their contractual relationships with a firm. Such value is dependent upon critical attributes, e.g. both parties’ going concern status (Bowen et al., 1995), as well as honesty and reputation (Karpoff and Lott, 1993). The evidence suggests that if a firm lacks transparency in one aspect of its activities, stakeholders may infer that other activities or relationships are also tainted or untrustworthy.
Conversely, to legitimize their firm’s activities, managers must be able to assess and react to public pressures, including the nature and scope of public comments about the firm’s activities. One outlet used to gauge public sentiment is the media where increased attention may lead to increased community concern (Brown and Deegan, 1998). Ader (1995) has provided evidence that the extent of attention paid by the media to pollution issues increases community concerns over such issues. This suggests that media attention, e.g., through press coverage, directly underlies public pressures managers may perceive regarding their firm’s activities. In an effort to legitimize their actions, it is expected managers will react to increased pressures by increasing the extent of their performance disclosure. In this respect, the Internet can constitute a useful tool.
2.2. Web-based disclosures
Web-based disclosures have been examined in a variety of recent studies and different contexts where communication has been a primary emphasis. Examples
of the diversity of these studies include comparisons of web-based and print-based advertising (Gallagher et al., 2001a; Gallagher et al., 2001b), website features used in marketing communications (Perry and Bodkin, 2002), and use of websites by activist organizations to communicate with stakeholders (Kent et al., 2001; 2003).
More directly related to our study is research that examines financial and corporate social disclosures made by corporations on their websites. Ashbaugh et al. (1999) using a sample of 253 corporate websites found that for financial disclosures there was a trade-off between the usefulness of web-based information and its reliability. Bodkin and Perry (2004, p. 19), using a sample of 152 Fortune 500 retailers’ websites, found the more profitable companies were “more likely to use company specific, shareholder, web specific and customer service elements.”
Using a sample of 100 Fortune 500 companies, Esrock and Leichty (1998) found that a majority of these websites had some social and environmental disclosures with environmental and technology oriented firms’ websites containing more of these disclosures than companies from the wholesale-retail and finance industries. Esrock and Leichty examined which communications were aimed toward specific stakeholders in their 1999 and 2000 studies. In these papers, the web-based communications were used to reach financial community members, news services and customers but generally not used to reach other stakeholders.
From the cited web-based studies, stakeholders provide a reason for why these disclosures are supplied by companies. Freeman (1984) defined stakeholders as “any group or individual who can affect or is affected by the achievement of the organization’s objectives” (p. 46). To achieve legitimacy entities must reach these stakeholders.
2.3. Managers’ perceptions of stakeholders
Directly related to stakeholder communication is how managers perceive the importance of various stakeholder groups. Managers’ attitudes towards perceptions of stakeholders have been examined from several perspectives. Positive relationships have been found between CEO attitudes and the community (Lerner and Fryxell, 1994) and between the salience of stakeholders, CEO values and corporate social performance (Agle et al., 1999). In environmental disclosure contexts, Henriques
and Sadorsky (1999) found that the relative importance of stakeholders differs depending on the environmental profile of a company while Harvey and Schaefer (2001) found institutional stakeholders were the most important for water and electrical utility companies.
While neither Lerner and Fryxell (1994) nor Agle et al. (1999) provided a model, Cormier et al.’s (2004) focus was on executives’ perceptions of stakeholders with respect to environmental disclosures. Their model outlined the relationship between executives’ perceptions of six stakeholder groups’ interests, the executives’ assessment of their corporations’ concerns and the types of environmental disclosures made. They found evidence supporting their model that for environmental disclosures, the decision to disclose and the resulting disclosures were related to environmental managers’ attitudes towards stakeholder groups.
3. RESEARCH METHODOLOGY
3.. Model of corporate web-based reporting
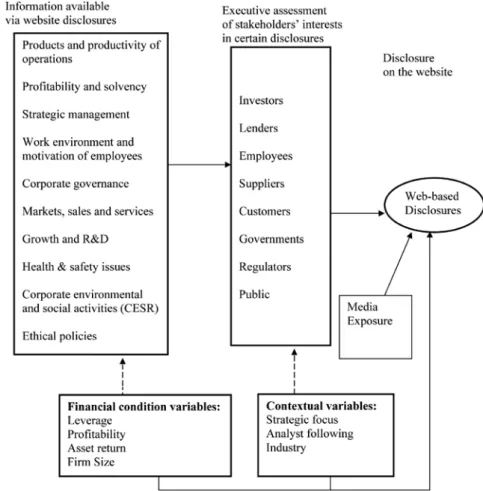
Building on previous research, we provide a model of corporate web-based reporting in Figure 1. The first box contains general types of information corporate executives have available to them for possible disclosure. Disclosure of this information on corporate websites depends on whether managers think the information is important to one or several stakeholder groups or because specific stakeholder groups such as regulators and governments require its disclosure. The second box indicates the eight potential stakeholders used in previous research (e.g., Woodward et al., 1996; Agle et al., 1999; Harvey and Schaefer, 2001) or suggested as being important to companies (Leighton and Thain, 1997; Lev, 1992). These stakeholders are: investors, lenders, employees, suppliers, customers, governments, regulators and the public. In our model, the key is not just that these stakeholders are important but they are thought to be important by managers. Thus the second box represents managers’ perceptions and is the lens through which potential disclosures are viewed. Furthermore, the financial condition and contextual environment of the reporting corporation may affect disclosures. These variables, used to capture the corporation’s financial condition and context, are shown in the third and fourth boxes in Figure 1. By combining and using contextual and perceptual data, we
examine if and how the perceptual data can add to the explanatory factors contained in the contextual variables.
Media exposure is modelled as a direct effect on performance disclosure. The influence of the media derives from the information conveyed about firms (Henriques and Sadorsky, 1999). A firm’s failure to operate in a manner consistent with community, or public, expectations, may lead to its demise (Deegan and Rankin, 1996; Neu et al., 1998). In general, media exposure proxies for both public pressure and a general demand for information, implying the existence of a direct relationship between media exposure and the level of web-based disclosure. However, this “direct” relationship leaves abstract the motivations for impression management of web disclosure strategies. This relationship is shown in the fifth box in Figure 1.
3.2. Description of sample data
Our data were gathered in a multi-stage process for a sample of large North American and European corporations. The first stage was the development and pre-testing of a questionnaire concerned with identifying the primary stakeholders for a variety of disclosures made by companies on their websites.
In lieu of structured interviews and to obtain the desired combined North American/European sample, a questionnaire was employed to gather both subjective and objective data. The questionnaire contained 30 stakeholder-related questions representing seven broad categories of information. Using a scale of 0 (not aimed at this group) to 5 (primarily aimed at this group), executives were asked to indicate their perceptions of the importance of particular web-based disclosures to eight stakeholder groups. A 31st question asked respondents to rate on a 0 (total disagreement) to 5 (total agreement) scale five strategic postures with respect to their firms. Additional data including demographic information, hierarchical structure, and information regarding website monitoring were also collected. Altogether, the questionnaire took about 20 minutes to complete.
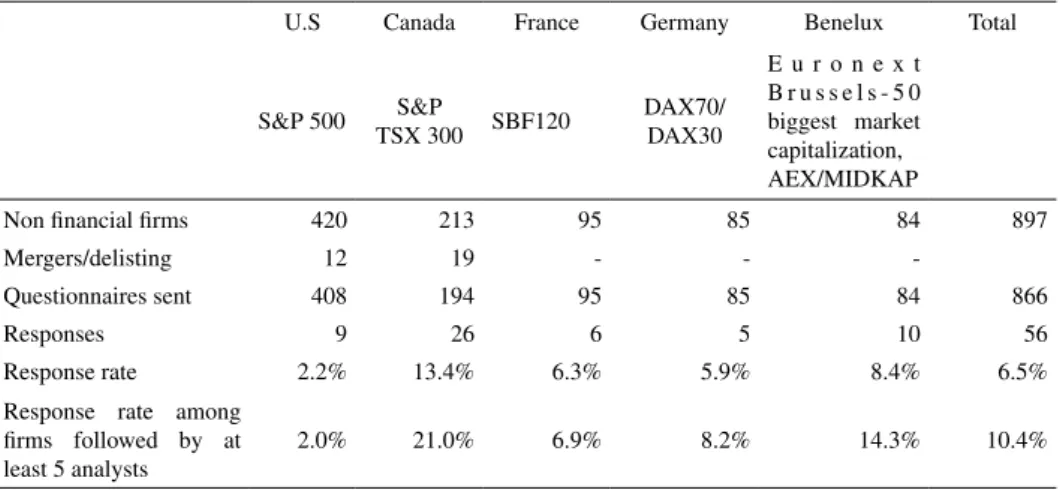
Once the questionnaire was pre-tested, it was sent to a group of 866 multinational firms. The initial population of North American and Continental European firms was previously analysed in 2002 (Aerts et al., 2004). The European countries and firms selected for study were chosen because the authors had expertise in the relevant languages, French, English, Dutch and German, but not other European languages. After two mailings of the questionnaire as well as the mailing of an electronic questionnaire (web), 56 firms responded (a 6.5% response rate, see Table 1). Only one manager responded per firm in the sample and no firms are double counted. The titles of responding individuals included CEO, Vice President Strategic Planning, Vice President Web Development, Head Corporate Relations, Public Affairs Specialist and Corporate Communication Officer. As a test of how well our data represent the sample population, we observe a median analyst following of 12 for the sample population compared to 11.5 for our responding firms.
U.S Canada France Germany Benelux Total
S&P 500 TSX 300S&P SBF120 DAX70/DAX30
E u r o n e x t B r u s s e l s - 5 0 biggest market capitalization, AEX/MIDKAP
Non financial firms 420 213 95 85 84 897
Mergers/delisting 12 19 - -
-Questionnaires sent 408 194 95 85 84 866
Responses 9 26 6 5 10 56
Response rate 2.2% 13.4% 6.3% 5.9% 8.4% 6.5% Response rate among
firms followed by at least 5 analysts
2.0% 21.0% 6.9% 8.2% 14.3% 10.4%
Table 1. Sample description
3.3. Description of variables
Our model is tested using subjective and objective variables such as financial measures, environmental descriptors and managerial perceptions.
3.3.1. Measurement of performance disclosure
Performance measurement practices and research have defined and developed a variety of performance indicators (e.g., Standard & Poors, 2002 for financial and governance disclosure; Pirchegger and Wagenhofer, 1999, and Marston and Polei, 2004, for investors, governance and social responsibility disclosures; Kaplan and Norton, 1996, Ittner and Larcker, 1998, and Robb et al., 2001, for indicators of operations’ efficiency, as well as measures of value for the client, innovation, development and growth). We measure performance disclosure using a coding instrument in a manner similar to Wiseman (1982) and Cormier and Magnan (1999; 2003). The grid we used comprises 101 items. The performance disclosure items are grouped into seven categories: Financial performance, corporate governance, customer value, human and intellectual capital, production efficiency, innovation, development and growth, and social responsibility (see Appendix 1). The rating is based on a score of one to three, where “three” describes items expressed in monetary or quantitative terms, “two” indicates items specifically described and “one” designates items discussed in general. The 56-firm sample had been coded for a separate study in 2002 (Aerts et al., 2004) with the coding procedure replicated
in 2004. This content coding involved independent coders and where discrepancies occurred, these were resolved by a third party.
Overall, the coding process provides a reliable performance disclosure measure. Internal consistency estimates (Cronbach’s alpha on score components) show the variance is quite systematic since alpha varies from 0.86 to 0.96 by components (see Table 3). For the total index, Cronbach’s alpha is 0.74. Cronbach’s alpha estimates the proportion of variance in the test scores that can be attributed to true score variance. It can range from 0 (if no variance is consistent) to 1.00 (if all variance is consistent). According to Nunnally (1978), a score of 0.70 is acceptable.
3.3.2. Firms’ financial condition
Three variables are used to capture the firms’ financial condition that can affect performance disclosure:
Firm Size. Prior evidence is consistent in highlighting a positive relationship between the extent of corporate disclosure and firm size (Scott, 1994; Cormier and Magnan, 1999; Neu et al., 1998, Leuz and Verrecchia, 2000; Debreceny et al., 2002; Cormier and Gordon, 2001; Cormier and Magnan, 2003). Firm size, measured as ln (Assets), is introduced as a contextual variable that is positively related to the extent of performance disclosure.
Profitability. Many studies document a positive association between a firm’s disclosure and its financial performance (Mills and Gardner, 1984; Cochran and Wood, 1984; McGuire et al., 1988; Cormier and Magnan, 1999, 2003; Cormier et al., 2004). For this study profitability is measured as the return on assets and a positive relationship is expected between profitability and performance disclosure.
Leverage. In this study, we define leverage as Long-term debt/Equity. In prior research (Cormier and Magnan, 2003; Cormier and Gordon, 2001), leverage has been found to have a negative relationship with performance disclosures. Reaction to performance disclosures might generally be expected to be positive. However, for firms in poor financial condition such disclosures may emphasize the firms’ poor performance overwhelming the potentially positive benefits of increased disclosures.
3.3.3. Contextual variables
Analyst following. A firm’s analyst following is used as a proxy for the level of other disclosures and the extent of a firm’s communication with financial analysts (Leuz, 2003). We expect a positive relationship between analyst following and performance disclosures.
Media exposure. Performance disclosure also can be perceived as a response to pressures exerted by various stakeholders or constituencies, with corporate managers attempting to manage public impressions with respect to performance. In this study, a firm’s media exposure is computed by taking the number of articles in the year 2003, as contained in the ABI Disclosure database. We expect a positive relationship between media exposure and performance disclosure. In addition as a form of sensitivity analysis, we test whether the relationship is direct or if it is moderated by the perceived stakeholder importance.
Industry membership. Sample firms are grouped according to the S&P 500 classification (eight industries). Dummy variables are used to control for industry effects.
Corporate strategic focus. An organization’s strategic posture addresses a set of elements that describe how the organization has aligned its resources in response to its internal and external environments to accomplish its goals and objectives (Porter, 1991). Highlighted in our model is the relationship seen by executives between potential stakeholders and the corporate strategic focus. Although other potential variables may have an influence, it is this relationship between stakeholders and strategic focus that results in the types of disclosure actually made on the corporate websites.
4. EMPIRICAL RESULTS
Our sample of 56 North American and European multinational firms is drawn from seven broadly defined industries (S&P classification): Consumer goods and services (13 firms), Materials (resources) (16 firms), Energy (3 firms), Industrials (5 firms), Chemicals and Drugs (4 firms), Utilities (5 firms), Information technology (4 firms) and Telecom and Media (6 firms).
Table 2 provides descriptive statistics for firm size (Total Assets in millions of Euros), profitability (ROA), leverage (total debt/total assets), analyst following, media exposure and corporate strategic focus. With the exception of corporate strategic focus, these variables were gathered from the company web sites or from publicly available sources. The sample firms may be characterized as large (mean asset size: 10,715 million Euros), profitable (mean ROA: .0004), with a low debt-to-equity ratio (mean: 0.62). These companies receive much attention by both analysts (mean analyst following: 12.98) and the media (mean number of articles: 11.86). Additionally, the strategic focus of these companies tends to be one of cost efficiency while emphasizing having different products (or services) necessary to cater to different customers.
Minimum Maximum Mean Std. Deviation Total assets in million Euros 26.7 176 596 10 715 28 726 Profitability (ROA) -0.45 0.11 0.004 0.08 Leverage (total debt/total assets) 0.11 1.29 0.62 0.20
Analyst following 0* 45 12.98 10.12
Media exposure 0 122 11.86 23.15
Corporate strategic focus (0 to 5 scale)
Cost efficiency 3 5 4.64 0.58
Different types products/clients 0 5 3.48 1.70 N: 56
*Only one firm has no analyst following (Saskatchewan Wheat Pool, a cooperative). Table 2. Descriptive statistics
As noted, our questionnaire asked respondents to address 30 statements. The number of statements was relatively large in order to accommodate the inclusion of a diverse group of industry classifications. However, for purposes of analysis the questions have been collapsed into seven categories. These broadly defined categories are labeled as Financial Performance, Corporate Governance, Value for Clients, Human/Intellectual Capital, Production Efficiency, Innovation/ Development and Growth, and Social Responsibility. The disclosure score that appears after each web-based disclosure was calculated by using the performance content coding. These categories as well as the number of questionnaire items included in each category are provided in Table 3.
Web-based Disclosure score Number of items per category Internal consistency estimate Cronbach alpha (0.74)
Shareholders CreditorsLenders/ Customers Government Suppliers Employees Regulators Public
Financial performance 11.25 2 0.86 3.774.71 2.884.19 1.552.77 2.020.94 1.522.85 2.053.00 1.392.97 1.572.77 Corporate Governance 20.54 5 0.89 3.384.57 2.003.62 1.462.73 2.631.04 1.012.45 1.823.14 1.903.50 1.742.92
Value for clients
13.95 5 0.94 1.51 3.15 0.98 2.55 2.21 4.37 0.73 2.45 1.30 2.96 1.45 3.03 0.77 2.46 1.35 3.06 Human / Intellectual Capital 9.64 3 0.93 1.02 3.05 0.58 2.50 0.84 2.97 0.56 2.67 0.52 2.26 1.53 3.88 0.61 2.77 1.18 3.25 Production Efficiency 5.23 4 0.95 1.633.98 1.093.08 1.273.80 2.770.70 0.872.82 1.243.44 0.793.02 1.083.00 Innovation / Development and Growth 5.64 3 0.94 2.434.08 1.503.29 2.134.00 2.930.97 1.393.14 1.853.53 0.892.52 1.633.16 Social Respon-sibility 10.09 7 0.96 1.70 3.31 1.513.11 1.623.51 3.501.55 1.192.99 1.653.84 1.473.39 1.913.75
Table 3. Executive assessment of stakeholders’ interests in disclosure on the website Mean scores / Mean score for non-zero responses (0 to 5 scale)
Two means are provided for each disclosure category. The first line of means for each category was calculated by scaling the web-based disclosure scores by the number of items included in each category. This mean includes all 56 responses and as such includes managers who assigned a zero to a stakeholder group as well as those who assigned numbers greater than zero. The second line of means is calculated dropping managers who did not find the disclosure items to be aimed at a particular stakeholder group (zero ratings).
As might be expected, shareholders are found to be important stakeholders for most disclosure categories with other stakeholders viewed as important for only a few categories. For instance, the sample executives thought the Public was the most important stakeholder with respect to social responsibility disclosures but the Public was not thought to be very important (compared to shareholders and lenders/creditors) in relation to financial performance disclosures.
To check on the consistency of our results in Table 3, we use Cronbach’s alpha to estimate the proportion of the variance in the mean scores that may be attributed to the “true” score’s variance. The range of this statistic is from 0.86 to 0.96 indicating the sample means are quite reliable.
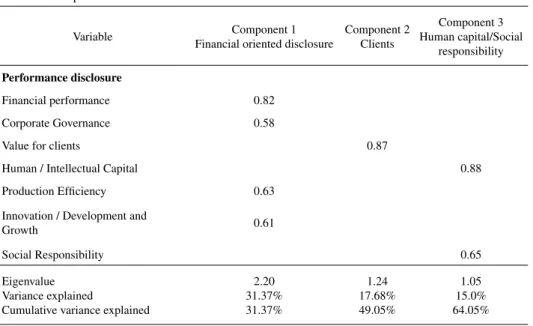
For Table 4 we employ principal components factor analysis with Varimax rotation for two reasons. First, this procedure allows us to examine the relationships among the performance disclosure variables and second, it allows data reduction which is important given our sample size (n = 56 companies). Using a cut-off of .50 for inclusion of variables in the factors, we find three factor components that cumulatively explain 64 per cent of the overall variance. These three components are named Financial oriented disclosure, Clients, and Human capital/Social responsibility and are shown in Table 4, Panel A.
In a second factor analysis presented in Panel B of Table 4, we add industry dummies since some performance disclosure components are industry-specific. Results show four profiles: Financial oriented disclosure, Clients/Technology, Innovation/Chemicals and drugs, and Human capital/Social responsibility.
This second factor analysis reveals several findings of interest. First, companies essentially publishing financial oriented information are not concentrated in any particular industry. Second, firms emphasizing the value of client disclosure are concentrated in the technology industry, while chemical and drug firms stress innovation disclosure. Finally, there seems to be a separate profile for firms sensitive to social/human capital.
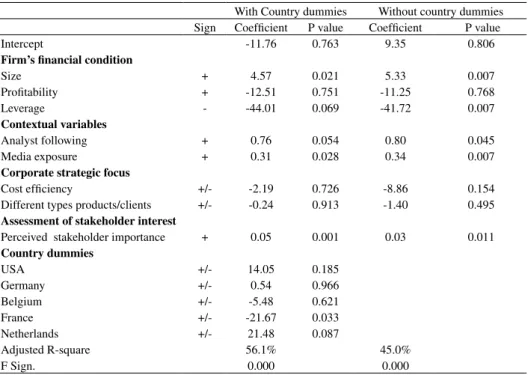
Table 5 presents two variations of two OLS regressions. Both panels examine the relationship between Total Performance Disclosure with respect to companies’ specific characteristics, strategic focus and assessment of stakeholder focus. Also each panel contains the results of the regression with, and without, country dummy variables. The difference between Panels A and B is the number of disclosure components included in the dependent variable. The regression in Panel A includes all seven web-based disclosure component scores while Panel B excludes the score for Value for Clients due to multicollinearity. Overall, what Table 5 indicates is the existence of a significant positive relationship between stakeholder focus and total performance disclosures even after we control for the firm specific characteristics
(adjusted R-squares 45% and 43.8%, F significance .000 for both regressions). We drop further analyses using country dummies because of the weak impact of these variables.
Panel A: Firm-specific factors
Variable Component 1 Financial oriented disclosure
Component 2 Clients Component 3 Human capital/Social responsibility Performance disclosure Financial performance 0.82 Corporate Governance 0.58
Value for clients 0.87
Human / Intellectual Capital 0.88
Production Efficiency 0.63 Innovation / Development and
Growth 0.61
Social Responsibility 0.65
Eigenvalue Variance explained
Cumulative variance explained
2.20 31.37% 31.37% 1.24 17.68% 49.05% 1.05 15.0% 64.05%
Panel B: Firm-specific factors with industries
Variable Component 1 Financial oriented disclosure Component 2 Clients/ Technology Component 3 Innovation/ Chemicals And drugs Component 4 Human capital/Social responsibility Performance disclosure Financial performance 0.83 Corporate Governance 0.66
Value for clients 0.79
Human / Intellectual Capital 0.86
Production Efficiency 0.58
Innovation / Development and Growth 0.68
Social Responsibility 0.62
Industry
Chemicals and Drugs 0.90
Technology 0.82
Eigenvalue Variance explained
Cumulative variance explained
2.20 24.66% 24.66% 1.61 17.88% 42.54% 1.26 14.02% 56.56% 1.07 11.86% 68.42% Table 4. Principal components factor analysis Varimax rotated component matrix (correlations > 0.50)
Panel A: Dependent Variable: Total score of seven disclosure components
With Country dummies Without country dummies Sign Coefficient P value Coefficient P value
Intercept -11.76 0.763 9.35 0.806
Firm’s financial condition
Size + 4.57 0.021 5.33 0.007 Profitability + -12.51 0.751 -11.25 0.768 Leverage - -44.01 0.069 -41.72 0.007 Contextual variables Analyst following + 0.76 0.054 0.80 0.045 Media exposure + 0.31 0.028 0.34 0.007
Corporate strategic focus
Cost efficiency +/- -2.19 0.726 -8.86 0.154 Different types products/clients +/- -0.24 0.913 -1.40 0.495
Assessment of stakeholder interest
Perceived stakeholder importance + 0.05 0.001 0.03 0.011
Country dummies USA +/- 14.05 0.185 Germany +/- 0.54 0.966 Belgium +/- -5.48 0.621 France +/- -21.67 0.033 Netherlands +/- 21.48 0.087 Adjusted R-square 56.1% 45.0% F Sign. 0.000 0.000
Panel B: Dependent Variable: Total score of six disclosure components
With Country dummies Without country dummies Sign Coefficient P value Coefficient P value
Intercept -6.82 0.871 -1.32 0.973
Firm’s financial condition
Size + 3.76 0.045 4.88 0.009 Profitability + -5.99 0.877 -19.26 0.589 Leverage - -39.12 0.004 -32.66 0.012 Contextual variables Analyst following + 0.66 0.120 0.51 0.068 Media exposure + 0.36 0.009 0.34 0.003
Corporate strategic focus
Cost efficiency +/- -3.09 0.551 -8.64 0.079 Different types products/clients +/- -1.91 0.346 -2.59 0.172
Assessment of stakeholder interest
Shareholders + 0.22 0.054 0.20 0.068 Government + 0.25 0.064 0.19 0.092 Country dummies USA +/- 2.06 0.825 Germany +/- 7.64 0.521 Belgium +/- -6.26 0.571 France +/- -14.57 0.142 Netherlands +/- 22.36 0.051 Adjusted R-square 51.4% 43.8% F Sign. 0.000 0.000
Sensitivity analyses were used to examine the Table 5 results. To check whether there is some consistency in web-based performance disclosure between time periods, Performance disclosure was lagged. No significant relationship between disclosures over time was found. A dummy variable for “continent” was included to check for differences between North American and Continental European disclosures but was not significant. The total stakeholder focus variable was dropped and replaced with the ratio of focus on financial stakeholders (shareholders plus creditors) to focus on total stakeholders. Again, this change did not produce significant results indicating that disclosure is not driven by any one group of stakeholders. This finding is consistent with the high correlations found between each stakeholder group. Additionally, utilities (5 observations) were dropped from the regression to ensure these highly regulated firms were not influencing the findings. The results did not change significantly. While most of the variables’ signs are as predicted, there is one notable exception. The expectation was that profitability would be positively related to total performance disclosure but the coefficient is negative in both Panels A and B. However, in these regressions, profitability was not significant (F statistics p value < 0.768; and p value < 0.589).
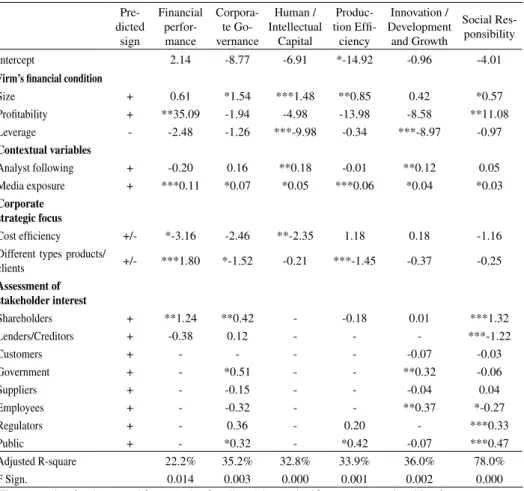
While Table 5 provides an examination of a company’s total disclosure strategy, it is unlikely that all stakeholder groups have an interest or an effect on all components of corporate disclosure. Hence, we also analyze the determinants of the different components of corporate disclosure. To obtain a parsimonious set of regression analyses, we first perform correlation analyses between variables that proxy for the interests of specific stakeholder groups and performance disclosure components. For each disclosure component regression, we only retain as independent variables those stakeholders’ interests that are significantly correlated (p < 0.10). Table 6 provides OLS regression analyses for each of the seven disclosure categories. These regressions provide a method of examining the relationship between the categories (dependent variable), the firm specific characteristics, the corporate strategic focus and managers’ assessment of the stakeholders’ interests. With three exceptions, all of the independent variables are expected to have a positive relationship with the dependent variables. The exceptions are leverage, cost efficiency and different types of products/clients. Leverage is expected to have a negative relationship with the disclosure categories. This is because the more debt a company owes, the more likely it is to meet only the minimum disclosure
requirements. With respect to the two strategic corporate variables, the relationship with the seven disclosure categories may be either positive or negative depending on the category. For example, we expect that Cost efficiency will be positively related to Production efficiency. However, Cost efficiency is more likely to be negatively related to Social Responsibility.
Pre-dicted sign Financial perfor-mance Corpora-te Go-vernance Human / Intellectual Capital Produc-tion Effi-ciency Innovation / Development and Growth Social Res-ponsibility Intercept 2.14 -8.77 -6.91 *-14.92 -0.96 -4.01
Firm’s financial condition
Size + 0.61 *1.54 ***1.48 **0.85 0.42 *0.57 Profitability + **35.09 -1.94 -4.98 -13.98 -8.58 **11.08 Leverage - -2.48 -1.26 ***-9.98 -0.34 ***-8.97 -0.97 Contextual variables Analyst following + -0.20 0.16 **0.18 -0.01 **0.12 0.05 Media exposure + ***0.11 *0.07 *0.05 ***0.06 *0.04 *0.03 Corporate strategic focus Cost efficiency +/- *-3.16 -2.46 **-2.35 1.18 0.18 -1.16 Different types products/
clients +/- ***1.80 *-1.52 -0.21 ***-1.45 -0.37 -0.25 Assessment of stakeholder interest Shareholders + **1.24 **0.42 - -0.18 0.01 ***1.32 Lenders/Creditors + -0.38 0.12 - - - ***-1.22 Customers + - - - - -0.07 -0.03 Government + - *0.51 - - **0.32 -0.06 Suppliers + - -0.15 - - -0.04 0.04 Employees + - -0.32 - - **0.37 *-0.27 Regulators + - 0.36 - 0.20 - ***0.33 Public + - *0.32 - *0.42 -0.07 ***0.47 Adjusted R-square 22.2% 35.2% 32.8% 33.9% 36.0% 78.0% F Sign. 0.014 0.003 0.000 0.001 0.002 0.000 +The regression for the second factor (value for clients) is not significant at conventional levels.
Table 6. OLS Regressions+ on the Determinants of Web-Based Performance Disclosure
The disclosures concerned with Financial Performance are significantly related to the company’s profitability (p value < 0.05), media exposure (p value < 0.01), cost efficiency (p value < 0.10), different types of products/clients (p value < 0.01), and shareholders (p value < 0.05). The interpretation of this finding is that shareholders are the only group management sees as important when making Financial Performance disclosures although this type of disclosure is moderated by the company’s strategic focus, its profitability and media exposure.
Corporate Governance disclosures are primarily aimed at shareholders (p value <0.05) and to a lesser extent at the government and public (p values < 0.10). These disclosures are positively related to the company’s size (p values < 0.10), media exposure (p values < 0.10) and negatively related to the company’s strategic focus of providing different products for different clients (p values < 0.10).
Human and Intellectual Capital disclosures are unrelated to stakeholder concerns. Instead, this variable is significantly related only to the firm’s specific characteristics and the cost efficiency strategic focus.
Production Efficiency is significantly related to company size, media exposure and the strategic focus of provision of different types of products for different clients. This latter variable is negatively related because it is more difficult to attain production efficiency when a company is supplying a variety of products to a variety of customers. Interestingly, the only stakeholder group found to be weakly significant was the public (p value < 0.10).
Innovation/Development and Growth is significantly related to two stakeholder groups, government and employees (both with p value < 0.05). One financial variable, leverage (p value < 0.01), and two other variables, analyst following (p value < 0.05) and media exposure (p value < 0.10), also are related to Innovation/ Development and Growth.
Stakeholder concerns are found to be more related to Social Responsibility disclosures than the other five disclosures examined in Table 6. Five stakeholder groups are significantly related to Social Responsibility disclosures with four of these (shareholders, lenders/creditors, regulators and the public) at the p value < 0.01. Additionally, three other variables are related to these disclosures (size, profitability and media exposure).
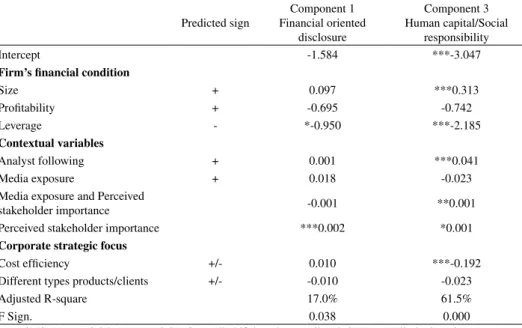
Finally, to test whether there is a moderating effect between managers’ perceived stakeholder importance and media exposure, we add an interaction term in two separate regressions based on the component disclosure factors identified in our factor analysis (Table 4, Panel A). Results presented in Table 7 suggest that media exposure has a moderating effect on the impact of perceived stakeholder importance in the decision to disclose Human capital/Social responsibility information on websites. The effect of perceived stakeholder importance on this
kind of disclosure is significantly strengthened when a firm is subject to higher levels of media exposure, suggesting that disclosure policy regarding Human capital/Social responsibility information is sensitive to impression management concerns induced by public pressures. However, the absence of significant interaction between media exposure and perceived importance of stakeholder concerns on other types of web-based performance disclosures reinforces the idea that the disclosure dimensions revealed by the factor analysis reflect disclosure domains driven by different communication logics. The direct effect of stakeholder focus on financial-oriented disclosure and the absence of interaction with media exposure suggest that this type of information is mainly generic in nature, and is not affected by impression management concerns. This finding suggests that when a firm is committed to consideration of stakeholder concerns in its web disclosure strategy, the primary effect is disclosure that could be seen as more generic in nature (e.g., financial oriented disclosure) since most of this information is available from other sources. However, the story is different for human capital/social responsibility information, which is not driven by a general sensitivity to stakeholder concerns. Instead human capital/social responsibility disclosure seems to be more the product of impression management that is focused on balancing of disclosure content, and the relative perceived power and impact of specific stakeholder groups.
Dependent Variable: Disclosure factors scores
Predicted sign Component 1 Financial oriented disclosure Component 3 Human capital/Social responsibility Intercept -1.584 ***-3.047
Firm’s financial condition
Size + 0.097 ***0.313 Profitability + -0.695 -0.742 Leverage - *-0.950 ***-2.185 Contextual variables Analyst following + 0.001 ***0.041 Media exposure + 0.018 -0.023
Media exposure and Perceived
stakeholder importance -0.001 **0.001 Perceived stakeholder importance ***0.002 *0.001
Corporate strategic focus
Cost efficiency +/- 0.010 ***-0.192
Different types products/clients +/- -0.010 -0.023
Adjusted R-square 17.0% 61.5%
F Sign. 0.038 0.000
*: p < 0.10; **: p < 0.05; ***: p < 0.01. One-tailed if there is a predicted sign, two-tailed otherwise. Coefficients for industry dummies are not presented.
5. DISCUSSION, CONCLUSION, LIMITATIONS AND
FUTURE RESEARCH
5.. Discussion
Using our model outlined in Figure 1, our findings provide evidence that the eight identified stakeholder groups are thought to be important by executives with respect to one or more corporate website disclosures. As shown in Table 3 executives indicated they perceived shareholders to be one of the important stakeholder groups for all seven types of disclosure, while other stakeholder groups were seen less often as disclosure targets. For example, customers were the primary targets of only value for client disclosures and suppliers were not the primary targets for any of the seven disclosures. This finding is supported by the differential emphasis placed on stakeholders in different settings by Henriques and Sadorsky (1999) and Harvey and Schaefer (2001).
The findings in Table 3 are tempered somewhat when we include the financial and contextual variables. For example from Table 6, shareholders are significant stakeholders with respect to financial performance, corporate governance and social responsibility disclosures. These stakeholder findings are moderated by the fact that in all three cases media exposure is also significant along with at least one financial variable (e.g., size and/or profitability). Our model is supported by the evidence provided in Table 6 since web-based disclosures are influenced by more than executives’ perceptions of the importance of various stakeholders, also a finding of Cormier et al. (2004).
Further examination of our results offers interesting insights into the web-based disclosures of our sample. First, media exposure is found to moderate all six types of disclosures we examined in Table 6. Our finding is consistent with others’ findings for this variable (e.g., Cormier and Magnan, 2004). What this tells us is that a relationship exists between the amount of media attention a company receives and the types of disclosures made on its websites. Our finding is supported by Ader’s (1995) and Brown and Deegan’s (1998) results that community concerns increase as media coverage increases. From a common sense perspective, we note that when an individual is being watched, that individual is more likely to do “the right (or expected) thing.” This perspective also seems to apply to large corporations
where their disclosures are publicly displayed on their websites and they know the media is watching them.
Moreover from Table 7, media exposure is seen to have a moderating effect on the impact of perceived stakeholder importance in the decision to disclose social/human capital information on websites. Stakeholder interest only affects this kind of disclosure when a firm is subject to media exposure, suggesting an impression management behavior. This finding is not surprising when we refer back to the Table 6 Social responsibility disclosure regression. This regression indicates that five stakeholder groups significantly affect disclosure and do so in opposite directions (e.g. the more leverage, the less disclosure and the more public pressures, the more disclosure).
As a proxy for the goal relevance of impression management (Leary and Kowalski, 1990), media exposure reinforces the effect of the perception of stakeholder importance on specific types of disclosure. Our findings suggest that media exposure provides publicity and visibility incentives necessary for encouraging human capital and social disclosure but not other more generic types of disclosure. These publicity and visibility incentives also hint at the public relations character of many human capital/social disclosures made by companies.
Large organizations are more likely to provide information on their websites that deal with human/intellectual capital, production efficiency, corporate governance and social responsibility. While our evidence is that no one stakeholder group was significantly important with respect to the human/intellectual capital disclosures, the public was found to be a significant stakeholder for the other three types of disclosures with regulators also a significant stakeholder group for social responsibility disclosures.
Profitable organizations are most likely to supply information on financial performance and social responsibility, a finding echoed in Bodkin and Perry’s (2004) results. For financial performance, this fits with the shareholders being seen as significant by the executives and in turn, those executives addressing the question that most shareholders want answered. With respect to social responsibility, all but three stakeholders (customers, government and suppliers) were perceived to be important by the responding executives. For shareholders, regulators and the
public, social disclosures were positive and significantly related. We interpret this to mean that the executives perceived these groups as wanting profitable companies to contribute to their communities to maintain their social legitimacy. However, for lenders/creditors and employees, their relationship with social disclosures was negative. One explanation of this finding is executives think these groups would rather see the company maintain its viability and longevity rather than contribute to the broader society. Thus the criteria of legitimacy for creditors/lenders and employees are preservation of the company and meeting the company’s debt payments while safeguarding jobs. If true, legitimacy of a corporate entity to lenders/creditors and employees is based on different criteria than legitimacy with respect to the shareholders, the public and regulators.
Leverage and analyst following are found to be important explanatory variables for two types of disclosures, human/intellectual capital and innovation/development and growth. For both types of disclosures, the signs of the coefficients are as predicted. With respect to leverage the more debt a company has, the less likely it is to make these disclosures. This finding makes sense because a company that carries a large amount of debt is less likely to have the funds to put into either its human/intellectual capital or into innovative or developmental initiatives. These companies would also likely attract a significant analyst following suggesting disclosure about human/intellectual capital or innovation/development contains more finely grained information components than traditional annual reports.
While we found no stakeholder groups significantly related to the human/ intellectual capital disclosures for our sample, government and employees were significant stakeholders with respect to innovation/development and growth. Both of these groups are interested in the survival and growth of companies. Without innovation and development, the general economy may be at risk providing a reason for why executives would perceive government as an important stakeholder for these disclosures. Employees want to know whether their jobs will continue into the future and information about innovation and growth of their employers provides a reason for their interest in these disclosures.
Corporate strategic focus was found as a significant variable for four of the six disclosures. Cost efficiency was important with respect to financial performance and human/intellectual capital disclosures. In both instances, the relationship
with these disclosures is negative. These negative relationships may be due to executives seeing a need to preserve competitive advantage in one instance and the incompatibility of objectives in the other. If a company provides financial performance information along with its strategic focus of cost efficiency, then executives may perceive they are providing too much information to competitors. With respect to a company that supplies information about its development of human and intellectual capital, cost efficiency may be an incompatible goal. Such executives may perceive that stakeholders see the strategic goal of cost efficiency as incompatible with spending on human/intellectual capital.
The strategic focus of providing different types of products for different clients was significantly related to three website disclosures: financial performance, corporate governance and production efficiency. Financial performance disclosures were positively related to this strategic focus. Here we think that the strategic focus on providing what customers need enhances the company’s ability to earn revenues and to maintain profitability into the future thus providing important information to shareholders. With respect to corporate governance and production efficiency, the relationships are negative. In terms of production efficiency disclosures, the more varied the types of products and clients, the more it will cost and the longer it will take to produce the products. Thus, this negative relationship between efficiency and strategic focus makes sense. The negative relationship between this strategic focus and corporate governance is somewhat more difficult to explain. The executives in this sample may perceive that the more varied the products produced and clients served, the more complex is the company. From this perspective, organizational complexity may make it more difficult to provide meaningful corporate governance disclosures on websites.
One finding from Table 6 is difficult to explain. Neither customers nor suppliers were found to be significant stakeholders for the six types of website disclosures. Their lack of significance may be due to the perception of the sampled executives that there are better ways to communicate to these stakeholders than use of corporate websites. Alternatively, it may be due to the limitations of the sample.
5.2. Conclusion, limitations and future research
In this study, we have explored the relationship between executives’ perceptions of stakeholders’ importance and the types of performance related disclosures corporations make. Our contributions include our focus on the website disclosures made by a sample of executives and their perceptions of the importance of eight stakeholder groups. Additionally, we have expanded and advanced the research dialogue by incorporating the strategic disclosure focus of the executives with financial and contextual variables as well as a broader set of performance disclosures beyond environmental disclosures (Cormier et al., 2004).
Our model and sample serve as an illustration that executives’ perceptions of stakeholders’ importance affect the types of web-based disclosures made. As well, strategic focus, media, size of organization, profitability, leverage and analyst following are influential in explaining the types of disclosures supplied by companies on their websites. Finally, our illustration indicates that different types of disclosures are aimed primarily at different stakeholders.
The primary limitation of our study is our sample size. While international in scope, the small sample size does not lend itself to making meaningful international comparisons. However, our study is exploratory in nature and its limitations provide opportunities to other researchers.
Future research could collect and use a larger sample to verify, add to, or question our results. Alternatively, a research method other than questionnaire data might be used to examine the same types of questions. One such possible research method would be to use content analysis of specific web-based disclosures looking for mentions of key stakeholders and identifying the strategic focus inherent in these disclosures.
6. REFERENCES
ADER, C. (1995): “A Longitudinal Study of Agenda Setting for the Issue of Environmental Pollution”, Journalism & Mass Communication Quarterly, vol. 72, n. 2: 300-311.
AERTS, W.; CORMIER, D.; MAGNAN, M. (2004): “Performance Disclosure Transparency by Continental European and North American Firms: Determinants and Analysts’ Relevance”. Paper presented at the 25th Annual European Accounting Association Congress. Prague.
AGLE, B.R.; MITCHELL, R.K.; SONNENFELD, J.A. (1999): “Who Matters to CEOs? An Investigation of Stakeholder Attributes and Salience, Corporate Performance, and CEO Values”, Academy of Management Journal, vol. 42, n. 5: 507-525.
ASHBAUGH, H.; JOHNSTONE, K.M.; WARFIELD, T.D. (1999): “Corporate Reporting on the Internet”, Accounting Horizons, vol. 13, n. 3: 241-257.
ATIASE, R. (1985): “Predisclosure Information, Firm Capitalization, and Security Price Behavior around Earnings Announcements”, Journal of Accounting Research, vol. 23, n. 1: 21-36.
BODKIN, C.D.; PERRY, M. (2004): “Good Retailers and Service Providers: Comparative Analysis of Web Site Marketing Communications”, Journal of Retailing and Consumer Services, vol. 11, n. 1: 19-29.
BOTOSAN, C.A. (1997): “Disclosure Level and the Cost of Equity Capital”,
Accounting Review, vol. 72, n. 3: 323-350.
BOWEN, R.M.; DUCHARME, L.; SHORES, D. (1995): “Stakeholders Implicit Claims and Accounting Method Choice”, Journal of Accounting and Economics, vol. 20, n. 3: 255-295.
BROWN, N.; DEEGAN, C. (1998): “The Public Disclosure of Environmental Performance Information – A Dual Test of Media Agenda Setting Theory and Legitimacy Theory”, Accounting and Business Research, vol. 29, n. 1: 21-41. BUHR, N. (1998): “Environmental Performance, Legislation and Annual report Disclosure: The Case of Acid Rain and Falconbridge”, Accounting, Auditing and Accountability Journal, vol. 11, n. 2: 163-190.
CLARKSON, P.; KAO, J.L.; RICHARDSON, G.D. (1994): “The Voluntary Inclusion of Forecasts in the MD&A Section of Annual Reports”, Contemporary Accounting Research, vol. 11-2, n. 1: 423-450.
COCHRAN, P.; WOOD, R. (1984): “Corporate Social Responsibility and Financial Performance”, Academy of Management Journal, vol. 27, n. 1: 42-56.
CORMIER, D.; GORDON, I.M. (2001): “An Examination of Social and Environmental Reporting Strategies”, Accounting, Auditing, and Accountability Journal, vol. 14, n. 5: 587-616.
CORMIER, D.; GORDON, I.M.; MAGNAN, M. (2004): “Corporate Environmental Disclosure: Contrasting Management’s Perceptions with Reality”, Journal of Business Ethics, vol. 49, n. 2-II: 143-165.
CORMIER, D.; MAGNAN, M. (1999): “Corporate Environmental Disclosure Strategies: Determinants, Costs and Benefits”, Journal of Accounting, Auditing and Finance, vol. 14, n. 4: 429-451.
CORMIER, D.; MAGNAN, M. (2003): “Environmental Reporting Management: A European Perspective”, Journal of Accounting and Public Policy, vol. 22, n. 1: 43-62.
CORMIER, D.; MAGNAN, M. (2004): “The Impact of the Web on Information and Communication Modes: The Case of Corporate Environmental Disclosure”,
Journal of Technology Management, vol. 27, n. 4: 393-416.
DEBRECENY, R.; GRAY, G.L.; RASHMAN, A. (2002) “The Determinants of Internet Financial Reporting”, Journal of Accounting Public Policy, vol. 21, n. 4/5: 371-394.
DEEGAN, C.; RANKIN, M. (1996): “A Study of the Environmental Disclosure Practices of Australian Corporations”, Accounting and Business Research, vol. 26, n. 3: 187-199.
ESROCK, S.L.; LEICHTY, G.B. (1998): “Social Responsibility and Corporate Web Pages: Self-presentation or Agenda Setting?” Public Relations Review, vol. 24, n. 3: 305-319.
ESROCK, S.L.; LEICHTY, G.B. (1999): “Corporate World Wide Web Pages: Serving the News Media and Other Publics”, Journalism & Mass Communication Quarterly, vol. 76, n. 3: 456-467.
ESROCK, S.L.; LEICHTY, G.B. (2000): “Organization of Corporate Web Pages: Publics and Functions”, Public Relations Review, vol. 26, n. 3: 327-344.
EVAN, W.F.; FREEMAN, R.E. (1993): “A Stakeholder Theory of the Modern Corporation: Kantian Capitalism”. In T. Beauchamp, N. Bowie, eds., Ethical Theory and Business. Prentice-Hall, Englewood Cliffs, NJ: 75-84.
FRANKEL, R.; JOHNSON, M.; SKINNER, D.J. (1999): “An Empirical Examination of Conference Calls as a Voluntary Disclosure Medium”, Journal of Accounting Research, vol. 37, n. 1: 133-150.
FREEMAN, R.E. (1984): Strategic Management: A Stakeholder Approach. Pitman, Boston, MA.
GALLAGHER, K.; FOSTER, J.; PARSONS, K.D. (2001a): “The Medium Is not the Message: Advertising Effectiveness and Content Evaluation in Print and on the Web”, Journal of Advertising Research, vol. 41, n. 4: 57-70.
GALLAGHER, K.; PARSONS, K.D.; FOSTER, J. (2001b): “A Tale of Two Studies: Replicating ‘Advertising Effectiveness and Content Evaluation in Print and on the Web’ ”, Journal of Advertising Research, vol. 41, n. 4: 71-81.
GIBBINS, M.; RICHARDSON, A.; WATERHOUSE, J. (1990): “The Management of Corporate Financial Disclosures: Opportunism, Ritualism, Policies, and Processes”, Journal of Accounting Research, vol. 28, n. 1: 121-143.
GUTHRIE, J.; PARKER, L.D. (1989): „Corporate Social Reporting: A Rebuttal of Legitimacy Theory”, Accounting and Business Research, vol. 19, n. 76: 343-352.
HARRISON, J.S.; FREEMAN, R.E. (1999): “Stakeholders, Social Responsibility, and Performance: Empirical Evidence and Theoretical Perspective”, Academy of Management Journal, vol. 42, n. 5: 479-487.
HARVEY, B.; SCHAEFER, A. (2001): “Managing Relationships with Environmental Stakeholders: A Study of U.K. Water and Electricity Utilities”,
HEALY, P.; HUTTON, A.P.; PALEPU, K.G. (1999): “Stock Performance and Intermediation Changes Surrounding Sustained Increases in Disclosure”,
Contemporary Accounting Research, vol. 16, n. 3: 485-520.
HENRIQUES, I.; SADORSKY, P. (1999): “The Relationship between Environmental Commitment and Managerial Perceptions of Stakeholder Importance”, Academy of Management Journal, vol. 42, n. 1: 87-99.
ITTNER, C.; LARCKER, D. (1998): “Innovations in Performance Measurement: Trends and Research Implications”, Journal of Management Accounting Research, vol. 10: 205-238.
KAPLAN, R.S.; NORTON, D.P. (1996): The Balanced Scorecard: Translating Strategy into Actions. Harvard Business School Press, Boston, MA.
KARPOFF, J.; LOTT, J.R. (1993): “The Reputational Penalty Firms Bear from Committing Criminal Fraud”, Journal of Law and Economics, vol. 36, n. 2: 757-803.
KENT, M.L.; TAYLOR, M.; WHITE, W.J. (2003): “The Relationship between Web Site Design and Organizational Responsiveness to Stakeholders”, Public Relations Review, vol. 29, n. 1: 63-77.
KENT, M.L.; TAYLOR, M.; WHITE, W.J. (2001): “How Activist Organizations Are Using the Internet to Build Relationships”, Public Relations Review, vol. 27, n. 3: 263-284.
LANG, M.; LUNDHOLM, R. (1993): “Cross-Sectional Determinants Of Analyst Ratings Of Corporate Disclosures”, Journal of Accounting Research, vol. 31, n. 2: 246-271.
LEIGHTON, D.S.R.; THAIN, D.H. (1997): Making Boards Work. McGraw-Hill Ryerson, Toronto, ON.
LERNER, L.D.; FRYXELL, G.E. (1994): “CEO Stakeholder Attitudes and Corporate Social Activity in the Fortune 500”, Business and Society, vol. 33, n. 1: 58-81.
LEUZ, C. (2003): “IAS versus U.S.GAAP: Information Asymmetry-Based Evidence from Germany’s New Market”, Journal of Accounting Research, vol. 41, n. 3: 445-472.
LEUZ, C.; VERRECCHIA, R. (2000): “The Economic Consequences of Increased Disclosure”, Journal of Accounting Research, vol. 38, supplement: 91-124. LEV, B. (1992): “Information Disclosure Strategy”, California Management Review, vol. 34, n. 4: 9-32.
LOUWERS, T.J.; PASEWARK, W.R.; TYPPO, E.W. (1996): “The Internet: Changing the Way Corporations Tell Their Story”, CPA Journal, vol. 66, n. 11: 24-28.
MARSTON, C.L.; POLEI, A. (2004): “Corporate Reporting on the Internet by German Companies“, International Journal of Accounting and Information Systems, vol. 5, n. 3: 285-311.
MCGUIRE, J.B.; SUNDGREN, A.; SCHNEEWEIS, T. (1988): “Corporate Social Responsibility and Firm Performance”, Academy of Management Journal, vol. 31, n. 4: 854-872.
MILGROM, P.R. (1981): “Good News and Bad News: Representation Theorems and Applications”, Bell Journal of Economics, vol. 12, n. 2: 380-391.
MILLS, D.; GARDNER, M. (1984): “Financial Profiles and the Disclosure of Expenditures for Socially Responsible Purposes”, Journal of Business Research, vol. 12, n. 4: 407-424.
NEU, D.; WARSAME, H.; PEDWELL, K. (1998): “Managing Public Impressions: Environmental Disclosures in Annual Reports”, Accounting, Organizations and Society, vol. 23, n. 3: 265-282.
NUNNALLY, J.C. (1978): Psychometric Theory. 2nd end Edition, McGraw Hill, New York.
OGDEN, S.; WATSON, R. (1999): “Corporate Performance and Stakeholder Management: Balancing Shareholder and Customer Interests in the U.K. Privatized Water Industry”, Academy of Management Journal, vol. 42, n. 5: 526-538.
PERRY, M.; BODKIN, C.D. (2002): “Fortune 500 Manufacturing Web Sites: Innovative Marketing Strategies or Cyberbrochures?” Industrial Marketing Management, vol. 31, n. 2: 133-144.
PIRCHEGGER, B.; WAGENHOFER, A. (1999): “Financial Information on the Internet: A Survey of the Homepages of Austrian Companies”, European Accounting Review, vol. 8, n. 2: 383-395.
PORTER, M.E. (1991): “Towards a Dynamic Theory of Strategy”, Strategic Management Journal, vol. 12, n. 8: 95-117.
RICHARDSON, A.J.; WELKER, M. (2001): “Social Disclosure, Financial Disclosure and the Cost of Equity Capital”, Accounting, Organizations and Society, vol. 26, n. 7: 597-616.
ROBB, S.W.G.; SINGLE, L.E., ZARZESKI, M.T. (2001): “Nonfinancial Disclosures across Anglo-American Countries”, Journal of International Accounting, Auditing and Taxation, vol. 10, n. 1: 71-83.
ROBERTS, R.W. (1992): “Determinants of Corporate Social Responsibility Disclosure: An Application of Stakeholder Theory”, Accounting, Organizations and Society, vol. 17, n. 6: 595-612.
RUF, B.M.; MURALIDHAR, K.; BROWN, R.M.; JANNEY, J.J.; PAUL, K. (2001): “An Empirical Investigation of the Relationship between Change in Corporate Social Performance and Financial Performance: A Stakeholder Theory Perspective”, Journal of Business Ethics, vol. 32, n. 2: 143-156.
SENGUPTA, P. (1998): “Corporate Disclosure Quality and the Cost of Debt”,
Accounting Review, vol. 73, n. 4: 459-474
SCOTT, T. (1994): “Incentives and Disincentives for Financial Disclosure: Voluntary Disclosure of Defined Benefit Pension Plan Information by Canadian Firms”, Accounting Review, vol. 69, n. 1: 26-43.
STAFF REPORTS. (1999): “Glossy Annual Faces Possible Extinction”, Investor Relations Business, vol. 4, n. 22: 8-9.
STANDARD & POORS. (2002): Transparency and Disclosure: Overview of Methodology and Study Results – United States. Standard & Poors, New York. WILDSTROM, S.H. (1997): “Surfing for Annual Reports”, Business Week, April 14: 22.
WILMSHURST, T.D.; FROST, G.R. (2000): “Corporate Environmental Reporting: A Test of Legitimacy Theory”, Accounting, Auditing and Accountability Journal, vol. 13, n. 1: 10-26.
WISEMAN, J. (1982): “An Evaluation of Environmental Disclosures Made in Corporate Annual Reports”, Accounting Organizations and Society, vol. 7, n. 1: 53-63.
WOODWARD, D.G.; EDWARDS, P.; BIRKIN, F. (1996):” Organizational Legitimacy and Stakeholder Information Provision”, British Journal of Management, vol. 7, n. 4: 329-347.
APPENDIX
PERFORMANCE DISCLOSURE GRID. CODING SCORES
Liquidity Product description
Indebtedness Quality / up-to-date technology Interest coverage Reliability: errors / returns
Total solvency Price
Net operating income Delivery time
Gross margin Awards
ROA or ROE Total product
EPS (diluted) Customer profile / market segment / market share / number of customers Stock price or stock return Pre-sales support: information / counsel / orders follow-up
EVA After-sales service / insurance
Total profitability Customer satisfaction / complaints management Total financial performance Customer loyalty
Leadership Awards
Mission Total Customers
Strategic planning Service Internet (1 if order, 2 if service, 3 if both) Risk management E-business sales
Globalization E-business productivity [Cost efficiency / speed]
Total strategic management Impact (award, number of users or visitors) Competence of managers Total e-business
Managers’ compensation Total customer value
Total managers Hiring / new employees
Competence Board Qualification / expertise Independence Board Training
Compensation (stocks/options) Description of job requirements 1, 2, 3 Other committees Total competence
Total directors Employee empowerment / involvement
Competence Audit committee Capacity to suggest and to implement changes Independence Audit committee Teamwork
Relations with external auditors Performance assessment
Relations with internal auditors Performance based compensation
Total Audit committees Earnings-based compensation Ownership structure Carrier opportunities
Other Award
Total ownership Fringe benefits
Total corporate governance Total motivation/work climate
Employees satisfaction, survey Employee turnover
Other
Total satisfaction
Investment ($) Purchases of goods and services Reengineering / downsizing Employment opportunities Process improvement methods (ex. Kaisen) Job creation]
ISO 9000, total quality management – TQM Equity programs
Others (benchmarking, JIT, etc.) Human capital development
Total operations rationalization Regional development
Production cost Gifts and sponsorships
Production capacity Accidents at work
Waste Health and safety programs
Inventory / run out rate Product-related-incidents
Quality of equipment and technology Products in development and environment
Flexibility Product safety
Process description (1,2,3) Business ethics
Others Strategic alliances
Total productivity-cost Community involvement
Production time Social activities
Unplanned downtime Total social responsibility
Total productivity-speed / cycle time Total performance management Partnerships
Acquisitions
Total strategic alliances
Total production efficiency Sales – new products Market share – new products Awards
Total new products
Investments in R&D
Description of products in development Product testing
Awards Others - R&D
Total R&D
Increase in sales / market shares Increase in investments
Total growth