Air Force Institute of Technology
AFIT Scholar
Theses and Dissertations Student Graduate Works
2-29-2012
Agent Based Modeling and Simulation Framework
for Supply Chain Risk Management
Tiffany J. Harper
Follow this and additional works at:https://scholar.afit.edu/etd
Part of theOperations and Supply Chain Management Commons, and theRisk Analysis Commons
This Dissertation is brought to you for free and open access by the Student Graduate Works at AFIT Scholar. It has been accepted for inclusion in Theses and Dissertations by an authorized administrator of AFIT Scholar. For more information, please [email protected]. Recommended Citation
Harper, Tiffany J., "Agent Based Modeling and Simulation Framework for Supply Chain Risk Management" (2012).Theses and Dissertations. 1211.
Agent Based Modeling and Simulation Framework
For Supply Chain Risk Management
DISSERTATION
Tiffany J. Harper
AFIT/DS/ENS/12-02
DEPARTMENT OF THE AIR FORCE AIR UNIVERSITY
AIR FORCE INSTITUTE OF TECHNOLOGY
The views expressed in this dissertation are those of the author and do not reflect the official policy or position of the United States Air Force, Department of Defense, or the U.S.
AFIT/DS/ENS/12-02
AGENT BASED MODELING AND SIMULATION FRAMEWORK
FOR SUPPLY CHAIN RISK MANAGEMENT
DISSERTATION
Presented to the Faculty
Department of Operational Sciences
Graduate School of Engineering and Management
Air Force Institute of Technology
Air University
Air Education and Training Command
In Partial Fulfillment of the Requirements for the
Degree of Doctor of Philosophy in Operations Research
Tiffany J. Harper, B.S., M.S.
AFIT/DS/ENS/12-02
AGENT BASED MODELING AND SIMULATION FRAMEWORK
FOR SUPPLY CHAIN RISK MANAGEMENT
Tiffany J. Harper, B.S., M.S.
Approved:
______//signed//___________________________ 3/12/2012
Dr. J.O. Miller Date
__________
Dissertation Advisor
______//signed//___________________________
Dr. Raymond Hill Date
3/12/2012__________
Committee Member
______//signed//___________________________ 3/12/2012
Lt Col Joseph Wirthlin Date
__________ Committee Member Accepted: ______//signed//___________________________ 3/12/2012 M. U. Thomas Date __________
Dean, Graduate School of Engineering and Management
AFIT/DS/ENS/12-02
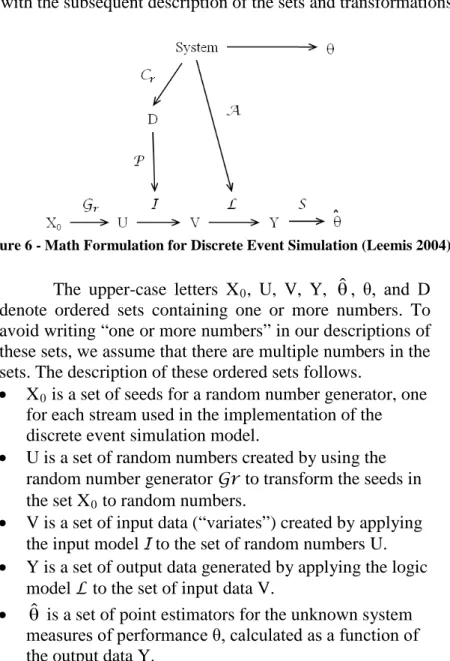
Abstract
This research develops a flexible agent based modeling and simulation (ABMS)
framework for supply chain risk management with significant enhancements to standard ABMS
methods integrated with software agents and extended supply chain risk modeling. Our
framework provides Air Force Materiel Command (AFMC) with a scalable modeling approach
to more efficiently capture supply chain performance and risks. We begin with the use of
software agents to gather and process input data for use in our simulation model. For our
simulation model we extend an existing mathematical framework for discrete event simulation
(DES) to ABMS and then implement the concepts of variable resolution modeling from the DES
domain to ABMS and provide further guidelines for aggregation and disaggregation of supply
chain models. Existing supply chain risk management research focuses on consumable item
supply chains. Since the AF supply chain contains many reparable items, we fill this gap with
our risk metrics framework designed specifically for the greater complexity of reparable item
supply chains. We present new metrics along with existing metrics, in a framework for reparable
item supply chain risk management and discuss aggregation and disaggregation of metrics for
AFIT/DS/ENS/12-02
Acknowledgments
I would like to thank my advisor Dr. Miller for the patience and guidance needed to make
it through successfully. To my committee members, Dr. Hill and Lt Col Wirthlin, thanks for all
your feedback and further guidance. The COA staff, thank you for providing help with data and
enduring endless questions about the Air Force supply chain. Much gratitude goes out to my
fellow AFIT students for helping me survive the demanding classes.
Lastly, and most importantly, I would like to thank my family and friends. Your support
Table of Contents Page Abstract ... iv Acknowledgments... v List of Figures ... ix List of Tables ... x 1 Introduction ... 1 1.1 General Discussion ... 1 1.2 Motivation ... 3
1.3 Proposed Research Contributions ... 4
1.4 Organization of Dissertation ... 5
2 Literature Review... 6
2.1 Overview ... 6
2.2 Supply Chain Risk Management ... 6
2.2.1 Types of Risk. ... 7
2.2.2 Risk Mitigation Strategies... 9
2.2.3 Risk Modeling. ... 11 2.2.4 Summary. ... 13 2.3 Software Agents ... 14 2.3.1 Definitions... 14 2.3.2 Purpose / Applications. ... 14 2.3.3 Characteristics. ... 15 2.3.4 Challenges. ... 16
2.3.5 Software Agents and Data Mining. ... 18
2.3.6 Decision Support Systems and Modeling with Software Agents. ... 18
2.3.7 Cougaar. ... 20
2.3.8 Summary. ... 21
2.4 Agent Based Modeling and Simulation ... 22
2.4.1 ABMS for Supply Chains. ... 23
2.4.2 ABMS for Inventory Control. ... 24
2.4.3 Variable Resolution Modeling. ... 29
2.4.4 Summary. ... 30
2.5 Supply Chain Risk Measurements and Metrics ... 31
2.5.1 Performance Measures. ... 31
3 Flexible Supply Chain Modeling and Analysis Framework: Integration of Software Agents
with Agent Based Simulation and Risk Measurement ... 37
3.1 Overview ... 37
3.1.1 Framework Development... 38
3.1.2 Software Agents for Data Mining Simulation Input. ... 39
3.1.3 Agent Based Simulation. ... 40
3.1.4 Supply Chain Performance and Risk Metrics Framework. ... 41
3.2 Integrating SA’s and ABMS ... 42
3.3 Application ... 44
3.4 Summary ... 45
4 Agent Based Simulation Design for Aggregation and Disaggregation ... 46
4.1 Overview ... 46
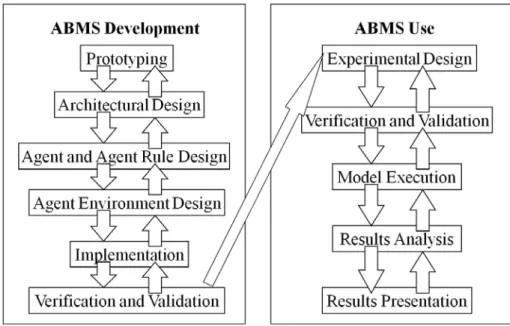
4.2 Standard ABMS Design Methodology ... 48
4.3 Math Framework for Variable Resolution ABMS ... 50
4.3.1 Discrete Event Simulation. ... 51
4.3.2 Agent Based Modeling and Simulation. ... 52
4.4 Planning and Designing Agents for Variable Resolution ... 55
4.4.1 Planning Phase. ... 56
4.4.2 Hierarchically Designing Agents. ... 57
4.4.3 Designing Agent Interactions. ... 58
4.4.4 Designing for Aggregate Process Data. ... 60
4.5 Example ... 62
4.6 Summary ... 66
5 Reparable Item supply Chain Risk Measurement Framework ... 67
5.1 Overview ... 67
5.2 Consumable Item Supply Chain Metrics ... 69
5.2.1 Customer Perspective... 70
5.2.2 Financial Perspective. ... 71
5.2.3 Internal Business Perspective. ... 71
5.2.4 Innovation and Learning Perspective... 72
5.3 Air Force Specific Metrics ... 73
5.3.1 Performance Measures. ... 74
5.3.2 Process Indicators. ... 75
5.4 Recommended Reparable Item Risk Metrics Framework ... 77
5.4.1 New Metrics. ... 77
5.4.2 Reparable Item SC Risk Metrics Framework. ... 80
5.4.3 Monitoring and Managing Risk Metrics. ... 80
5.5 Aggregation and Disaggregation of Metrics ... 84
6 Application ... 86 6.1 Goal ... 86 6.2 Model Assumptions... 87 6.3 AB Model ... 88 6.4 Data ... 89 6.5 Software Agents ... 92
6.6 Verification and Validation ... 94
6.7 Results ... 95
6.7.1 Initialization Period. ... 95
6.7.2 Decrease in Aircraft Availability Funding. ... 96
6.7.3 Lower Resolution and Aggregation Models. ... 98
6.7.4 Disruption Scenarios. ... 100
6.7.5 Detailed Analysis for a Single Base. ... 102
6.8 Summary ... 106
7 Conclusion ... 107
7.1 Research Contributions ... 107
7.2 Advantages and Disadvantages ... 110
7.3 Future Research ... 110
Bibliography ... 112
Appendix A. Agent Decision Support System overview diagram (Sokolova and Fernandez-Caballero (2009) ... 127
Appendix B. Research Storyboard ... 128
List of Figures
Figure Page
Figure 1 - Taxonomy of Supply Chain Models (Min and Zhou 2002) ... 12
Figure 2 - Supply Chain Modeling and Analysis Framework ... 37
Figure 3 - Aircraft Supply Chain Flow ... 41
Figure 4 - Range of Model Fidelity (Axe 2010, Lockheed Martin 2011, Globalsecurity.org 2011, PACAF 2011, WPAFB 2011)... 48
Figure 5 - Standard ABMS Procedure (North and Macal 2007b) ... 50
Figure 6 - Math Formulation for Discrete Event Simulation (Leemis 2004) ... 51
Figure 7 - A Framework for Variable Resolution ABMS ... 53
Figure 8 - Aircraft Supply Chain Example ... 63
Figure 9 - Aircraft Supply Chain Example Agent Structure... 65
Figure 10 - Original Balanced Scorecard Performance Measures (Kaplan and Norton 1992) .... 68
Figure 11 - Balanced Scorecard for DoD Logistics (DoD 2004) ... 68
Figure 12 - Application Model Active Agents ... 86
Figure 13 - Initialization Period Plots ... 96
Figure 14 - Average Aircraft Availability for Supply Chain Disruption Scenarios ... 101
Figure 15- Monthly Average % Availability for Resolution 2 ... 103
Figure 16 - Monthly Average Wait Time (days) for Resolution 2 ... 103
Figure 17 - Monthly Average % Availability for Resolution 3 ... 105
Figure 18 - Monthly Average Wait Time (days) for Resolution 3 ... 105
List of Tables
Table Page
Table 1 - Supply Chain Risk Classifications ... 8
Table 2 - Supply Chain Risks ... 8
Table 3 – Supply Chain Risk Mitigation Strategies... 10
Table 4 - Spectrum of software agent characteristics (Bui and Lee 1999) ... 16
Table 5 - Summary of intelligent agent applications ... 19
Table 6 - Aspects of Resolution (Davis and Hillestad 1993) ... 29
Table 7 - Categories of performance measurement in logistics ... 32
Table 8 - Supply Chain Performance and Risk Metrics ... 33
Table 9 - Process Parameters for High Resolution Model ... 63
Table 10 - Process Parameters for Low Resolution Model ... 64
Table 11 - Agent Interactions for High Resolution Model ... 65
Table 12 - Agent Interactions for Low Resolution Model ... 66
Table 13 - Consumable Item Risk Metrics ... 69
Table 14 - Current AF Metrics (Balanced Scorecard Framework) ... 74
Table 15 - Reparable Item Risk Metrics Framework ... 81
Table 16 - Application Model Input and Output ... 91
Table 17 - Base MTBF Comparison ... 92
Table 18 - Output for Baseline Funding versus 10% Drop ... 97
Table 19 - Average Aircraft Availability for Aggregation Models ... 99
Table 20 - Supply Chain Disruption Scenarios... 100
AGENT BASED MODELING AND SIMULATION FRAMEWORK
FOR SUPPLY CHAIN RISK MANAGEMENT
1 Introduction
1.1 General Discussion
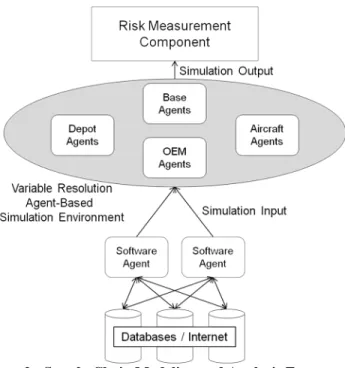
This document presents a framework for supply chain risk management, with
focus on reparable item supply chains. The framework is comprised of software agents,
agent based modeling and simulation (ABMS) and a risk measurement framework.
Software agents gather and analyze data from databases, or from the internet, to provide
input for the agent based simulation. The agent based model simulates supply chain
dynamics and the output from the simulation is used to compute supply chain
performance and risk metrics. Finally, a backend to the simulation displays these metrics
for use by management and decision making officials. The goal of this research is to
develop smaller, but integrated, contributions within the supply chain risk management
area of research.
The framework can be used to assess risk mitigation strategies or to recurrently
assess risk and supply chain performance. Software agents can periodically (i.e.
daily/weekly/etc.) collect and analyze data, then run simulations, and finally display
current (and past) performance and risk metrics. This technique could provide
chain problem. To determine how to prevent a problem or determine what to do after a
problem occurs, the framework can be used to analyze effectiveness of several risk
mitigation strategies.
The methodology is applied to a selected portion of the United States Air Force
(AF) supply chain, namely, a small portion of the F16 supply chain, but the general
framework can theoretically be applied to any reparable item supply chain. The USAF
supply chain contains numerous weapons systems, inventory parts, depots, bases,
Forward Operating Bases (FOBs), maintenance personnel, project managers, logistics
personnel, databases, and supplies distributed globally. Furthermore, the USAF has
several budgetary constraints and also interacts and shares some resources with other
branches of the Department of Defense (DoD). DoD has emphasized the concern of
security threats due to supply chain disruptions in a new policy called “National Strategy
for Global Supply Chain Security (Heilprin 2012).”
In the most simplistic view, when a part on an aircraft fails it is repaired at the
base level, which includes the flightline and backshops. If the part cannot be repaired at
the base, due to personnel capacity and/or equipment constraints, the part is shipped to a
depot. Depots are comprised of several specialty shops that are better equipped to repair
broken parts. If the depot cannot repair a part, then a new part can be ordered from the
original equipment manufacturer. This process depiction is very simplistic in that it does
not consider factors, such as: parts are sent between bases, i.e. lateral supply; parts are
taken from one aircraft to quickly satisfy the needs of another aircraft, known as
failures. Furthermore, there is an extraordinary amount of paperwork, administrative
work, and data tracking within the supply chain.
1.2 Motivation
Military logistics suffer from large complexity and scope because there are:
millions of different object types to be managed; tens of thousands of different
interleaved discrete business processes; thousands of different organizations with their
own physical plants, user requirements, and constraints; a complex, continual interplay
between planning and execution; and over a thousand legacy databases and systems with
different data models and protocols (BBN 2004). Similar characteristics also apply to
many large commercial/industry supply chains, such as Caterpillar, Wal-Mart, etc.
Along with these logistical challenges, companies must deal with ever
diminishing funding and greater threats of terrorism. Commercial companies also face
increased competition from globalization, while the military must deal with changing
military presence in the Middle East and other areas around the world. Therefore,
companies and military organizations constantly face greater needs for supply chain risk
management. The research presented in this document aims to provide the methodology
framework to support this need.
The primary goal of this research is the development of a better supply chain risk
management framework, comprised of smaller, but integrated, research contributions.
The intermediate goals are the integration of software agents with an agent based
of fidelity, and development of a supply chain risk metrics framework for reparable item
supply chains.
Integration of software agents with an agent based platform provides a dynamic
and more intuitive method for simulating supply chains. Existing agent based simulation
software reduces the time and effort of modeling a supply chain, by providing
preprogrammed modules. That is, code has already been written by software developers
to perform standard supply chain entity tasks, such as check inventory level. By linking
software agents with an agent based platform, the effort to develop and code simulation
agents is reduced. Guidelines for designing agent structure and interactions to
accommodate scalability reduce the time and effort required when adapting existing
agent based simulation models for use beyond their original purpose. Similar guidelines
for developing and scaling risk metrics complete our framework. With this approach
agent based simulation models can be used for multiple studies without starting from
scratch every time.
1.3 Proposed Research Contributions
The overall contribution is a better supply chain risk management framework,
which is divided into three smaller contributions:
• Integration of software agents with agent based modeling and simulation (ABMS) agents
o software agents performing data mining to produce inputs for agent based
• ABMS guidelines for aggregation / disaggregation of supply chain agents and interactions
o Designing agent structure to allow for easy scalability in terms of fidelity • Supply chain risk metrics framework for reparable item supply chains
o Selectable and scalable in terms of fidelity
1.4 Organization of Dissertation
The remainder of this research encompasses six chapters. The second chapter
provides a literature review of supply chain risk management, software agents, agent
based modeling and simulation and supply chain risk measurements and metrics. Chapter
three provides the simulation framework that integrates software agents, ABMS, and risk
metrics for management of supply chain risk. Chapter four outlines the agent structure
and guidelines for designing ABMS for aggregation and disaggregation. Chapter five
provides a risk measurement framework for reparable item supply chains. Chapter six
presents the application of the proposed ABMS and risk management framework to a
portion of the F-16 supply chain. Finally, the last chapter summarizes the presented
2 Literature Review
2.1 Overview
This literature review is comprised of four main literature areas: supply chain risk
management, software agents, agent based modeling and simulation (ABMS), and supply
chain risk measurement.
2.2 Supply Chain Risk Management
Risk is defined by Juttner et al. (2003) as “the variation in the distribution of
possible supply chain outcomes, their likelihood, and their subjective values.” Risk
management is the process of examining all possible outcomes and weighing the
potential returns against the potential risks of the investment (Pettit et al. 2010). Supply
chain risk management grew in popularity as a result of catastrophic events, such as the
terrorist attacks on the World Trade Center in 2001, Hurricane Katrina in 2005 and the
SARS epidemic in South-East Asia in 2003 (Wagner and Bode 2006). Some examples
where the lack of, or poor, risk management led to negative company impacts include: a
fire caused by lightning in a semiconductor plant leading to over $400 million in lost
revenue for the Ericsson company; Nike’s decrease in market capitalization by almost
20% and lost revenue of $100 million due to difficulties implementing supply chain
management software; and the massive tire recalls and over 100 highway fatalities
resulting from quality problems with Firestone tires (Shi 2004).
increased volatility of demand, increased demand for product availability, customization,
low prices, specialized factories, centralized distribution, shortening product life cycles,
and Just-In-Time’s lean inventory practices, which lead to little or no inventory and few
suppliers (Foroughi et al. 2006; Pettit et al. 2010). Specifically for transportation
operations, the main drivers of risk are delays, delivery constraints, lack of coordination,
variable demand and poor information (Sanchez-Rodriguez et al. 2010).
Risk analysis is classified, by Pai et al. (2003), into three categories: vulnerability
assessment, which consists of threat-asset identification and susceptibility; consequence
analysis, and; countermeasure analysis and implementation. These categories align with
the basic steps of supply chain risk management outlined by Tuncel and Alpan (2010):
1. Risk Identification
2. Risk Assessment
3. Risk Management
4. Risk Monitoring
2.2.1 Types of Risk.
There is a vast amount of literature on supply chain risk and categorizations of
supply chain risk. Most literature lists risks according to a categorization/classification
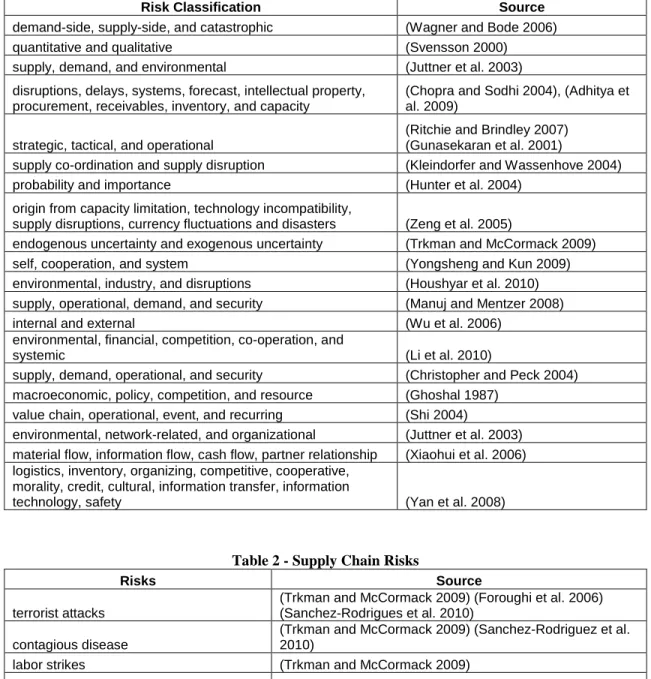
framework. The most recurrent classification schema observed from literature divides
supply chain risk into supply, demand, and environmental. Table 1 lists other supply
chain risk classifications and Table 2 lists the supply chain risks that fall within these
classifications. With respect to the Air Force (AF) supply chain the classification from
classification aligns with military language. However, a subdivision that should be
included in an AF supply chain risk classification is security risks.
Table 1 - Supply Chain Risk Classifications
Risk Classification Source
demand-side, supply-side, and catastrophic (Wagner and Bode 2006) quantitative and qualitative (Svensson 2000) supply, demand, and environmental (Juttner et al. 2003) disruptions, delays, systems, forecast, intellectual property,
procurement, receivables, inventory, and capacity
(Chopra and Sodhi 2004), (Adhitya et al. 2009)
strategic, tactical, and operational
(Ritchie and Brindley 2007) (Gunasekaran et al. 2001)
supply co-ordination and supply disruption (Kleindorfer and Wassenhove 2004) probability and importance (Hunter et al. 2004)
origin from capacity limitation, technology incompatibility,
supply disruptions, currency fluctuations and disasters (Zeng et al. 2005)
endogenous uncertainty and exogenous uncertainty (Trkman and McCormack 2009) self, cooperation, and system (Yongsheng and Kun 2009) environmental, industry, and disruptions (Houshyar et al. 2010) supply, operational, demand, and security (Manuj and Mentzer 2008)
internal and external (Wu et al. 2006)
environmental, financial, competition, co-operation, and
systemic (Li et al. 2010)
supply, demand, operational, and security (Christopher and Peck 2004) macroeconomic, policy, competition, and resource (Ghoshal 1987)
value chain, operational, event, and recurring (Shi 2004)
environmental, network-related, and organizational (Juttner et al. 2003) material flow, information flow, cash flow, partner relationship (Xiaohui et al. 2006) logistics, inventory, organizing, competitive, cooperative,
morality, credit, cultural, information transfer, information
technology, safety (Yan et al. 2008)
Table 2 - Supply Chain Risks
Risks Source
terrorist attacks
(Trkman and McCormack 2009) (Foroughi et al. 2006) (Sanchez-Rodrigues et al. 2010)
contagious disease
(Trkman and McCormack 2009) (Sanchez-Rodriguez et al. 2010)
labor strikes (Trkman and McCormack 2009) inflation rate (Trkman and McCormack 2009) consumer price index changes (Trkman and McCormack 2009)
market turbulence
(Trkman and McCormack 2009) (Yongsheng and Kun 2009) (Houshyar et al. 2010) (Li et al. 2010)
technological turbulence
(Trkman and McCormack 2009) (Yongsheng and Kun 2009)
Risks Source
political turbulence
(Trkman and McCormack 2009) (Yongsheng and Kun 2009) (Houshyar et al. 2010) (Li et al. 2010)
transportation uncertainties (Wilson 2007) (Wu and Olson 2008) (Foroughi et al. 2006) competition (Trkman and McCormack 2009) (Houshyar et al. 2010) storage transfer (Yongsheng and Kun 2009)
moral risk (Yongsheng and Kun 2009)
culture difference (Yongsheng and Kun 2009) information system (Yongsheng and Kun 2009) equipment transfer (Yongsheng and Kun 2009) economic crisis (Yongsheng and Kun 2009) financial risk (not meeting certain target
profit or exceeding a cost level) (Sabio et al. 2010)
social uncertainties (Houshyar et al. 2010) (Li et al. 2010) exchange rates (Foroughi et al. 2006)
port lockouts (Foroughi et al. 2006) materials shortages (Foroughi et al. 2006) power outages (Foroughi et al. 2006)
regulations (Li et al. 2010) (Sanchez-Rodrigues et al. 2010) quality issues (Sanchez-Rodriguez et al. 2010)
One of the most prevalent supply chain risks for the AF is port lockouts (or border
lockouts), since this has happened several times with transporting supplies into
Afghanistan. Other risks that highly pertain to the AF supply chain are terrorist attacks
and natural disasters. The military is often called in to provide assistance during and after
disasters, which can disrupt the AF supply chain. Other risks directly related to the AF
supply chain include equipment transfer, transportation uncertainties, and information
systems.
2.2.2 Risk Mitigation Strategies.
According to Tang (2006) the four basic approaches for managing supply chain
risks are supply management, product management, demand management, and
information management. Following this categorization, supply chain risk mitigation
Table 3 – Supply Chain Risk Mitigation Strategies
Risk Mitigation Strategy Source
Supply Management
postponement (Tang 2006) (Manuj and Mentzer 2008)
strategic stock investment (Tang 2006) (Chopra and Sodhi 2004) (Khan and Burnes 2007)
flexible supply base (Tang 2006) (Rice and Caniato 2003) (Ponomarov and Holcomb 2009) (Xiaohui et al. 2006)
economic supply incentives (Tang 2006)
multi-modal flexible transportation (Tang 2006) (Pettit et al. 2010)
multiple suppliers (Chopra and Sodhi 2004) (Khan and Burnes 2007) (Wagner and Bode 2006) (Manuj and Mentzer 2008)
redundancy (Rice and Caniato 2003) (Ponomarov and Holcomb 2009) economic supply incentives (Pettit et al. 2010)
make-and-buy (Pettit et al. 2010) reduction of uncertainty, complexity,
reengineering (Ponomarov and Holcomb 2009)
add capacity (Chopra and Sodhi 2004) (Tang 2006) (Manuj and Mentzer 2008)
hedging (Manuj and Mentzer 2008)
agility (Christopher and Peck 2004) (Ponomarov and Holcomb 2009) control/share/transfer risk (Manuj and Mentzer 2008)
Product Management product variety (Tang 2006)
postponement / product differentiation (Tang 2006) (Khan and Burnes 2007) (Wanger and Bode 2006) (Manuj and Mentzer 2008)
dynamic assortment planning (Tang 2006) Demand Management dynamic pricing (Tang 2006) dynamic assortment planning (Tang 2006) silent product rollover (Tang 2006)
forecasting / speculation (Manuj and Mentzer 2008) (Tang 2006) control/share/transfer risk (Manuj and Mentzer 2008)
change inventory control mode (Xiaohui et al. 2006) Information Management
information sharing (Faisal et al. 2006) (Khan and Burnes 2007) (Wagner and Bode 2006) (Manuj and Mentzer 2008) (Xiaohui et al. 2006)
collaboration (Faisal et al. 2006) (Tang 2006) (Ponomarov and Holcomb 2009)
information security (Faisal et al. 2006)
visibility / knowledge (Tang 2006) (Ponomarov and Holcomb 2009) (Faisal et al. 2006)
forecasting (Tang 2006)
2.2.3 Risk Modeling.
Pettit et al. (2010) states “the best level of resilience will be achieved only when a
balance is maintained between capabilities and vulnerabilities.” This statement, specific
to supply chain resilience, is valid for the broader area of supply chain risk management.
To determine this balance, supply chain managers must make decisions on site location,
choices of production, packaging and distribution lines, and capacity increment or
decrement policies (Poojari et al. 2008). Other decisions include resource allocation,
network structuring, number of facilities and equipment, number of stages, service
sequence, volume, inventory level, size of workforce, and extent of outsourcing (Min and
Zhou 2002).
Naraharisetti et al. (2009) divides the above decisions into system representation;
modeling and simulation; synthesis and design; planning and scheduling; and control and
supervision. Juttner et al. (2003) categorizes the decisions into the following supply chain
trade-off decisions: repeatability vs. unpredictability; lowest bidder vs. known supplier;
centralization vs. dispersion; collaboration vs. secrecy; redundancy vs. efficiency; and
managing risk vs. delivery value. One last trade-off that an enterprise must consider when
assessing supply chain risk is whether the enterprise is risk prone or risk averse (Choi et
al. 2008).
A large amount of literature describes several modeling techniques that can assist
decision makers in making the previously described supply chain decisions. Figure 1
depicts the general supply chain modeling techniques, which can be divided into
Zhou 2002). Another largely used technique not mentioned by Min and Zhou (2002) is
the vast range of diagramming techniques.
Figure 1 - Taxonomy of Supply Chain Models (Min and Zhou 2002)
Diagramming techniques include graph theory (Wagner and Neshat 2010, and
Caridi et al. 2010), process mapping (Shi 2004), critical path analysis (Juttner et al.
2003), causal tree structure (Pai et al. 2003, and Foroughi et al. 2006), value-focused
thinking and process chain process modeling (Neiger et al. 2009), and work-flow
diagrams (Adhitya et al. 2009).
Simulation models include agent based (Datta et al. 2007, Chen and Huang 2007,
and Kroger 2008), discrete event (Kull and Closs 2008, Schmitt and Singh 2009), timed
Petri net based simulation (Tuncel and Alpan 2010), and Monte Carlo (White 1995, Wu
and Olson 2008, and Schmitt and Singh 2009). More detail on simulation techniques is
provided in section 2.3 of this document.
Optimization models include heuristics (Wang and Shu 2007, and Tang et al.
2008), bicriterion mathematical programming (Gaur and Ravindran 2006), chance
constrained programming, data envelopment (Gaur and Ravindran 2006), stochastic
programming (Kull and Talluri 2008), linear programming (Ahmed et al. 2007, and
Bogataj and Bogataj 2007), and lattice-programming (Cucchiella and Gastaldi 2006).
Other techniques used in supply chain modeling include stress testing (Shi 2004);
behavioral risk theory (Ellis et al. 2010); complexity analysis (Yang and Yang 2010);
structural self-interaction matrix and reachability matrix (Faisal et al. 2006); information
entropy assessment (Li et al. 2010); economics models (Kleijnen and Smits 2003,
Kirkwood et al. 2005, and Singh et al. 2010); Pareto analysis (Gunasekaran et al. 2001);
analytical hierarchy process (AHP) analysis (Bargbarosoglu and Yazgac 2000, and
Rabelo et al. 2007); failure mode, effects and criticality analysis (FMECA) technique
(Tuncel and Alpan 2010); Bayesian models (Li and Chandra 2007); and principle
component analysis (Qiang and Jingjuan 2010).
2.2.4 Summary.
There is a vast amount of literature on consumable item supply chain risk
management. However, there is little research focusing on reparable item supply chains,
which entail greater complexity than consumable item supply chains. Furthermore,
existing modeling techniques lack the dynamic, complexity and stochastic requirements
necessary for modeling risk of large supply chains. Supply chains involving reparable
items cannot easily be captured with mathematical equations because of redundancy and
nonlinear flow of material. Thus, our research fills this gap by employing simulation,
with intended application to portions of the AF reparable supply chain. For further
2.3 Software Agents
2.3.1 Definitions.
The Organization for Advancement of Structured Information Standards depicts
software agents as “a paradigm for organizing and utilizing distributed capabilities that
may be under the control of different ownership domains (Oluwole 2008).” Gilbert
(2007) defines a software agent, with respect to computer science, as “a software entity,
which is autonomous to accomplish its design objectives, considered as a part of an
overall objective, through the axiom of communication and coordination with other
agents.” For this research, a software agent is defined as a software program that
performs actions in pursuit of a specific goal (Nienaber and Barnard 2007).
A software agent that is self-contained and can move within a network to act on
behalf of the user or another entity is called a mobile agent (Pham and Karmouch 1998).
Intelligent software agents are innovative programs that perform autonomous and
continuous research and data gathering tasks, analyze the results, and deliver
personalized, relevant, exploitable information (Agentland 2010). Software agents,
multi-agents and intelligent multi-agents are sometimes used synonymously throughout literature.
2.3.2 Purpose / Applications.
In general, software agents are used to emulate enterprise entities (Julka et al.
2002). These entities can be macro, such as a supply chain retailer, or micro, such as a
forklift in a warehouse. Some agents serve as monitoring agents that “monitor the states
networks, virtual domains, computer applications and operating systems (Croft 2004).
The types of agents observed in literature include information retrieval agents, advisory
agents, data cleansing agents, communication agents, scheduling agents, and negotiation
agents.
2.3.3 Characteristics.
The primary characteristics of agents are autonomy, social ability, reactivity and
proactiveness. Autonomy is the agent’s ability to operate without direct intervention of
humans or others, and the agent’s control (or semi-control) over its actions and internal
state. Social ability of an agent is its capability of interacting with other agents, or
humans, via some kind of communication language. Reactivity refers to an agent’s ability
to perceive its environment and respond in a timely fashion to changes that occur in it.
Proactiveness is an agent’s ability to exhibit goal-directed behavior by taking the
initiative, and not simply acting in response to its environment. (Moyaux et al. 2006)
Additional characteristics that are not defining characteristics of agents include
adaptivity and flexibility. Adaptivity refers to an agent’s ability to customize itself on the
basis of previous experiences (Nienaber and Barnard 2007), while flexibility refers to an
agent’s ability to dynamically choose which actions to invoke and in what sequence to
execute those actions (Pai et al. 2000). The essential characteristics specific to mobile
agents are security, portability, mobility, communication, resource management, resource
discovery, identification, control and data management (Pham and Karmouch 1998).
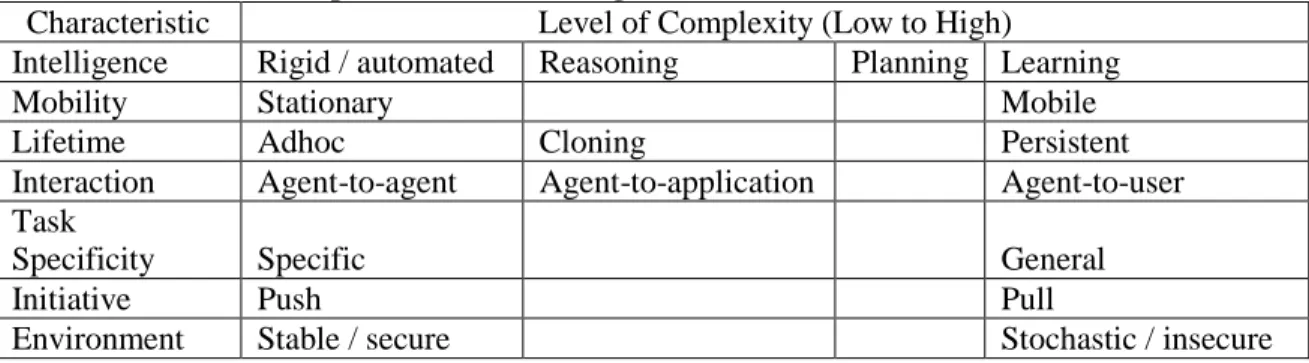
Table 4 provides a spectrum of seven software agent characteristics, ranging from simple
Table 4 - Spectrum of software agent characteristics (Bui and Lee 1999)
Characteristic Level of Complexity (Low to High)
Intelligence Rigid / automated Reasoning Planning Learning
Mobility Stationary Mobile
Lifetime Adhoc Cloning Persistent
Interaction Agent-to-agent Agent-to-application Agent-to-user
Task
Specificity Specific General
Initiative Push Pull
Environment Stable / secure Stochastic / insecure
2.3.4 Challenges.
The biggest challenge with using software agents is capturing decision/behavioral
logic of agents, and doing so in a timely manner. This challenge is prevalent in most
modeling and simulation efforts. As often depicted in simulation literature, modeling is as
much an art as it is a science. This may be true for agent based modeling more than
discrete event modeling.
Challenges specific to mobile agents include transportation, authentication,
secrecy, security, cash, performance, and interoperability/communication/brokering
services (Nwana 1996). Software agent developers must consider the following questions
in regard to these challenges (Nwana 1996):
• Transportation: how does an agent move from place to place? How does it pick up and move?
• Authentication: how do you ensure the agent is who it says it is, and that it is representing who it claims to be representing? How do you know it has navigated
various networks without being infected by a virus?
• Secrecy: how do you ensure that your agents maintain your privacy? How do you ensure someone else does not read your personal agent and execute it for his own
gains? How do you ensure your agent is not killed and its contents
‘core-dumped’?
• Security: how do you protect against viruses? How do you prevent an incoming agent from entering an endless loop and consuming all the CPU cycles?
• Cash: how will the agent pay for services? How do you ensure that it does not run amok and run up an outrageous bill on your behalf?
• Performance issues: what would be the effect of having hundreds, thousands or millions of such agents on a WAN?
• Interoperability/communication/brokering services: how do you provide brokering/directory type services for locating engines and/or specific services?
How do you execute an agent written in one agent language on an agent engine
written in another language? How do you publish or subscribe to services, or
support broadcasting necessary for some other coordination approaches?
Several of these challenges have been addressed in literature. Researchers have
used public-key and private-key digital signature techniques and limited interpreted
languages to prevent illegal instructions from being executed to handle authentication,
cash, secrecy and security (Nwana 1996). The Cognitive Agent Architecture (Cougaar)
that is discussed in Section 2.3.7 has been developed to overcome some of the software
agent challenges. For example, fully automatic monitoring and restart of agents handles
the unexpected loss of agents, while automated application maintenance for load
2.3.5 Software Agents and Data Mining.
For many companies and organizations, information across all enterprises and the
departments is distributed, dynamic and disparate in nature (Julka et al. 2002). This tends
to be true for the AF also. For this type of information to be useful the process of data
mining must be applied. Data mining is a process that combines tools and techniques
from machine learning, statistics, artificial intelligence, and data management to extract
useful knowledge from data automatically (Srinivas and Harding 2008).
Software agents provide a natural means for data mining. Applications of
software agents for data mining extend to Aerospace manufacturing industry (Oluwole
2008), electrical transformers (Wu et al. 2004), ERP systems (Symeonidis et al. 2003),
shop floor control (Srinivas and Harding 2008), etc. Examples of agent enhancements for
data mining include implementation of data clustering algorithms in agent logic to protect
company privacy (da Silva et al. 2006), aggregation of domain context in agent data
analysis logic (Xiang 2008), and learning algorithms for continuous data mining (Srinivas
and Harding 2008). For more literature pertaining to software agents for data mining and
preprocessing refer to Othman et al. (2007).
2.3.6 Decision Support Systems and Modeling with Software Agents.
Decision centers in present-day enterprises often reside in different departments
(Julka et al. 2002). Because of this, agents are ideal for collecting information from each
department and performing enterprise-wide analysis to aid decision making.
management, electronic commerce, business process management, patient monitoring
and rescue team management (Moyaux et al. 2006). Other application areas include
chemical industries (Garcia-Flores et al. 2000), produce transport (Jedermann et al.
2006), and environmental health (Sokolova and Fernandez-Caballero 2009). Since the
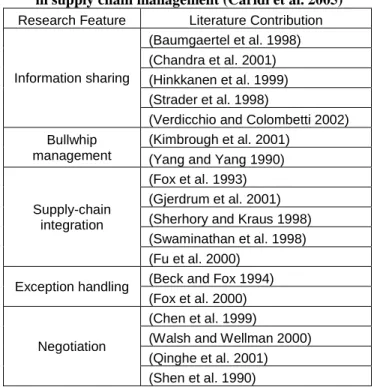
first attempt to model the supply chain through intelligent agents by Fox et al. (1993),
there have been several research contributions to supply chain management (refer to
Table 5.)
Table 5 - Summary of intelligent agent applications in supply chain management (Caridi et al. 2005)
Research Feature Literature Contribution
Information sharing
(Baumgaertel et al. 1998) (Chandra et al. 2001) (Hinkkanen et al. 1999) (Strader et al. 1998)
(Verdicchio and Colombetti 2002) Bullwhip
management
(Kimbrough et al. 2001) (Yang and Yang 1990)
Supply-chain integration
(Fox et al. 1993) (Gjerdrum et al. 2001) (Sherhory and Kraus 1998) (Swaminathan et al. 1998) (Fu et al. 2000)
Exception handling (Beck and Fox 1994) (Fox et al. 2000)
Negotiation
(Chen et al. 1999)
(Walsh and Wellman 2000) (Qinghe et al. 2001) (Shen et al. 1990)
More recent innovations to software agent technology for supply chain
management include the integration of RFID with mobile agents to track freshness of
produce in transit (Jedermann et al. 2006), integration of numerous multi-agent systems
(Frey et al. 2003), adaptation of fuzzy logic to agent behavior (Si and Lou 2009),
object-oriented modeling of supply chain flows with agent-oriented modeling of supply
chain entities (Julka et al. 2002).
Zimmermann et al. (2006) developed a decision support system for supply chain
event management. They developed a simulator agent that facilitates simulation of orders
in a supply chain, but the simulation was performed by a database. Sokolova and
Fernandez-Caballero (2009) also use a simulation agent, but is accomplished with
equations instead of a database. A diagram of the decision support system by Sokolova
and Fernandez-Caballero (2009) is provided in Appendix A.
Instead of a simulator agent, we propose the use of software agents interacting
with agent based simulation agents. That is, use an entirely separate software platform to
simulate the supply chain. Further details are discussed in the methodology section of this
paper.
2.3.7 Cougaar.
Cougaar (Cognitive Agent Architecture) is an open-source Java-based multi-agent
architecture that provides a survivable base on which to deploy large-scale, robust
distributed applications (Helsinger et al. 2005, Upal and Fung 2003). Cougaar was
developed for the US Defense Advanced Research Projects Agency (DARPA) under the
Advanced Logistics Program (ALP) (BBN 2004), with the goal to explore the potential of
distributed multi-agent systems for military logistics (Helsinger et al. 2005). The
architecture was developed by ALPINE, a consortium composed entirely of BBN
Under a new DARPA program, Ultra-Log, BBN continued to develop and
maintain Cougaar from 2001 to 2004 (BBN 2004). Ultra-Log focused on enhancing
Cougaar by installing components offering robustness, security, and scalability (BBN
2004). Upal and Fung (2003) enhanced the architecture by adding dynamic plan
evaluation capability to Cougaar that essentially evaluates and chooses the best course of
action in an uncertain situation when multiple plans are available.
The US Army has included Cougaar as a central design point in a new logistics
decision support system, and a military maneuver decision support system (Helsinger et
al. 2005). Furthermore, CougaarME, Cougaar tuned to small devices, was used by one
program to control semi-autonomous robots over a wireless ad-hoc network (Helsinger et
al. 2005).
2.3.8 Summary.
Literature on software agents depicts their usefulness in decision support tools,
and specifically data mining. Although there are several agent design issues that must be
considered, software agents provide a great mechanism for data mining AF databases for
useful information to aid supply chain risk management. However, literature on software
agent decision support tools does not depict a natural and easily developable modeling
technique necessary for modeling the AF supply chain. Thus, our research fills this gap
by integrating data mining software agents with an agent based simulation software
platform.
Most AB simulation platforms contain pre-coded logic and functions, such as
collection and analysis of simulation output, most simulation platforms have built-in
charts and tables that can export data in several formats. Developing an AB simulation
using software agents, known as multi-agent simulation, requires extensive coding and
linking with data structures to achieve the capabilities of a software platform. Thus, our
framework uses the benefits of SA’s in data mining with the benefits of AB simulation
software platforms to achieve a better risk management framework.
2.4 Agent Based Modeling and Simulation
Agent based modeling and simulation (ABMS) characterizes a system by
allowing individual agents to perform a set of behavior rules, which leads to interactions
between agents and between agents and their environment. This method of simulation is
“founded on the notion that the whole of many systems or organizations is greater than
the simple sum of their constituent parts (North and Macal 2007a).” ABMS combines
discrete event simulation, which provides the interactions of individual components
within a simulation, and object-oriented programming, which provides well-tested
frameworks for organizing agents based on their behaviors (North and Macal 2007a).
Agents are defined by Pan et al. (2009) as “active, persistent (software)
components with the abilities of perceiving, reasoning, acting and communicating.”
Having sets of attributes and behavior rules, agents are essentially the decision making
components in complex adaptive systems (North and Macal 2007a). While attributes
describe the agent, the behavior rules dictate how agents respond to their environment
ABMS originated from the study of complex adaptive systems and cellular
automata, with some of the earliest agent based models being “Game of Life” and
sugarscape models (North and Macal 2007a). For more details on the history of ABMS
refer to (Heath 2010).
2.4.1 ABMS for Supply Chains.
ABMS is highly germane to supply chain management because performance
measures, such as productivity, shipping accuracy, and inventory can be predicted via a
model prior to expending money and time on changing the actual system. Furthermore,
enterprises in a supply chain (e.g. manufacturer, wholesaler, etc.) have a natural
translation to agents. By adequately capturing the behavior rules of each enterprise, an
agent based model can be used to observe interactions between the enterprises and
system performance can be derived from emergent system patterns.
According to Amouzegar et al. (2008) “agent based models are already in wide
use within the DoD for force-on-force simulations but have only recently been adapted
for military logistics use.” Some simple supply chain simulations for logistics have been
done, but almost none have modeled actual organizations with sufficient detail to
adequately compare alternative policies (Amouzegar et al. 2008). This is due to the
complexity of the disparate, decentralized organizations that make up the Air Force
supply chain. One initiative that demonstrates the utility of agents for military logistics is
the Coalition Agent eXperiment (CoAX), led by the Defense Advanced Research
apparent that the following technological and social issues must be overcome for agents
to effectively be implemented for military logistics planning:
• Technological issues: logistics business process modeling, protocols, ontologies, automated information-gathering, and security
• Social issues: trusting agents to do business for you, accountability and the law, humans and agents working together, efficiency metrics, ease of use, adjustable
autonomy, adjustable visibility, and social acceptability versus optimality
(Amouzegar et al. 2008)
DARPA has also been working on an end-to-end logistics model under the
Advance Logistics Project, which was extended to the Ultra-Log project (Amouzegar et
al. 2008). As part of the Ultra-Log project, an agent based model was developed to show
how various supply-chain network topologies fare under attack (Thadakamalla et al.
2004). The model, built in Netlogo, was originally developed to analyze military supply
chain vulnerability to terrorist or military attacks (Thadakamalla et al. 2004).
For further information on ABMS for supply chains refer to (Jirong et al. 2008)
and (Sirivunnabood and Kumara 2009), both of which provide brief literature reviews.
2.4.2 ABMS for Inventory Control.
To provide a general overview of the applicability of ABMS specifically for
inventory control, this section summarizes several articles on ABMS relevant to
rather provide several examples of recent research in the area of ABMS for inventory
control.
Ito and Abadi propose an agent based model for a warehouse system composed of
three subsystems; agent based communication system, agent based material handling
system, and agent based inventory planning and control system. Warehouse systems take
care of fluctuation and uncertainty of demands from customers, and provide just-in-time
delivery of materials. That is because inventory avoids shortages, but at the cost of capital
investment, operation and maintenance, material handling, and insurance. The model,
written in Java, utilizes master agents and subagents including customer, supplier, order,
inventory, product, supplier-order, and automatic-guided vehicle (AGV) agents. With
further study proposed by the authors, the model will provide a mechanism for
autonomous setting of parameters to determine the order points or order-up-to-level point
of products based on the history of customer orders and supplier lead times. Furthermore,
the model will provide a mechanism for effective job-allocation to AGVs and scheduling
jobs of each AGV. (Ito and Abadi 2002)
Li and Li consider a multi-location inventory system with several retailers who
share one supplier. The model, built using the Anylogic software, considers demand
lead-time, replenishment lead-lead-time, and transshipment lead-time. Also the model does not
employ a central agency to decide transshipments, and retailers make their decisions
separately. Running the model led to emergent transshipments happening between
retailers when in-hand inventory and pipeline stock are not enough to meet the demand.
Furthermore, optimal inventory policies were found by considering holding, ordering,
Chen, Zhou, and Hu propose an agent-oriented Petri net model for an
inventory-scheduling model, with focus on the problems of analysis and modeling of multi-agent
systems. Petri net aims at researching the organization structure and dynamic behavior of
a system, with an eye on all possible state changes and the relation of the change in the
system. The proposed agent-oriented Petri net model is applied in modeling the inventory
scheduling of supply system. (Chen et al. 2008)
Jirong et al. propose a 4-level multi-agent system model for supply chain
inventory with a decision-making model for every enterprise agent in the supply chain.
This modeling technique was selected due to the dynamic nonlinear complexity of supply
chain inventory systems. The simulation study is conducted for the influence of lead time
and information sharing among the four agent types; retailer, wholesaler, distributor, and
manufacturer. Results confirmed that the information sharing strategy effectively
decreases the variation amplitudes of inventory of each enterprise in the supply chain.
That is, the bullwhip effect is diminished when enterprises in the supply chain share
information. (Jirong et al. 2008)
Jiang and Sheng propose a reinforcement learning algorithm combined with
case-base reasoning in a multi-agent supply chain system. Reinforcement learning is an
approach to machine intelligence that learns to achieve the given goal by trial-and-error
iterations with its environment. This is done by combining dynamic programming and
supervised learning. Recent research in this area tends to focus on mathematical or
analytical models, such as Bayesian approach, Utility Function Method, fuzzy set
the article was programmed under Java2 Development Kit (JDK) 1.5 to study the
problem of dynamic inventory control for satisfying target service level in supply chain
with nonstationary customer demand. (Jiang and Sheng 2009)
Cao et al. describe a simulation-based inventory management tool developed for
the IBM Enterprise Server Group. IBM’s supply chain involves expensive components
with high inventory carrying cost, extensive tests for components for high quality
requirements, multi-tier suppliers with long lead time, and high customer service levels
requiring complex product configuration and quick order response time. The fabrication
stage is a build-to-plan process, while the fulfillment stage is a make-to-order process.
Thus, the stages together form a hybrid process structure combined with inherent
randomness in the process that pose tremendous challenges to inventory management,
particularly in terms of financial and operational impacts. To model impact of
randomness in parameters like lead times, yields and component usage rates, the authors
developed a simulation tool with Java. With inventory costs and Days-of-Supply profiles
as outputs, the simulation tool provides decision support at an operational level. That is,
the model provides the capability to project the future inventory performance for selected
high-dollar parts in IBM Enterprise Server Manufacturing. (Cao et al. 2003)
Sirivunnabood and Kumara used an agent based simulation model to determine
appropriate risk mitigation strategies for a supply chain network under supplier risks.
Implemented in Java on the Java Agent Development (JADE) platform, the model
consists of supplier agents, plant agents, warehouse agents, customer agents, and a
controller agent. Unexpected events were randomly generated to mimic the risks that
inventories were the two risk mitigation strategies tested for four types of risks, which
were depicted by frequency and duration. (Sirivunnabood and Kumara 2009)
Krishnamurthy et al. consider a new inventory control technique for large-scale
supply chains, which considers stochastic transport delays, manufacturing times, and
repair times and probabilistic characterization of part repair success. Because stochastic
disturbances enter at both ends of a bidirectional supply chain and the necessity for
overly simplified assumptions, optimization techniques for inventory control for
bidirectional stochastic supply chains are computationally intractable. For this reason the
paper provides an agent based simulation model of aircraft supply chain involving
multiple original equipment manufacturers (OEMs), depots, bases, squadrons, and planes.
ABMS was used to avoid explicitly modeling inventory dynamics for each site and
formulating complex coupling signals between the sites. With an adaptive feature, the
model can adjust stock levels with the objective of reducing excess inventory and
maintaining or increasing mission capability of aircraft. The simulation was written in
Python language. Output from the model can be used to determine the number of parts of
each part type that each site should order from its associated supplier site, and the number
of parts of each part type to start manufacturing. (Krishnamurthy et al. 2008)
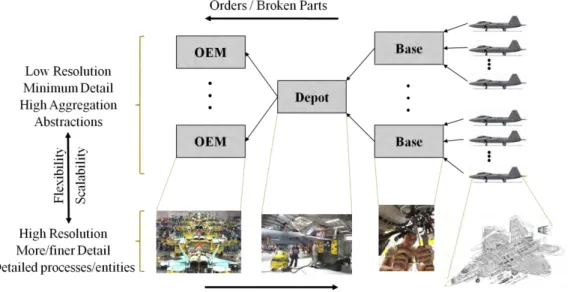
While ABMS is applicable to supply chains, as depicted in this section and the
previous section, there must be consideration of efficiency in implementing ABMS for
large supply chains. For ABMS to be truly helpful in analyzing large supply chains there
must be a wide range of fidelity within a single model to analyze questions at different
interest, it is recommended to instill the concept of variable resolution in developing
agent based simulation models.
2.4.3 Variable Resolution Modeling.
Variable resolution modeling is defined by Davis and Hillestad (1993) as
“building new models or model families so that users can change readily the resolution at
which phenomena are treated.” Seamless design refers to designing models such that
change in resolution occurs with (a) smooth consistency of representation and (b)
consistency of prediction (Davis and Hillestad 1993). In other words, when “zooming”
within a model there are no mental disruptions and there is some confidence that the
results are consistent (Davis and Hillestad 1993).
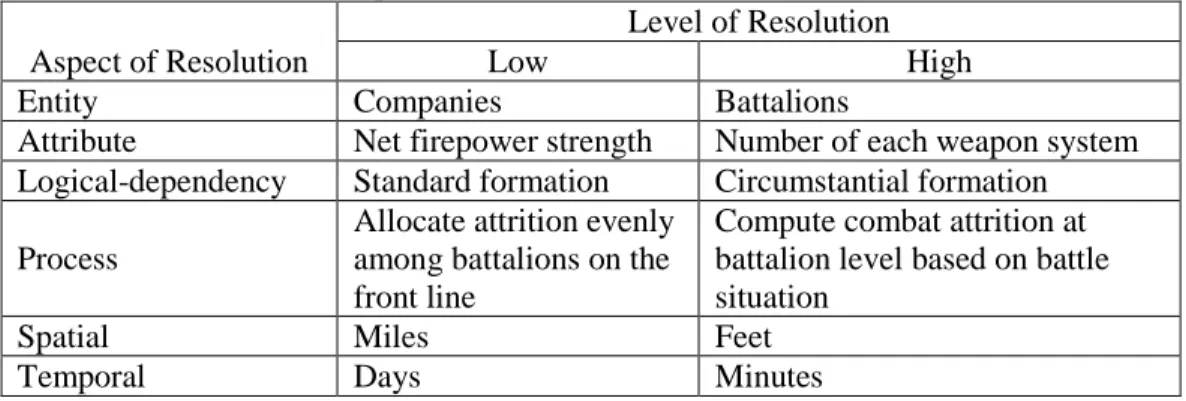
When modeling, resolution can refer to entities, attributes, logical dependency,
processes, spatial orientation, or temporal orientation. Table 6 provides military examples
of how these six aspects of a model may change with levels of resolution.
Table 6 - Aspects of Resolution (Davis and Hillestad 1993) Aspect of Resolution
Level of Resolution
Low High
Entity Companies Battalions
Attribute Net firepower strength Number of each weapon system
Logical-dependency Standard formation Circumstantial formation
Process
Allocate attrition evenly among battalions on the front line
Compute combat attrition at battalion level based on battle situation
Spatial Miles Feet
Temporal Days Minutes
Low resolutions models are used for initial cuts, comprehension, systems analysis
and policy analysis, decision support, adaptability, low cost and rapid analysis, and
making use of low-resolution knowledge and data (Davis and Hillestad 1993). High
simulating reality, calibrating or informing lower-resolution models, and making use of
high-resolution knowledge and data (Davis and Hillestad 1993).
Three principal approaches can be used to achieve variable resolution modeling,
namely, selected viewing, alternative sub models (or model families), and integrated
hierarchical variable resolution (IHVR) (Davis and Hillestad 1993). Selected viewing
uses the one high resolution model and simply hides logic for low resolution models. The
alternative sub models approach consists of different models for levels of resolution and
users merely switch to the model corresponding to the desirable level of resolution. IHVR
refers to modeling that describes critical processes as being composed hierarchically of
subordinate processes and resolution changes by replacing higher-level processes with an
approximation, or trivial process, depicted by lookup tables (Davis and Hillestad 1993).
2.4.4 Summary.
Literature provided in this section demonstrates the natural fit of agent based
modeling and simulation for modeling supply chains. Our research extends the agent
based model presented in Krishnamurthy et al. (2008), with addition of other types of
agents and more output measures. In addition, our research includes the development of
guidelines for aggregation / disaggregation of supply chain agents and interactions to
allow for easy scalability in terms of fidelity to fit the needs of the analysis. While the
work done on variable resolution modeling is a generalization for any modeling
technique, the guidelines are specific for development of agent based models. The
is the complexity of message passing and agent processes / methods. Thus our research
extends the concepts of variable resolution modeling to ABMS.
2.5 Supply Chain Risk Measurements and Metrics
Sink and Tuttle (1989) claim that you cannot manage what you cannot measure.
Parker (2000) expands on this statement with the following purposes of measuring
organizational performance: identify success; identify whether customer needs are met;
help the organization to understand its processes and to confirm what they know or reveal
what they do not know; identify where problems, bottlenecks, waste, etc. exist and where
improvements are necessary; ensure decisions are based on facts, not on supposition,
emotion, faith or intuition; and show if improvements planned actually happened.
2.5.1 Performance Measures.
A performance measurement can be defined as “a set of metrics used to quantify
the efficiency and/or effectiveness of an action (Neely et al. 1995).” A metric “refers to
definition of the measure, how it will be calculated, who will be carrying out the
calculation, and from where the data will be obtained (Neely et al. 1995).” Table 7
provides several performance measurement categories in logistics and supply chain, and
Table 8 provides several supply chain metrics that are found in those measurement
frameworks. For listing of literature on each performance measurement from Table 7
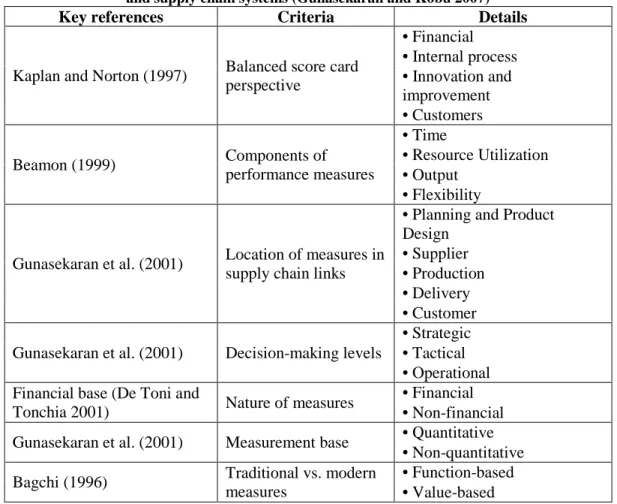
Table 7 - Categories of performance measurement in logistics and supply chain systems (Gunasekaran and Kobu 2007)
Key references Criteria Details
Kaplan and Norton (1997) Balanced score card perspective • Financial • Internal process • Innovation and improvement • Customers Beamon (1999) Components of performance measures • Time • Resource Utilization • Output • Flexibility
Gunasekaran et al. (2001) Location of measures in supply chain links
• Planning and Product Design
• Supplier • Production • Delivery • Customer Gunasekaran et al. (2001) Decision-making levels
• Strategic • Tactical • Operational Financial base (De Toni and
Tonchia 2001) Nature of measures
• Financial • Non-financial
Gunasekaran et al. (2001) Measurement base • Quantitative
• Non-quantitative
Bagchi (1996) Traditional vs. modern
measures
• Function-based • Value-based
The AF logistics community uses the balanced scorecard perspective, but has
modified the perspectives from Customer, Processes, Finance, and Learning and Growth
to be Warfighter, Logistics Processes, Resource Planning, and Innovation and Learning
(JDMAG 2010). Along with the balanced scorecard, another performance measurement
category from Table 7 that aligns well with the AF is the decision-making levels, i.e.
2.5.2 Industry / Commercial Metrics.
Table 8 - Supply Chain Performance and Risk Metrics
Metrics Source
Value-at-Risk (VAR) (Poojari et al. 2008)
Conditional-Value-at-risk (CVAR) (Poojari et al. 2008)
Visibility index
(Caridi et al. 2010) (Gunasekaran et al. 2001) -quantity of exchanged information
-information quality in terms of accuracy
-information freshness
Total distribution costs (Caridi et al. 2010) (Gunasekaran et al. 2001)
(Gunasekaran and Kobu 2007) (Brewer and Speh 2000)
Inventory holding cost (per unit, per square foot) (Caridi et al. 2010) (Gunasekaran and Kobu 2007) (Chan and Qi 2003) (Brewer and Speh 2000)
Backorder penalty costs (Caridi et al. 2010) (Gunasekaran and Kobu 2007)
Variance of profits (Li and Zhao 2009)
Difference of variances of profits (Li and Zhao 2009)
Cash-to-cash cycle time (Manuj and Mentzer 2008) (Farris and Hutchison 2002)
(Brewer and Speh 2000)
Logistics cost per unit (Brewer and Speh 2000)
Organizational costs (Neureuther and Kenyon 2009)
Probabilistic financial risk (You et al. 2009)
Return on investment (Min and Zhou 2002) (Gunasekaran et al. 2001)
(Brewer and Speh 2000)
Return on supply chain assets (consumer profitability /
average supply chain assets deployed during the period) (Brewer and Speh 2000)
Percentage of supply chain target costs achieved (Brewer and Speh 2000)
Inventory level (Caridi et al. 2010) (Manuj and Mentzer 2008)
(Kleijnen and Smits 2003)
Inventory productivity (Chan and Qi 2003)
Working inventory rate (percentage of working
inventory to total inventory held) (Chan and Qi 2003)
Stock unit utilization (storage space utilization) (Chan and Qi 2003) Flow rate (ratio of inventory level to average inventory
cycle time) (Chan and Qi 2003)
Service level (Caridi et al. 2010) (Gunasekaran et al. 2001)
Service level compared to competitors (Gunasekaran et al. 2001)
Customer perception of service (Gunasekaran et al. 2001) (Brewer and Speh 2000)
Fill rate (also confirmed fill rate) (Caridi et al. 2010) (Kleijnen and Smits 2003) (Chan and Qi 2003) (Brewer and Speh 2000)
Metrics Source
Order cycle time (time for order entry, planning,
sourcing, assembly and follow up time, and delivery) (Gunasekaran et al. 2001) (Brewer and Speh 2000)
cycle efficiency (total value-added / total time in supply
chain) (Brewer and Speh 2000)
Delivery performance (Caridi et al. 2010)
Number of "perfect orders" (Gunasekaran et al. 2001) (Brewer and Speh 2000)
Stock-outs (stockout rate) (Manuj and Mentzer 2008) (Chan and Qi 2003)
Delays to customers (Manuj and Mentzer 2008) (Kleijnen and Smits 2003)
Product availability (Caridi et al. 2010)
Flexibility (Caridi et al. 2010) (Qiang and Jingjuan 2010)
(Gunasekaran et al. 2001)
Responsiveness (Caridi et al. 2010)
Quality (Caridi et al. 2010)
Structural reliability (Neureuther and Kenyon 2009)
Consequence score (Neureuther and Kenyon 2009)
Process efficiency (Neureuther and Kenyon 2009) (Gunasekaran and
Kobu 2007)
Risk index (Neureuther and Kenyon 2009)
Risk factor (probability of occurrence of threat *
consequence * value of asset) (Pai et al. 2003)
Risk factor aggregate (combination of all risks) (Yan et al. 2008) Exposure (number of different types of risk events that
occur in a given time period) (Manuj and Mentzer 2008)
Coherent risk measure (Ahmed et al. 2007)
Supply disruptions (Manuj and Mentzer 2008)
Recovery capability (Craighead et al. 2007)
Warning capability (Craighead et al. 2007)
Downside risk (You et al. 2009)
Upper partial mean (You et al. 2009)
Risk premium (basis for a rational balance between
expected value of investment performance and variance) (You et al. 2009)
Resiliency (Zongxue et al. 1998)
Vulnerability (Zongxue et al. 1998)
Logistics index (Hausman et al. 2005)
Premium freight usage (Manuj and Mentzer 2008)
Asset utilization
(Min and Zhou 2002) (Gunasekaran et al. 2001) -net asset turns (ratio of total gross revenue to working
capital)
-inventory turns (ratio of annual costs of goods sold to
average inventory investment)
-cube utilization (ratio of space occupied to space