INFLUENCE
OF
CLIMATE
VARIABILITY
ON
SOUTH
AFRICAN
ELECTRICITY
PRODUCTION
MARK
MAJODINAUniversity of Pretoria, Department of Geography, Geoinformatics and Meteorology, South Africa mark.majodina@weathersa.co.za
Copyright © 2015 by the University of Pretoria. Permission granted to IAMOT to publish and use. ABSTRACT
Climate variability may play an important role in the South African electricity production. Several
studies were conducted in the past to investigate the factors which modulate the national electricity
production. This study investigates the influence of the Southern Oscillation Index (SOI) as a proxy of
climate variability in South Africa, on national electricity production over a 27‐year period from
1985‐2011. Various linear statistical tools were used to study the electricity consumption trends in
South Africa, the SOI trends and variability, the annual temperature distribution over the country,
the SOI‐electricity consumption correlation and periodicity in the national electricity production. The
results have shown a statistically‐significant relationship between the SOI and national electricity
production. Further results showed the inverse relations between South African surface
temperatures and electricity production, particularly in the coastal regions. A spectral analysis on the
detrended electricity production data also revealed cycles which include the SOI signal of 3.85 years.
The results in this study will assist in understanding the modulation of electricity production and also
contribute to the prediction of the electricity production, particularly in the current changing climate
environment.
Keywords: Climate variability, climate change, electricity production, Southern Oscillation Index INTRODUCTION
Weather and climate variability influence many socio‐economic sectors all over the globe. The
energy sector is one of the most sensitive sectors to meteorological influences (Valor, Meneu, and
Caselles, 2001:1413). The use of electrical energy in South Africa has grown over the past several
decades and reached critical levels where demand has occasionally outstripped the supply. The
critical nature of the energy sector has put pressure on decision‐makers and planners in South Africa
to understand the influences and improve modelling of electricity demand. This research study is
focussed on the influence of meteorological parameters on electricity demand in South Africa,
particularly at a climate scale. Electricity demand in South Africa
The national demand for electricity has significantly increased in recent years leading widespread
rolling blackouts and load‐shedding as that witnessed in 2007 and 2008. These periods where
demand exceeded supply were attributed in various media and government sources to general
increase in the South African electricity demand, limited supply of coal and also skills shortages (DoE,
2008). During the period 1995‐2003, South Africa has witnessed the rapid rise in the electrification
of rural and urban areas. Figure.1 shows the steady increase of electricity production over South
Africa at an approximate rate of 4615 GWh/year. This was in response to the government’s National
new connections achieved between 1994 and 2001 (NER, 2003). This significant increase in
electricity demand has resulted in the construction of new multi‐billion power‐stations such as the
Eskom’s Medupe power station and electricity‐saving campaigns. The near‐capacity levels of
electricity in 2008, led to the hiking of electricity prices in order for Eskom to embark on a massive
programme to upgrade and expand the country’s electricity infrastructure. These plans entailed a
budget spending of R 385 billion over a 5 year period (Eskom, 2008).
Climate Change and linkage with electricity production
The advent of global climate change with characteristic increases in frequency and intensity of
severe weather events is presenting additional burden on the national electricity production, in
terms of managing electricity demand peaks (IPCC, 2007). The South African Department of Science
and Technology in response to the threat of climate change elaborated in the South Africa’s Climate
Change Technology Needs Assessment Synthesis Report, the potential technologies towards climate
change adaptation and mitigation. In this report, the increasing use of air conditioners was projected
as a response to hotter climate as a result of climate change. This report recommended the use of
the continuously improving weather forecast products as a method towards climate change
adaptation (DST, 2007). Numerous studies in the India, United States and Europe have found the
linkages between electricity loadings and weather conditions. Specifically, many studies have shown
that changing weather conditions, particularly temperatures represent a major source of variation in
electricity peak demand forecasting (Ghosh, 2008:471; Goia, May andFusai, 2010:706; Hekkenberg,
Benders, Moll and Schoot, 2009:1549; Makridakis, Wheelwright, and Hyndman, 1998:22; Munoz
and Felicisimo, 2004:290 and Pilli‐Sihvola, Aatola, Ollikainen and Tuomervita, 2010:2412, Valor et al.,
2001:1418). Crowley and Joutz. (2005:25) established that general weather and specifically
temperatures were important drivers for electricity consumption. The latter study also established
that over 40% of end‐user energy consumption was related to heating and cooling needs in the
residential and commercial sectors. In support, Teisberg, Weiher and Khotanzad (2005:1769) also
established that temperature was a key weather variable affecting the demand for electricity,
particularly in regions where there was heavy use of air conditioning. Similar weather influences
were also found in the second largest electricity producer in the world, China (Lin, 2003). In South
Africa, Sigauke and Chikobvu (2010: 108) successfully demonstrated the important use of y = 4615x + 127556 0 50000 100000 150000 200000 250000 300000 19 85 19 87 19 89 19 91 19 93 19 95 19 97 19 99 20 01 20 03 20 05 20 07 20 09 Electricity production in GWh Years
Fig 1 Annual Total Electricity production (1985-2011)
Annual Total Electricity production 129276
temperatures in the daily (or short‐term) peak electricity load forecasting. The use of meteorological
parameters in seasonal/ long term electricity demand forecast within South Africa was however
relatively absent in the most recent and extensive studies of the econometrics model and the CSIR
statistical approach.
The El Niño/La Niña‐Southern Oscillation (ENSO) is defined as a quasi‐periodic climate pattern that
occurs across the tropical Pacific Ocean roughly every five years. It is characterized by variations in
the temperature of the surface of the tropical eastern Pacific Ocean—warming or cooling known as El Niño and La Niña respectively—and air surface pressure in the tropical western Pacific—the Southern Oscillation (Trenberth, 1997:2775). ENSO variability causes extreme weather conditions
(such as floods and droughts) in many regions of the world. In Southern Africa, a number of leading
scientists have successfully linked the remote Southern Oscillation Index (SOI) index i.e. the index for
ENSO, with the Southern African temperatures and rainfall (Harangozo and Harrison, 1983:413;
Harrison, 1983:413; Schulze, 1983:84; Nicholson, 1986:474; Taljaard 1986: 2776; van Heerden,
Terblanche and Schulze, 1988:583; Karoly, 1989:1243; Walker, 1990:3306; d’Abreton and Lindesay,
1993:54; Mason, 1995:129; Mason and Jury, 1997:47). SOI is a widely used index globally in weather
and climate studies. It has minor geographical biases and erratic data that are common in local
rainfall and temperature data.
This research study aims to investigate the existence of a linkage between the South African
electricity production and the Southern Oscillation Index (as an approximation of South African
weather and climate). Objectives
The objectives of this research study are to:
i. Demonstrate the association of El Nino Southern Oscillation (ENSO) with electricity
production in South Africa;
ii. Expand on the existing knowledge regarding remote geophysical factors which have an
impact on the South African long‐term electricity production.
The research paper is structured as follows. The next section identifies the leading theories in
electricity demand forecasting in South Africa and proposes the factoring of meteorological
parameters. The subsequent section describes the data used in the study and elaborates on the
research methodology used. Section 4 introduces the key results in the relationship of the SOI and
electricity production. The final section summarizes the most relevant conclusions drawn from the
study and recommendations for future research. PROPOSED MODEL OR CONCEPTUAL METHOD
The dominant literature in seasonal or long term energy demand forecasting in South Africa revolves
around the following two main theories:
i. Econometrics model – this is the statistical model led by Van Wyk (2009) and Inglesi
(2010:203) This model is based on the economic theory and has incorporated price elasticity
into the modelling of electricity demand (Belli, Anderson, Barnum, Dixon and Tan 2001:27).
ii. CSIR electricity demand model – this is a statistical regression model which has analysed
electricity demand into specific and key sectors viz. Agriculture, Domestic electricity,
Commerce and Manufacturing, Mining, Transport. The individual sector models were
combined to forecast the total national electricity demand. The identified drivers or
predictors in these various sectors included Mining index, Platinum production index, Final
Consumption Expenditure of Households (FCEH), population, Manufacturing index, treated
gold ore and coal production index.
This research study proposes a model where the SOI is factored into a statistical regression model to
analyse electricity demand, once a significant correlation is established between SOI and electricity
production data.
RESEARCH METHODOLOGY
The Southern Oscillation Index (SOI) is a standardized index based on the observed sea level
pressure differences between Tahiti and Darwin, Australia. The SOI is one measure of the large‐scale
fluctuations in air pressure occurring between the western and eastern tropical Pacific (i.e. the state
of the Southern Oscillation) during El Niño and La Niña episodes. In general, smoothed time series of
the SOI correspond very well with changes in ocean temperatures across the eastern tropical Pacific.
The SOI was used in this study as an approximation of South African weather and climate variability.
This approximation was selected due to the following reasons:
i. Existing global, peer reviewed scientific literature affirming the significant correlation
between the SOI and Southern African rainfall and temperature records;
ii. The modern and regular use in South Africa of SOI in seasonal rainfall and temperature
forecasts;
iii. The erratic nature and strongly irregular spatial distribution of rainfall in South Africa;
iv. The rapid temperature changes attributable to varying altitude (high );
v. The freely available high quality‐controlled monthly SOI data.
The SOI data used in this research study was obtained freely from reliable global sources via the
internet. The data sources include StatSA
(http://www.statssa.gov.za/timeseriesdata/main_timeseriesdata.asp), the U.S.’s National Center for
Atmospheric Research ‐Global Climate and Dynamics Division
(http://www.cgd.ucar.edu/cas/catalog/climind/soi.html) and also the South African Weather
Service. On the other hand, data on total national electricity consumption in GWh for South Africa
from 1985 to 2011 were obtained from Statistics South Africa (StatsSA) from Statistical release
P4141 – Generation and Consumption of electricity
(http://www.statssa.gov.za/timeseriesdata/main_timeseriesdata.asp). This StatsSA data is reported
as the total electricity available for distribution in South Africa which includes losses. Values are
reported per month, and for the purpose of these study, the monthly data was aggregated into a
calendar year, i.e. January to December. In addition, surface mean temperature data for ten weather
stations were obtained from the South African Weather Service for the corresponding period.
Monthly means were used and aggregated into a year in order to determine relations with electricity
The data used in this study is summarized in Table 1.
Correlation analysis was also used in this study to evaluate the strength of the linear relations
between variables. The strength of linear association between two numerical variables is
determined by the correlation coefficient, r, whose range is ‐1 to +1. The sign (positive or negative)
of the correlation denotes the sign of the slope of a straight line. The sample correlation (r) is
derived from the coefficient of determination (R2)
R2 = = (3.1)
The correlation coefficient r √ (3.2)
Numerous statistical significance test were used to determine meaningful associations between
variables in order to infer relations and create an understanding of the underlying physical
processes involved.
In addition, spectral analysis (using the Fast Fourier Transform), was performed in the Electricity
production data to investigate cycles in order to understand the underlying dynamics and
associations with weather and climate. Spectral analysis is used to describe the tendency of a series
to show oscillations of a given frequency. The time series of a variable is represented as a sum of
sine squares of different periods. This procedure uses the Fast Fourier Transform (FFT) which works
on equally spaced values and plots the squared amplitude of the sinusoids. Spectral analysis is a
modification of Fourier analysis so as to make it suitable for stochastic process. Periods or cycles in
the electricity production may be due to non‐linearity or interactions between high frequencies.
Therefore caution should be taken when applying spectral analysis method in identifying cycles or
periods. A possibility of adding artificial periods to the data set may be encountered with filtering.
The periodigram represented hidden cycles in a series. In this study, spectral analysis was performed
on the monthly electricity production data, utilizing a Matlab script to identify periodicities. A
detrending mechanism was also used before the spectral analysis to reduce the risk of
contaminating the results with the expected trend.
Table 1. Table 1 summarizes the data used in this research study
Data source and variable Period
South African Weather Service (SAWS), Monthly Temperature data
from 10 SAWS weather stations (Bloemfontein, Cape Town, De Aar,
Durban, East London, George, Johannesburg, Mthatha, Port Elizabeth,
Polokwane
1985‐2011 (27 years)
United States’ National Center for Atmospheric Research ‐Global Climate and Dynamics Division, Southern Oscillation Index (SOI), monthly
1985‐2011 (27 years)
StatsSA, Electricity consumption data (monthly) 1985‐2011 (27 years)
RESULTS
The main results of the study are as follows:
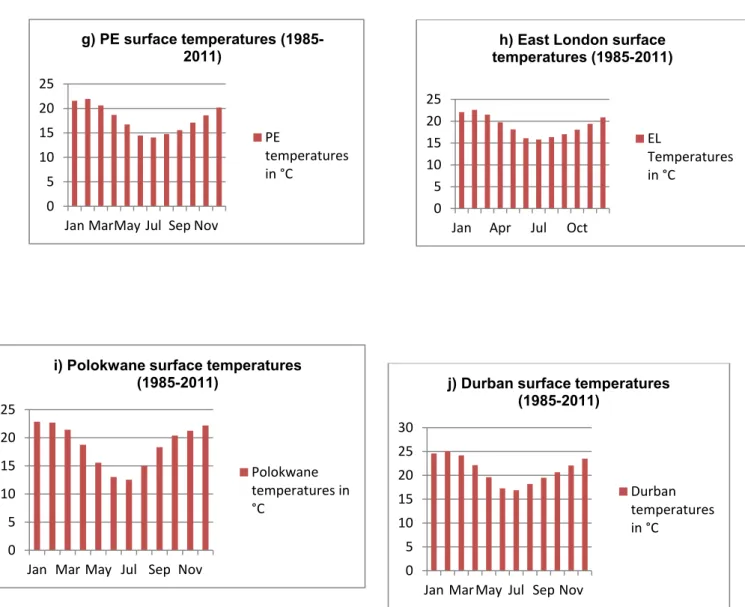
The annual temperature variability patterns throughout the country were homogenous with
distinct temperature maxima in the months of November, December and January (summer).
The temperature minima were observed in each of the 10 selected stations during May,
June and July (winter) in Fig 2 below.
0 5 10 15 20 25
a)Mthatha surface temperatures (1985-2011) Temperatures in °C 0 5 10 15 20 25
Jan Apr Jul Oct
b) Cape Town surface temperatures (1985-2011) Cape Town temperatures in °C 0 5 10 15 20 25 30
Jan Mar May Jul Sep Nov
c) De Aar surface temperatures (1985-2011) Temperature in °C 0 5 10 15 20 25 d) Johannesburg surface temperatures (1985-2011) Johannesburg temperatures in °C 0 5 10 15 20 25
Jan Apr Jul Oct
e) George surface temperatures (1985-2011) George temperatures in °C 0 5 10 15 20 25
Jan Mar May Jul Sep Nov
f) Bloemfontein surface temperatures (1985-2011)
Bloemfontein temperaturesin °C
Figure 2 a‐j depicting the temperature minima during winter months and maxima in the summer months.
The correlation between the surface temperatures and electricity production generally show a
negative relationship between the two variables but strongest negative and significant correlations
in the Eastern Cape Province (George, Port Elizabeth and East London ‐in bold). Weaker negative
correlations were also found in other coastal cities (in italics) viz. Cape Town and Durban. The
correlation results suggested the strongest influence of temperatures on electricity production in the
coastal cities of South Africa. The correlation results are summarized in the Table 2 below:
Table 2 showing correlations of surface temperatures and electricity production at the 10 selected South African weather stations
City name Correlation coefficient
Mthatha ‐0.24 Cape Town ‐0.34 De Aar ‐0.13 Johannesburg +0.04 0 5 10 15 20 25
Jan Apr Jul Oct
h) East London surface temperatures (1985-2011) EL Temperatures in °C 0 5 10 15 20 25 30
Jan Mar May Jul Sep Nov
j) Durban surface temperatures (1985-2011) Durban temperatures in °C 0 5 10 15 20 25
Jan MarMay Jul Sep Nov
g) PE surface temperatures (1985-2011) PE temperatures in °C 0 5 10 15 20 25
Jan Mar May Jul Sep Nov
i) Polokwane surface temperatures (1985-2011)
Polokwane temperatures in °C
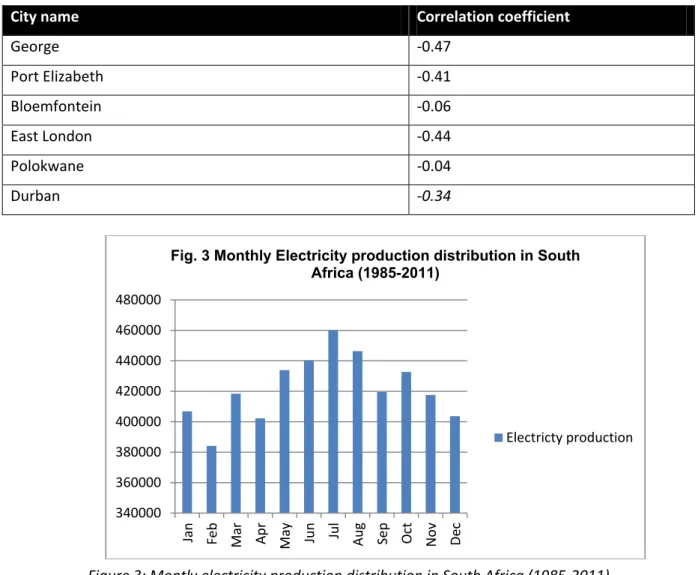
City name Correlation coefficient George ‐0.47 Port Elizabeth ‐0.41 Bloemfontein ‐0.06 East London ‐0.44 Polokwane ‐0.04 Durban ‐0.34 Figure 3: Montly electricity production distribution in South Africa (1985‐2011)
The country’s electricity production peaked during winter months and levelled off in the
warmer summer months (Fig. 3) suggesting an inverse relationship with the surface
temperatures in Fig. 2.
An increasing trend of electricity production in South Africa throughout the study period of
1985‐2011 was found at an approximate rate of 4616GWh/ year. This trend is in line with
the increasing local demand and also the government’s mass electrification programme
which began in 1991. A disruption of this trend was identified in recent years and coincided
with the rolling blackouts of 2008.
A significant, positive but mild relationship (r = +0.38) was observed between the monthly
SOI and South African electricity production values leading to the acceptance of the null
hypothesis which was posited in this study i.e. “The Southern Oscillation Index (SOI) has a
significant association with long term South African electricity demand”
Spectral analysis of South African Electricity production showed the highest peak at 6.75
years, followed by 13.5 years and 3.85 years, with the latter period being associated in
previous studies with the ENSO signal or SOI. This is a further support to the null hypothesis
and has indicated that SOI is one of the important contributing factors to electricity
production in South Africa (Fig 3). 340000 360000 380000 400000 420000 440000 460000 480000 Jan Feb Mar Ap r Ma y
Jun Jul Aug Sep Oc
t
Nov De
c
Fig. 3 Monthly Electricity production distribution in South Africa (1985-2011)
Figure 4. Periodicity of electricity production in South Africa (1985‐2011)
CONCLUSIONS AND RECOMMENDATIONS
This research study exposed the important role which the SOI played in electricity production in
South Africa. The correlation found between the SOI and Electricity production although statistically
significant was mild (r=0.38) and only explained a relatively small fraction of the variance
(approximately 16%). This implied the potential existence of non‐linear relations between the
variables and which necessitate the use of more complex statistical tools such as Principal
Component Analysis, Multiple regression models, Auto‐regression etc. This study could therefore be
pursued further using these analyses and could introduce other related variables such as Quasi‐
Biannual Oscillation (QBO), Solar cycle etc. which were suggested by the spectral analysis results on
the electricity production data. The future study could furthermore expand to neighbouring
Southern African countries which are also affected by the same ENSO signal. Finally, it is also
recommended that the future study investigates the impact of climate change on electricity
distribution and transmission faults. This is particularly important as we face the advent of climate
change which is characterised by increasing frequency and magnitude of severe weather events and
climate episodes.
ACKNOWLEDGEMENTS
The work produced in this research could not have been possible without the support of the CSIR
team who provided valuable information on the prediction model of electricity production in South
Africa. The data used in this project was obtained with assistance from the South African Weather
wisdom and support of Dr. Jorg Lalk is greatly appreciated. Prof. H. Rautenbach provided research
guidance on the potential climate change impacts on electricity distribution and transmission faults.
Dr. Henry Mulenga from the Mathematics Department, Copperbelt University of Zambia provided
excellent guidance on the mathematical and statistical interpretations. The family support and also
the assistance from the South African Weather Service colleagues are also greatly acknowledged. REFERENCES
Belli, P., Anderson J. R., Barnum, H. N., Dixon, J. A. And Tan, J. 2001. Economic Analysis of Investment Operations. Analytical tools and practical applications. WBI Development Studies. Washington D. C:
The World Bank.
Crowley, C. and Joutz, F. L. 2005. Weather effects on electricity loads: Modeling and forecasting.
Final report EPA. Washington D.C., USA.
d’Abreton, P. C., and J. A. Lindesay, 1993: Water vapour transport over southern Africa during wet
and dry early and late summer months. Meteorology and Atmospheric Physics, 55, pp.47–59.
Davidson, O. and Mwakasonda S. A. 2004. Electricity access for the poor: a study of South Africa and
Zimbabwe. Energy for Sustainable Development. Volume VIII, No. 4. pp.26‐40.
Department of Energy (DoE) 2008. National Response to South Africa’s Electricity shortage. Interventions to address electricity shortages. Department of Energy. Available from:
http://www.info.gov.za/view/DownloadFileAction?id=77837 [Accessed 3 August 2012]
Department of Science and Technology (DST) 2007. South African Climate Change Technology needs Assessment. Department of Science and Technology. Available from:
http://unfccc.int/ttclear/sunsetcms/storage/contents/stored‐file‐
20130313150002738/South%20Africa.pdf [Accessed 15 August 2012]
ESKOM, 2008. Eskom New Build Programme. [Online]. Available from:
http://www.eskom.co.za/c/21/capacity‐expansion‐status/ [Accessed 19 June 2012]
Ghosh, S. 2008. Univariate time‐series forecasting of monthly peak demand of electricity in northern
India, International Journal of Indian Culture and Business Management, 1, pp.466‐474.
Goia, A., May, C. and Fusai, G. 2010. Functional clustering and linear regression for peak load
forecasting, International Journal of Forecasting, Vol 26 (4), pp.700‐711.
Harangozo, S., and Harrison M. S. J., 1983. On the use of synoptic data indicating the presence of
cloud bands over southern Africa. South African Journal of Science, 79, pp.413–414.
Harrison, M. S. J., 1983. The Southern Oscillation, zonal equatorial circulation cells and South African
rainfall. In: First International Conference on Southern Hemisphere Meteorology, Sao˜ Jose´ dos
Campos, Brazil, American Meteorology Society, 302–305. [Preprints]
Hekkenberg, M. Benders, R. M. J., Moll, H. C., and Schoot A. J. M. 2009. Indication for a changing
electricity demand pattern: The temperature dependence of electricity demand in the Netherlands, Energy Policy, 37, pp.1542‐1551.
Inglesi, R. 2010. Aggregate electricity demand in South Africa: Conditional forecasts to 2030, Applied Energy, 87, pp.197 – 204.
IPCC, 2007: Climate Change 2007. Impacts, Adaptation and Vulnerability. Contribution of Working Group II to the Fourth Assessment Report of the Intergovernmental Panel on Climate Change, Parry,
M. L., Canziani, .O.F., Palutikof, J.P., van der Linden P.J. and
Hanson, C.E. eds., Cambridge: Cambridge University Press, 976pp.
Karoly, D. J., 1989. Southern Hemisphere circulation features associated with El Nino–Southern
Oscillation events. Journal of Climate, 2, pp.1239–1252.
Lin, B. Q. 2003. Electricity demand in the Peoples’ Republic of China: Investment requirement and environmental impact. ERD Working Paper No. 37. Beijing: Asian Development Bank. Available from:
http://www.scribd.com/doc/153854849/Electricity‐Demand‐in‐the‐People‐s‐Republic‐of‐China‐
Investment‐Requirement‐and‐Environmental‐Impact [Accessed 18 December 2012].
Makridakis, S.G., Wheelwright, S.C. and Hyndman, R. J. 1998. Forecasting methods and applications,
3rd Edition, New York: Wiley and Sons.
Mason, S., 1995. Sea‐surface temperature–South African rainfall associations,
1910–1989. International Journal of Climatology, 15, pp.119–135.
Mason, S. and Jury, M. 1997: Climatic variability and change over southern Africa: A reflection on
underlying processes. Progress in Physical Geography, 21, pp23–50.
Munoz, J. and Felicisimo, A. M. 2004. Comparison of statistical methods commonly used in
predictive modelling, Journal of Vegetation Science, 15. pp.285‐292.
NER, 2003. Electricity supply statistics for South Africa. [Online] Available from:
http://www.energy.gov.za/files/publications_frame.html [Accessed 8 April 2012]
Nicholson, S. E. 1986. Rainfall variability in southern and equatorial Africa: Its relation to Atlantic sea
surface temperatures and the Southern Oscillation. In: Second International Conference on Southern Hemisphere Meteorology, Wellington. Available from: American Meteorological Society 2nd
International Conference on SH Extended Abstracts, pp.472–475.
Pilli‐Sihvola, K., Aatola, P., Ollikainen, M. and Tuomenvirta, H. 2010. Climate change and electricity
consumption – Witnessing increasing or decreasing use and costs, Energy Policy, 38 (5), pp.2409‐
2419.
Schulze, G. C., 1983. ’n Moontlike verband tussen die Suidelike Ossilasie/El Nino verskynsels en
droogtes oor die somerreenvalstreke van Suid‐Afrika. ’n Voorlopige studie (A possible relationship
between the Southern Oscillation/El Nino occurrence and drought in the summer rainfall region of
South Africa). South Africa Weather Bureau Newsletter, 410, pp. 79–85.
Sigauke, C. and Chikobvu, D. 2010. Daily peak electricity load forecasting in South Africa using a
multivariate non‐parametric regression approach., Operations Research Society of South Africa, 26
(2), pp.97‐111.
Statistics South Africa, 2009. StatsSA Interactive Data. [Online] Available from:
http://www.statssa.gov.za/timeseriesdata/main_timeseriesdata.asp [Accessed 11 January 2011]
Taljaard, J. J., 1986. Contrasting atmospheric circulation during dry and wet summers in South Africa. South African Weather Bureau Newsletter, 445, pp.1–5.
Teisberg, T. J., Weiher, R. F and Khotanzad, A. 2005: The Economic Value of Temperature Forecasts
Trenberth, K. E. 1997. The definition of El Nino. Bulletin of American Meteorological Society, 78,
pp.2771‐2777.
Valor, E., Meneu, V. and Caselles, V. 2001. Daily air temperature and electricity load in Spain, Journal of Applied Meteorology, 40, pp.1413‐1421.
van Heerden, J., Terblanche, D. E. and Schulze, G. C. 1988. The Southern Oscillation and South
African summer rainfall. Journal of Climatology, 8, pp.577–597.
Van Wyk, L. 2009. Regression analysis to estimate South Africa’s Electricity demand. In: ESKOM Conference on Forecasting in an ever changing environment. 17 November 2009 Johannesburg.
[Eskom Report] Document Reference Number: CSIR/BE/LQM/2010/0044/B.
Walker, N. D., 1990. Links between South African summer rainfall and temperature variability of the