REGIONAL DATA ARCHIVING AND
MANAGEMENT FOR NORTHEAST ILLINOIS
Prepared By
Sharan Dhanaraju
Yanfeng Ouyang
Umit Deniz Tursun
University of Illinois at Urbana-Champaign
Research Report ICT-09-050
A report of the findings of
ICT-R27-22
Regional Data Archiving and Management for Northeast Illinois
Illinois Center for Transportation
June 2009
CIVIL ENGINEERING STUDIES
Illinois Center for Transportation Series No. 09-050 UILU-ENG-2009-2024
Technical Report Documentation Page
1. Report No.
FHWA-ICT-09-050
2. Government Accession No. 3. Recipient's Catalog No.
4. Title and Subtitle
Regional Data Archiving and Management for Northeast Illinois
5. Report Date
June 2009
6. Performing Organization Code
8. Performing Organization Report N o. 7. Author(s)
Sharan Dhanaraju, Yanfeng Ouyang, Umit Deniz Tursun ICT-09-050 UILU-ENG-2009-2024
9. Performing Organization Name and Address
Illinois Center for Transportation
University of Illinois at Urbana-Champaign
Department of Civil and Environmental Engineering 205 N. Mathews Ave, MC 250
Urbana, IL 61807
10. Work Unit ( TRAIS)
11. Contract or Grant No.
ICT-R27-22
13. Type of Report and Period Covered
12. Sponsoring Agency Name and Address
Illinois Department of Transportation Bureau of Materials and Physical Research 126 East Ash Street
Springfield, IL 62704
14. Sponsoring Agency Code
15. Supplementary Notes
16. Abstract
This project studies the feasibility and implementation options for establishing a regional data archiving system to help monitor and manage traffic operations and planning for the northeastern Illinois region. It aims to provide a clear guidance to the regional transportation agencies, from both technical and business perspectives, about building such a comprehensive transportation information system. Several implementation alternatives are identified and analyzed. This research is carried out in three phases.
In the first phase, existing documents related to ITS deployments in the broader Chicago area are summarized, and a thorough review is conducted of similar systems across the country. Various stakeholders are interviewed to collect information on all data elements that they store, including the format, system, and granularity. Their perception of a data archive system, such as potential benefits and costs, is also surveyed. In the second phase, a conceptual design of the database is developed. This conceptual design includes system architecture, functional modules, user interfaces, and examples of usage. In the last phase, the possible business models for the archive system to sustain itself are reviewed. We estimate initial capital and recurring operational/maintenance costs for the system based on realistic information on the hardware, software, labor, and resource requirements. We also identify possible revenue opportunities.
A few implementation options for the archive system are summarized in this report; namely: 1. System hosted by a partnering agency
2. System contracted to a university
3. System contracted to a national laboratory 4. System outsourced to a service provider
The costs, advantages and disadvantages for each of these recommended options are also provided.
17. Key Words 18. Distribution Statement
No restrictions. This document is available to the public through the National Technical Information Service, Springfield, Virginia 22161.
19. Security Classif. (of this report)
Unclassified
20. Security Classif. (of this page)
Unclassified
21. No. of Pages
99
22. Price
ACKNOWLEDGMENTS
This report is based on the results of research project ICT-R27-22, Regional Data Archiving and Management for Northeast Illinois. This project was conducted in cooperation with the Illinois Center for Transportation; the Illinois Department of Transportation, the Illinois State Toll Highway Authority, and the Federal Highway Administration. The research team thanks the Technical Review Panel (TRP) for the guidance, direction, and support. The members of the TRP and others who provided valuable support, include (alphabetically): John Benda (TRP chair)
Clair Bozic Jeff Galas Craig Heither Joseph Hill Jeffery Hochmuth Jerry Hron Anthony Khawaja Patti Killinger Mark Kinkade Scott Lee Duana Love Abby Malloy Tom Murtha Jonathan Nelson Justin Potts James Powell Greg Sanders Charles Sikaras Micheal Szubryt Gerwin Tumbali Aaron Weatherholt Mark Yow David Zavettero
Particular thanks go to Jeffery Hochmuth and James Powell for their tremendous
contribution throughout the project. Diego Klabjan and Paul Pei contributed to the earlier set-up of this project.
DISCLAIMER
The contents of this report reflect the view of the authors, who are responsible for the facts and the accuracy of the data presented herein. The contents do not necessarily reflect the official views or policies of the Illinois Center for Transportation, the Illinois Department of Transportation, the Illinois State Toll Highway Authority, or the Federal Highway Administration. This report does not constitute a standard, specification, or regulation.
ii
EXECUTIVE SUMMARY
This project studies the feasibility and implementation options of establishing a regional data archiving system to help monitor and manage traffic operations and planning for the northeastern Illinois region. This project aims to provide clear guidance to the regional
transportation agencies, from both technical and business perspectives, about building such a comprehensive transportation information system. Several implementation alternatives are identified and analyzed. This research is carried out in three phases.
In the first phase, existing documents related to ITS deployments in the broader Chicago area are summarized, and a thorough review is conducted of similar systems across the
country. Various stakeholders are interviewed to collect information on all data elements that they store, including the format, system, and granularity. Their perception of a data archive system, such as potential benefits and costs, is also surveyed. In the second phase, a conceptual design of the database is developed. This conceptual design includes system architecture, functional modules, user interfaces, and examples of usage. In the last phase, possible business models for the archive system to sustain itself are reviewed. The initial capital and recurring operational/maintenance costs are estimated for the system based on realistic information on the hardware, software, labor, and resource requirements. We also identify possible revenue opportunities.
A few implementation options for the archive system are summarized in this report; namely:
1. System hosted by a partnering agency 2. System contracted to a university
3. System contracted to a national laboratory 4. System outsourced to a service provider
The costs, advantages and disadvantages for each of these recommended options are provided. The primary function of this archive is to assist the participating agencies in their operations, planning, and performance evaluation. Therefore:
The archive should aim to generate revenue from the beginning, though the actual return is likely to be minimal for at least the short term.
Because the data archive must be suitable for operations (in addition to planning), it must have a quick and easy interface and be able to generate results quickly.
The decision on which option to pursue should be dictated by the partnering agencies.
The business option chosen must also be matched to the technical requirements.
Regardless of which business plan option is pursued, the development of the northeast Illinois data archive must be considered in step with short- and long-range needs of the GCM Gateway Traveler Information System.
Also regardless of which business plan option is pursued, the development of the northeast Illinois data archive must be consistent and compatible with the existing Northeastern Illinois ITS Architecture and other legacy systems.
Similarly, pending full development of CMAP’s data warehouse, there needs to be a link between the data archive and the data warehouse to allow the free flow of information.
TABLE OF CONTENTS
ACKNOWLEDGMENTS ... i DISCLAIMER ... i EXECUTIVE SUMMARY ... ii CHAPTER 1 BACKGROUND ... 1 1.1INTRODUCTION ... 11.2RESEARCHOBJECTIVEANDAPPROACH ... 2
CHAPTER 2 LITERATURE REVIEW ... 23
2.1INTRODUCTION ... 23
2.2PRINCIPLESOFDATAARCHIVING ... 23
2.3ARCHITECTUREANDSTANDARDS ... 27
2.4CASESTUDIES ... 28
2.5SUMMARY ... 36
CHAPTER 3 INTERVIEWS WITH STAKEHOLDERS ... 38
3.1INTRODUCTION ... 38
3.2INTERVIEWSUMMARY ... 38
3.3CURRENTDATAEXCHANGE ... 39
3.4 DATAARCHIVEGOALSANDOBJECTIVES ... 43
3.5HIGH-LEVELREQUIREMENTSFORTHEDATAARCHIVE ... 43
CHAPTER 4: CONCEPTUAL DESIGN ... 45
4.1.CENTRALIZED VS.DECENTRALIZEDARCHITECTURE ... 45
4.2CONCEPTUALSCHEMATIC ... 47
CHAPTER 5 BUSINESS MODEL ... 56
5.1 INTRODUCTION ... 56
5.2 REVIEWOFSIMILARDATA-ARCHIVINGSYSTEMS ... 56
5.3ESTIMATEDANNUALCOSTSFORTHEILLINOISSYSTEM ... 59
5.4CONCEPTSOFREVENUE&FUNDINGSOURCES ... 68
5.5BUSINESSPLANRECOMMENDATIONS ... 72
REFERENCES ... 73 APPENDIX A: INTERVIEW QUESTIONS AND RESPONSES... A-1 APPENDIX B: POTENTIAL INITIAL DATA EXCHANGES ... B-1 APPENDIX C: CONCEPTUAL DESIGN OF USER INTERFACES ... C-1 APPENDIX D: AGENCY DATA DETAILS ... D-1
1
CHAPTER 1 BACKGROUND
1.1 INTRODUCTION
In the transportation industry, multiple jurisdictions operate and maintain various facilities that combined make up the transportation network that we all use. Each has different
responsibilities, capabilities, and operational procedures. Consequently, each has developed different levels of data storage and usage. The capabilities of these local systems are typically limited. Most of them permit basic operations such as backups, but, for example, reporting functions are limited, or non-existent.
Such decentralized information systems hinder global decision making since their original purpose and motivation were to meet the requirements of the specific agency and not broader community needs. To enable centralized and global decision making, these systems need to be integrated to provide a coherent information system that can serve the broader transportation community.
The northeast corner of Illinois is heavily populated, and as a result traffic management is extremely complex. To monitor and handle real-time operations, several transportation
agencies have built their own information system(s), which are mostly used internally to analyze real-time operations and related analysis. To name a few, the IDOT Traffic Systems Center records five minute speeds and counts; PACE keeps track of bus schedule on-time
performance, incident locations and times, and many other records; and the Illinois State Toll Highway Authority (ISTHA) Traffic and Incident Management System (TIMS) records five minute I-PASS travel time data, incident locations and times, and other key data.
Most of these systems provide real-time data at different levels of granularity. As a result, simply ‘pulling’ all these data together is not meaningful, nor it is straightforward. One extreme is to combine all of the data into a single database by first identifying overlapping fields. This might require a large database with expensive data storage requirements and maintenance necessity. Some of the data in this combined database might never be used and therefore redundancy will occur.
The Illinois Department of Transportation (IDOT), ISTHA, and other regional agencies agree that by having a single system, more advanced modeling, decision making, and analysis could be performed. This project evaluates potential benefits of a centralized system, assesses the underlying cost, and studies integration options.
IDOT, ISTHA and other operating agencies covering the transportation system throughout the northeast corner of the state realize that it is suboptimal to have several
standalone transportation information systems not communicating to each other. For real time operations, the GCM Gateway was created to help solve this problem. Greater efficiencies could be achieved by having a single system with various decision support systems built on top of it, including a data archive.
The expense of creating and maintaining an archive system covering all agencies can be significant. Thus for the functions that require archived data such as planning and research, no one agency has assumed this regional responsibility. As a result, the region’s agencies are considering putting together a single warehouse for data archiving and mining. Combining approximately a dozen information systems into a single one will not be an easy undertaking. Such a complex task requires meticulous planning and a thorough analysis of all possible options and alternatives. In addition, benefits and costs must be identified.
A single data warehouse would provide better decision making based on a single repository encompassing the entire region. For example, travel demand patterns could be determined across the entire region as opposed to limited regions that interact with each other.
(e.g., travel time) and various factors (e.g., agencies operational decisions or incidents) could be analyzed in a more cohesive manner across the entire region, yielding a better understanding of underlying causes and effects. The ready availability of extensive data may help operators in real time make more informed and thus better control and traveler guidance decisions. With aggregated data from several agencies, correlations among events stored in several existing systems can be studied and used to improve operations. Benchmarking among agencies
provides yet another benefit of an integrated database. The regional travel demand model might be more easily validated with additional correlated data. Such a system can be used not only as an operational tool, but also as a planning tool and thus providing a wide variety of new
functionalities and a great new opportunity.
1.2 RESEARCH OBJECTIVE AND APPROACH
The main objective of this project is to provide clear guidance to the regional agencies about building a comprehensive transportation data archive. Several implementation
alternatives are identified and each one analyzed thoroughly.
The researchers started the project by first reviewing data archiving principles and existing archives around the country, including related deployments in northeastern Illinois. Regional agencies interested in or in some way already engaged in the task were contacted, and the results are presented. Another component is the review of the existing Regional ITS Architecture.
Next, the needs and scopes for the proposed data archive are indentified. This includes identifying major data elements including the format, system, and granularity. This is based on extensive interviews and discussions with the stakeholders at the interested agencies. While interviewing the stakeholders, each was asked to identify their goals, objectives, and
requirements of a regional data archive via a survey. The requirements and specification of the regional data archive rely on the data available at the agencies.
Based on the identified opportunities, needs, and requests, the research team designed a specification of the database, including conceptual schematics, software architecture,
functional modules, user interfaces, and examples of usage.
Finally, the research team reviewed possible business models for the proposed archive system to sustain itself. The operational costs for the system were estimated based on realistic information on the hardware, software, labor, and resource requirements. Possible revenue opportunities were identified. A few implementation options for the archive system are summarized and recommendations are provided.
The remainder of this report is organized as follows. Chapter 2 reviews the literature on transportation data archiving practice, and similar systems in peer states. Chapter 3
summarizes the interview and surveys with the multiple stakeholders. Chapter 4 analyzes possible centralized and decentralized data system architectures and presents a conceptual design of the system. Chapter 5 discusses costs, revenue, operations of the proposed archive system, and makes recommendations on the business model.
23
CHAPTER 2 LITERATURE REVIEW
2.1 INTRODUCTION
Transportation data archiving is defined as the systematic retention of transportation data so that the collected data can be used to fulfill the needs for short term transportation operations / management and for long term planning / design. Data warehousing aims to archive transportation system characteristics, operation details, and performance measures to improve overall management of transportation systems.
The main types of data elements that are usually archived, according to Guidelines for Developing ITS Data Archiving Systems (Turner 2001), are as follows:
Traffic monitoring and detection data: Traffic volume, speed, travel time, vehicleclassification, vehicle weight, video imaging
Traveler information data: Travel time, traffic flow speed, level of congestion, incidentdata, construction and maintenance activities, lane closures
Traffic control parameters/data: Display and parameters for ramp meters, trafficsignal, lane control sign boards, message sign boards, dynamic message signs
Incident and emergency management data: Time sequence of incidents (detection,notification, response, clearance), location, extent, cause, participants and response activities
Public transit data: Ridership, origin-destination, travel time, route information
Construction and work zone data: Location, time, date, extent of blockage or closureA data archiving activity is the integration of operational transportation data with more static information covering road system geometrics and characteristics. Effective use often requires higher level compilation and analysis of these different kinds of data to yield meaningful insight into system performance. Proactive traffic operations management requires historic data in order to forecast the likelihood of problematic sections and assist in the preparation of
strategies to mitigate anticipated problems. A collective data pool, furthermore, increases the cost effectiveness of data retention and storage activities for transportation planning, design, operations and research needs.
Archived Intelligent Transportation System (ITS) data are distinct from traditional data sources in three ways:
(1) ITS-generated data are temporally intensive (i.e., collected in very short intervals). (2) ITS-generated data fill some major data gaps that could not be filled in the past due to
resource (storage) limitations.
(3) Nowadays, nearly all ITS-generated data are available on electronic media, thereby expediting data analysis and information dissemination.
As a result, ITS-generated data can both replace and supplement data collected through traditional methods, such as paper-based documentation.
2.2 PRINCIPLES OF DATA ARCHIVING 2.2.1 Overview
Collecting transportation data to determine the performance of a transportation network requires a logistical plan that addresses the following: detailed preparation for the type of data to
be collected, frequency, locations, analysis techniques and responsibilities, database management and performance analysis reporting (U.S. DOT 2008). Freeway Management Systems (FMS) of transportation agencies generate data about the transportation networks and their status under varying traffic conditions. The next step is to compile the collected data into useful summary information. Ideally, most of this effort is completed automatically, but usually the Traffic Management Center (TMC) personnel need to be directly involved.
Part of the data archiving effort is the transformation of raw data into performance measures that help guide operations, management, planning and design. In general, raw data are created in the FMS and processed at the TMC before utilization. Although data should also ideally be gathered for all surface streets and transit modes, surface street data archiving has received relatively little attention to date.
According to the Freeway Management and Operations Handbook (U.S. DOT 2008), the primary reasons for archiving the generated data are to:
Provide more and better information for managing and operating the system.
Maximize cost-effectiveness of data collection infrastructure.
Reduce costs compared to manual data collection.
Conform to established and proven business practices in other industries. For northeastern Illinois, all four of these reasons apply.The data can be useful for any time period including the immediate, mid-term and long-term applications, as well as for various travel modes. The major applications of the compiled summaries fall into four main areas:
Highway operations and maintenance
Safety
Multi-modal transportation planning, including freight systems
Transit management
The key characteristics of successful data archiving practices identified in the literature review are summarized as follows:
Leading entities (not necessarily the stakeholders), who are primarily responsible for operating and maintaining the data archive, have to be appointed by the stakeholders.
A prototype using a few well-defined types of data should be established first. As thesystem becomes operational, the responsible entities should work aggressively to add new sources and types of data. History has shown that starting with too complex a system often leads to start-up failure, and archiving systems that do not actively expand may never achieve the level that they were intended to.
Quality control is a crucial part of data archiving, to find and remove erroneous data. To the extent possible, missing data replacement should be part of the procedure. The archiving entities should work with those agencies that provide consistently erroneous data to find solutions, or eliminate them as a data source.
Data compilations have to be available at a level of aggregation that is consistent with agency needs, and must consider analysis methods and statistical variability of the compiled data. Aggregation level is defined as the time interval at which raw data are summarized, since raw data may be fine-grained and voluminous. Flexibility should be built into the archiving system for unanticipated needs, and the range of aggregation solutions can be from a single fixed aggregation level to complex multiple aggregation levels. In advanced systems, a good choice is to have several aggregation levels (e.g., multiple fixed aggregation levels, or dynamic aggregation levels).25
Diagrams and guidelines that show how data are collected, processed and presented should be provided so that users can better understand the origin of data, their content and the presentation style.
The data archive has to be user friendly so that an ordinary user with a typical desktop computer and internet access should be able to access and analyze the data without special training. Distribution of stored data can be done by portable storage devices or over a web-based medium.2.2.2 Issues and Costs
Implementation issues can be categorized into five areas: 1. Institutional impediments
These impediments generally center around agency cooperation and proprietary data concerns. Agency cooperation is usually an issue related to financial issues. There may be political issues that usually have nothing to do with the data archive itself. The issue of proprietary data can be over ownership, value, or a range of other issues.
2. Privacy and liability
Most public agencies take the issue of data privacy very seriously. They are entrusted with the public good on a variety of responsibilities, and there is always some data the organization creates that they protect as part of their responsibilities. The issue of liability for making private data available – even if it is anonymous – is always present with the public agencies.
3. Data quality and integrity
Any field infrastructure requires a certain level of maintenance in order to maintain a working system. The level of commitment by an agency to maintenance of these systems varies considerably. Generally, data quality and integrity are a function of the amount of importance an agency places on maintenance. If an agency cannot produce reliable data over the long-term, then it should not be archived with the other systems. 4. Data standards and compatibility
While attempts have been made at creating a national standard for data formatting (e.g., TMDD), there is still considerable variability in how data is stored and by what standards. Especially troublesome is the location referencing used by various agencies. A regional data archiving system will have to accommodate such variability at least in the short term.
5. Other technological issues
Besides the obvious issues with getting two (or more) independently developed software systems to share data, there are issues with the integration of non-electronic data.
Additionally, there are issues relative to what format the final combined data should use. To address these issues, development time and dollars must be spent to:
Articulate and communicate the needs for archived data and clearly state benefits
Forge mutually beneficial partnerships among data-producing agencies and data users
Identify the lead entities responsible for data archiving
Address data quality/integrity issues while defining appropriate aggregation levels
Define data saving methods and hardware
Reconcile data incompatibilities among different data sources
Revamp existing software to accommodate archived data
Integrate the archived data with non-electronic data to meet broader data needs
Reformat archived data into a user-friendly format
Make archived data accessible in a timely manner
Provide complete training on use of archived data in engineering and planning practice
In the course of doing the literature review, many instances of very detailed design requirements were identified. Some of the more detailed design issues are as follows:
Some database formats may be inexpensive initially but may require high level programming support on an on-going basis that is expensive.
Firewall and security issues need to be addressed as early as possible.
Whenever possible, commercially available or open source software should be used instead of proprietary or custom-designed systems. Early systems (e.g., Washington State TRAC and Minnesota TMC) have a history of sharing software code.
A configuration management plan for system software and hardware is required.
Proper documentation of software is fundamental.
Mapping tools, most likely based on GIS, should be included.
To help identify benefits, it may be appropriate to conduct targeted field tests. Data archiving tools for incident management will be complex because they require the compilation and assimilation of data from several sources, but the pay-off in improved incident management may be great. The larger safety application area poses challenges relating to privacy and liability, in addition to the complexity of correlating geometric, weather and operational data, but likewise may yield large benefits by reducing accidents. As an added benefit while the full data archive develops and comes into active use, a natural constituency may develop that demands and supports more active monitoring and maintenance of ITS detectors and related equipment.
2.2.3 Archiving Opportunities
Many of the benefits of data archiving were addressed in the initial application for
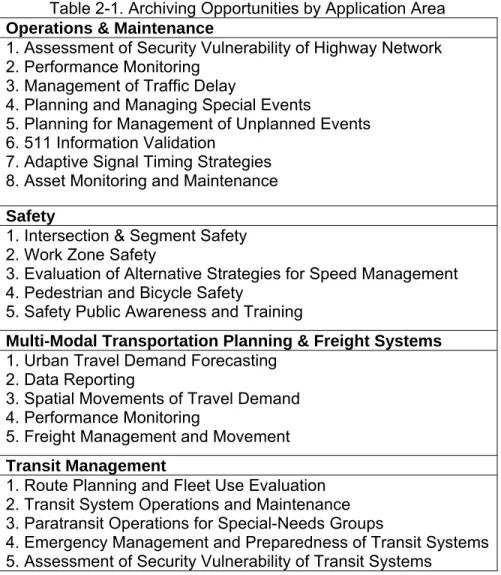
funding. There are a wide variety of groups within transportation that may rely on archived data on a recurring basis. Table 2-1, adopted from Cross-Cutting Studies and State-of-the Practice Reviews: Archive and Use of ITS-Generated Data (FHWA 2008), summarizes the archiving opportunities by application area.
27
Table 2-1. Archiving Opportunities by Application Area
Operations & Maintenance
1. Assessment of Security Vulnerability of Highway Network 2. Performance Monitoring
3. Management of Traffic Delay
4. Planning and Managing Special Events
5. Planning for Management of Unplanned Events 6. 511 Information Validation
7. Adaptive Signal Timing Strategies 8. Asset Monitoring and Maintenance
Safety
1. Intersection & Segment Safety 2. Work Zone Safety
3. Evaluation of Alternative Strategies for Speed Management 4. Pedestrian and Bicycle Safety
5. Safety Public Awareness and Training
Multi-Modal Transportation Planning & Freight Systems
1. Urban Travel Demand Forecasting 2. Data Reporting
3. Spatial Movements of Travel Demand 4. Performance Monitoring
5. Freight Management and Movement
Transit Management
1. Route Planning and Fleet Use Evaluation 2. Transit System Operations and Maintenance 3. Paratransit Operations for Special-Needs Groups
4. Emergency Management and Preparedness of Transit Systems 5. Assessment of Security Vulnerability of Transit Systems
2.3 ARCHITECTURE AND STANDARDS
Data archiving is best accomplished when there are regional standards that help to promote interagency sharing. Additionally, regional ITS Architectures help to illustrate the wide variety of sources an archived system should consider.
The National ITS Architecture is a common framework for planning, defining, and integrating intelligent transportation systems. A policy that requires all ITS projects to conform to the Architecture was issued by FHWA (2001). The National ITS Architecture Version 6.0 and its contents can be found at http://www.iteris.com/itsarch/.
All proposed system architectures and data have to be compatible with adopted, applicable standards. Although FHWA has not yet formally adopted any standards, numerous standards have been promulgated by three main Standard Development Organizations (SDOs), and may eventually be adopted by FHWA. See http://www.standards.its.dot.gov/ and
http://ops.fhwa.dot.gov/int_its_deployment/standards_imp/standards.htm for information and status on standards.
The Chicago region has several ITS Architectures in place, including a statewide, regional (MPO) and a three state Gary-Chicago-Milwaukee (GCM) ITS corridor architecture. (Note: it is expected that the GCM ITS corridor architecture will eventually transition into the new Lake Michigan Interstate Gateway Alliance ITS corridor architecture.) Systems in the region
mainly provide real-time information to various agencies, and they highlight available ITS resources for developing a data archiving system in northeastern Illinois. More detail about these systems is summarized in Section 2.4.
The National ITS Architecture has an Archived Data User Service (ADUS) that defines a general framework for data archiving. Functions of the ADUS are to:
Collect, archive, manage and distribute data from ITS sources.
Provide proper formatting, quality control and metadata (descriptive data about detailed data).
Provide data fusion between data elements from numerous data sources.
Present processed data for federal, state and local agencies.The National ITS Architecture also includes three archiving Market Packages: ITS Data Mart (AD1) – the focused archive of a single agency; ITS Data Warehouse (AD2) – pulls together ITS Data Marts of several agencies into a single repository, and; ITS Virtual Data Warehouse (AD3) – same functionality as AD2, but rather than a single repository, provides the tools to virtually link the individual agency archives.
During the initial development of the National ITS Architecture, user requirements for ITS data archiving were defined and documented. As a starting point for local initiatives, the
documentation at http://www.iteris.com/itsarch/ is useful. The documentation constitutes a comprehensive resource listing the different components of ITS and the many connections that unite them into an overall framework for deployment.
2.4 CASE STUDIES
This section briefly reviews some existing transportation data archives at federal and state levels. The FHWA’s effort to establish a national level transportation data network is first presented, followed by practices in various leading states. The developments of these systems are at different stages and the progress has not been uniform.Every system has its unique features, and collectively they may set a roadmap for the regional data archiving and management for the northeastern Illinois project.
In this section, ITS efforts related to transportation data collection and real time operations are also presented, mainly because these activities are closely related to data archiving efforts. It is not uncommon in the literature that a few peer states (e.g., Florida and Virginia) first developed data collection and compilation systems before building data archiving systems. Their situations somewhat resemble the case for Illinois, where a real-time information system is already in place before the development of an archiving system.
2.4.1 FHWA Mobility Monitoring Program (MMP)
In 2000, FHWA initiated a program in which archived freeway detector data from several cities (Atlanta, Cincinnati, Detroit, Hampton Roads, Houston, Los Angeles, Minneapolis-St. Paul, Seattle, and San Antonio) are collected in order to develop a performance monitoring program. This program mainly aims to monitor the mobility and reliability of each system at the city and national level and plans to add more cities into the system over time. The study is unique because it is the first step in a national level transportation data archiving effort.
Although the collected data were originally in different formats, all are summarized into 5-minute and lane-by-lane format for processing and analysis. Currently, only freeway detector data are gathered and saved offline on CD, although summary statistics are available online. Quality control measures are applied to the data to flag and remove erroneous data. The data record, data collection system, and data processing are documented for each city.
29
The MMPcalculates system performance metrics based on data archived at traffic management centers (TMCs). These data are highly detailed measurements from roadway surveillance equipment installed for operational purposes. Data from spot locations (volumes and speeds) are used as well as travel time estimates from probe vehicles where available. For each participating city, the MMP develops congestion metrics at both the corridor and area levels. Early work from this project has provided a basis for measuring travel time reliability. Beginning from 2002, traffic incident data has been collected from TMCs where these data exist. Also, continuous traffic data from signalized highways is being explored as a potential source for system performance monitoring. A major product of the MMP is the monthly Urban Congestion Report; this report characterizes the emerging congestion trends at the city and national level. As of late 2007, these reports are being prepared for 23 cities around the nation.
2.4.2 Texas - Austin, Texas (Turner 2001)
Freeway detector data are archived by the operations department of the Texas Department of Transportation (TxDOT). The data are provided on CD when requested. The data are aggregated at the hourly level, creating 365 x 24=8,760 comma-separated ASCII-text files every year. TxDOT is considering some improvements to this relatively old system. Some improvement recommendations are as follows:
Original 1-minute level data should be stored offline on CD.
Summary statistics on spreadsheets should be provided at the 5- minute, 15-minute and hourly level.
Data quality control measures should be exercised and historical data should be reviewed for erroneous data as well.
Distribution of data over the internet should be provided.Data Flows and Data Consumers in the Austin, Texas case are shown in Figure 2-1 below. The data archiving effort is conducted in parallel with the provision of real-time information.
Figure 2-1.Data flows and data consumers in Austin case study.
2.4.3 California PeMS (Varaiya 2006, 2008)
The Freeway Performance Measurement System (PeMS) is developed and operated by
the University of California - Berkeley, with the cooperation of the California Department of Transportation (Caltrans), California Partners for Advanced Transit and Highways, and Berkeley Transportation Systems (BTS).
The intent of PeMS is to collect historical and real-time freeway data from freeways in the State of California in order to compute freeway performance measures. Raw real-time freeway detector data (e.g., every 30 seconds) from Caltrans districts and TMCs are collected and summarized into 5-minute time intervals and loaded into the PeMS data warehouse. PeMS also obtains and stores California Highway Patrol CHP-published incident data. Data from PeMS are available through the http://PeMS.eecs.berkeley.edu website, which receives 4000-5000 web hits per day. The hardware was originally housed at UC Berkeley; a functional backup copy has been housed at Caltrans since 2006. The maintenance and upgrades are contracted to BTS.
PeMS contains 2 Terabytes (TB) of historical data online and adds 2 GB of data every day. Access to the data site requires a username and password. The website of archived data is accessible to the general public (public, academia, private firms and public institutions) after a registration process; access to real-time data feeds by value-adding resellers require extra approval process. The system provides several tools that present data summaries and reports. The main goal is to monitor freeway performance by using indices such as: travel flow speed,
31
estimated travel time, and vehicle counts. PeMS is a unique project because it is one of the few statewide transportation archiving efforts and has received positive reviews. Success in part is due to the fact that Caltrans has extensive detector coverage on its freeways, for which PeMS presents a valuable tool with extensive capabilities to calculate system performance indices. Future improvements to the system include the addition of better prediction and data generation modules, which are generally traffic simulation tools based on macroscopic traffic flow models (such as cell-transmission).
PeMS performance in the coming years should provide excellent insight into whether or not a centralized statewide data archive can be useful to local agencies. PeMS underlying software architecture can be described as follows:
The bottom layer is database administration: disk management, crash recovery, table configuration.
The middle layer comprises software that works in real time:–Aggregates 30-second flow and occupancy values into lane-by-lane, 5-minute values. –Calculates the g-factor (a parameter to characterize average vehicle length and loop
characteristics) for each loop at each time interval, and then the speed for each lane. (Note: speed = g-factor flow / occupancy).
–Aggregates lane-by-lane values of flow, occupancy, and speed across all lanes at each detector station.
–Computes basic performance measures including miles-traveled, vehicle-hours-traveled, travel times, and congestion delay.
The top layer comprises additional built-in applications and analysis modules that can be accessed via the PeMS website. PeMS allows users to pull out the trip travel estimates and shortest routes for specific O-D pairs. For any selected O-D pair, fifteen shortest paths on the district freeway map can be displayed along with travel time estimates. In addition, it is possible to predict travel time for the future, using a traffic projection algorithm that utilizes historical and real-time data. Another feature of PeMS is ‘plots across space’ that display bottleneck locations in a particular section of freeway.The communications architecture of different components of PeMS is shown in Figure 2-2.
Figure 2-2. High-level communication architecture of PeMS.
2.4.4 Washington – Seattle (Washington State DOT, 2006)
The Washington State DOT is an agency that has collected and stored freeway data since 1981, although there were some technological restrictions at the early stages of the effort. The agency has a history of institutionalized data archiving efforts, and this has been an
evolutionary effort. The archive is the product of collaboration between the University of
Washington, Washington State Transportation Center (TRAC), and the Washington State DOT. Seattle freeway detector data are collected every 20 seconds from field detectors and are summarized into 5-minute aggregations and distributed by CD upon request. The data are converted into estimates of vehicle speed and travel time. Quality control measures are applied to the collected data. Distributed CDs contain data extraction and summary tools besides the 5-minute aggregated data. The data provided are used for many operational purposes such as evaluating ramp metering strategies, analyzing HOV lane effectiveness, monitoring freeway performance, quantifying freight transportation efficiency, and pavement design.
2.4.5 Illinois and Neighboring States
2.4.5.1 Gary-Chicago-Milwaukee (GCM) Priority Corridor (Turner, 2001)
The Gary-Chicago-Milwaukee (GCM) Priority Corridor is a joint effort among the Illinois
Department of Transportation (IDOT), the Indiana Department of Transportation (INDOT), and the Wisconsin Department of Transportation (WisDOT). The GCM ITS Priority Corridor was one of four multi-agency ITS coalitions formed as a result of the Intermodal Surface Transportation
33
and Efficiency Act of 1991 (ISTEA). Officially started in 1993, the GCM Corridor was made up of all of the major transportation agencies in the 16-county area connecting Gary, Indiana through Chicago, Illinois to Milwaukee, Wisconsin, and is home to about 11 million people.
The Gateway System serves as an information clearinghouse for the information coming from a variety of transportation sources. The information is collected in each state's traffic management center, forwarded to the Gateway, and sent back to the traffic management centers. Each state manages its own system, but due to the Gateway, has better information on what traffic conditions are on the facilities adjoining its system. The Gateway currently collects, validates, fuses, and distributes real-time traffic information for expressways and tollways. The GCM website provides travelers in the corridor area with information to assist them in making transportation choices. The website provides:
A real-time map of road congestion and construction data
Construction and closure reports
Congestion and travel time reports
Historical travel time reporting
Traditional vehicle detection data
Dynamic Message Sign reporting
Incident Reports
Links to video images available in the corridor
Links to transportation-related sites in the corridorData is stored for roughly 30 days on the Gateway, but the data are not archived. A companion system at www.gcmtravelstats.com stores and provides travel time data at a fairly high aggregation level for comparison purposes, by route, day of the week, and date. Current and average travel times along with differences are presented in a table. A graphical
representation showing the average travel time by time of day together with the travel time for the current day is shown below the table. The graph also shows a shaded area representing one standard deviation from the average and lines indicating the travel times under different congestion scenarios (low, medium and high). Custom queries allow a range of dates to be selected for each of two routes for comparison purposes, and also allows for filtering the data based on the day of the week. The custom query also provides the average, minimum average, and maximum average travel times for specific segments.
2.4.5.2 Wisconsin Transportation Data Hub – WisTransPortal (Wisconsin Traffic Operations and Safety Laboratory, 2007)
The Wisconsin Department of Transportation (WisDOT) collects a significant amount of transportation operations related data to support long-range planning, improvement projects, and the metropolitan Milwaukee and Madison freeway management systems. In order to
provide tools that effectively manage, aggregate, archive and analyze multiple data sources, the Wisconsin Traffic Operations and Safety (TOPS) Laboratory (based at the University of
Wisconsin - Madison) has started the development of a data management system (WisTransPortal) to collect and archive ITS data in Wisconsin.
The goal of the WisTransPortal project is to develop capabilities for a statewide ITS data hub to support multiple applications in traffic operations and safety. Those capabilities include integration, management, analysis, and dissemination of real-time and historical ITS / traffic operations data through a centralized database and communications infrastructure. The data archiving component of WisTransPortal will consist of automated services that connect to various WisDOT data sources and prepare the data for archiving. The system includes
web-based query tools and GIS mapping tools. Some of the web applications available for the users include the following: (i) interfaces to query and download data from crash and weather
databases; (ii) ability to analyze the traffic detector data; (iii) map-based tools to retrieve information. In addition, other applications (e.g., for better data retrieval and integration of lane closure information) are in the development and testing phase.
2.4.6 Florida
2.4.6.1 SunGuide Florida (2008)
SunGuide is the statewide name for the Florida Department of Transportation (FDOT)'s Intelligent Transportation Systems. The SunGuide system does not provide data archiving, but it is a successful real-time operational data management system that is similar to the
Gary-Chicago-Milwaukee (GCM) Priority Corridor.
A real-time map on the Smart SunGuide website shows traffic-impacting events
providing travelers the information they need to make informed decisions on what route to take according to incident and congestion location information. The map also includes dynamic message sign and closed-circuit television cameras (CCTV) locations and status. Video images from the cameras and sign messages can be viewed by "mousing-over" map icons.
TMC operators coordinate with the Road Rangers, Florida Highway Patrol, FDOT District 6, Florida’s Turnpike Enterprise, and the Southeast Florida 511 Advanced Traveler Information System (ATIS) to determine incident and congestion locations. The information collected is then used for a better response and management of incidents and to disseminate appropriate messages to travelers using dynamic message signs, the 511 system, and traveler information websites. Once all the information from various sources regarding incidents is verified, the details of the event are entered into the SunGuide database system. These details are analyzed to determine the degree of disruption on the roadway and the potential impact on traffic. Response plans are generated and communicated to all stakeholders by emergency agencies.
2.4.6.2 Central Florida Data Warehouse (University of Florida Transportation Research Center, 2008)
The Central Florida Data Warehouse (CFDW) prototype system is on its way toward implementation. In March 2002 a report “An evaluation plan for the conceptual design of the Florida Transportation Warehouse-Phase 1,”wascompiled to draw the road map for the implementation stage as phase 1. As of April 2008 the implementation is in Phase 2, which is studying the proof of concept of the project. This project has been fully funded by the Florida Department of Transportation Research Office.
The principal function of the CFDW is to collect and store statewide information from many data sources and make it available for use by different applications. The archived data are used to prepare performance reports at different levels (such as detector, system and
operational levels), including the following information:
• Maximum Flow Rates
• Vehicle Miles of Travel (VMT)
• Vehicle Hours of Travel Time (VHTT)
• Average speed
• Delay
35
CFDW will interact with other traffic control centers, transportation management centers, emergency management centers, weather centers, disaster management centers, and motor carrier control centers. A prototype website has been created to access the data from the system. For future development, more of SunGuide’s TMCs are to be brought into the archiving process.
2.4.7 Virginia
2.4.7.1 Smart Travel Virginia (University of Virginia, 2008)
Smart Travel Virginia, like SunGuide Florida, is quite similar to the GCM system in terms of providing real time transportation information. This system is a collaborative effort between the University of Virginia (UVA) and the Virginia Department of Transportation (VDOT). It has two major components: freeway management and arterial management.
The Freeway Management System includes:
Closed Circuit Television (CCTV) for surveillance
Vehicle Detection Stations (VDS) for measuring volume, speed, and lane occupancy
Variable Message Signs (VMS) for specific en-route traveler information
Highway Advisory Radio (HAR) for broadcast en-route traveler information
Communications Subsystem (COMM) consisting of fiber optics, leased phone lines, microwave and wireless
Servers and software for logging incidents, generating response plans, and posting messages.The Arterial Management System includes:
Traffic signal controllers for controlling intersections
Communications Subsystem (COMM) consisting of fiber optics, leased phone lines and wireless
Servers and software for gathering vehicle data, uploading/downloading timing plans, and monitoring intersections.All of the data and information are collected and disseminated by the Smart Traffic Center (STC). Operators monitor the system, verify incidents and respond to them. Smart Travel also provides interstate traffic cameras that are available for viewing on TrafficLand.com so motorists can plan their routes prior to departure. VDOT also has a color-coded map displaying real-time traffic conditions, available to the public via the NOVACommute.com website.
2.4.7.2 ADMS Virginia (University of Virginia, 2008)
The Archived Data Management System (ADMS) Virginia enables the use of archived traffic operations-related data for transportation applications such as planning, mobility
performance measurement, improving operational effectiveness, and supporting decisions. FHWA and VDOT originally funded ADMS Virginia as an operational test. VDOT continues to sponsor this project and is leading the effort with team members from the Virginia
Transportation Research Council (VTRC) and UVA’s Center for Transportation Studies (CTS). UVA subcontracted the software development part of the project to Open Roads Consulting, Inc. (ORCI). The equipment necessary for the project was originally hosted at the Smart Travel
Laboratory (STL), a jointly-owned facility of VDOT and UVA. The production version was turned over to VDOT’s information technology center in Richmond in 2006.
DMS Virginia provides query capability to users. Authorized users may log onto the system through a standard web interface and query the database for historic traffic, weather, and incident information for specific routes, segments, or detector stations on user specific dates, at specific times, and at specific levels of aggregation.
The system has been developed in incremental efforts, implemented at different
locations progressively with each incremental step increasing the functionality and the coverage of the system. According to the information available from the project’s webpage, the system has been built in four ‘phases’ or ‘builds’. The traffic control and monitoring operations of the system are controlled from various traffic management centers (TMC) across the state; they are Northern Virginia Smart Traffic Center, Hampton Roads Smart Traffic Center and Smart Travel Lab at University of Virginia and most of the data in the system corresponds to the freeway detector data. Annual costs of operation and maintenance are estimated at $300,000 and funded by VDOT. Future upgrades in the system include improvements to the user interface, in order to make it easier for the public to use the system.
Additional information on ADMS Virginia is presented in Section 5.2.2 in the context of a business model for the northeastern Illinois data archive.
2.5 SUMMARY
The most important points from this review can be summarized as follows:
FHWA aims to have a national transportation data archiving network; it will beadvantageous for the northeast Illinois regional data archive system to make preparations for integration into the national system (e.g., by following similar ITS standards and technical requirements).
Data archiving and real-time transportation operation systems have similar characteristics. Many of the reviewed cases are joint efforts among several governmental agencies and academic institutions that deal with a great deal of transportation data.
There are not many efforts that can be used as working examples for regional data archiving and management for northeast Illinois. Some of the applications tend to consist of raw storage of freeway only data that can be reached by requesting CD based data. But there are a few examples such as the California PeMS, and developing efforts in Florida, Wisconsin and Virginia that may serve as good starting points.
Typically the original raw data are fed into one system by different entities. Centralized data storage is a common practice.
Current technological advancements allow processing and storing a large amount of data. For example, PeMS contains 2 TB of historical data online and adds 2 GB of data each day.
A sound systems engineering approach to system design is critical to ensure the developed system meets the needs of the intended users. Additionally, softwaredevelopment principles such as scalability, modularity, and portability must be followed.
Using an incremental build approach is beneficial from the standpoint of gettingfeedback from the stakeholders early in the process, when system design modifications are still feasible. In other words, rapid prototyping should be advantageous since it allows the stakeholders and developers alike to try and test the system during development, before the final release, in an iterative process.
37
Stakeholder involvement is identified as an important aspect through providing ideas, reviewing documents/demos, testing prototypes, and reporting any abnormal findings.
Focusing on providing user-friendly access to the data is crucial. Domain knowledge of the data and information is an important part of the process, and software can only do what it is programmed to do. If the underlying data is not understood, the services are unlikely to provide the desired results.CHAPTER 3 INTERVIEWS WITH STAKEHOLDERS
3.1 INTRODUCTION
As part of the efforts to create a data archive system in northeastern Illinois, a series of interviews were conducted over the period of June - July 2007 covering a range of potential stakeholders and participating agencies: Chicago Office of Emergency Management and Communications (OEMC), Illinois State Toll Highway Authority (Tollway), Chicago Metropolitan Agency for Planning (CMAP), Regional Transportation Authority (RTA), Lake County, Will County, Illinois Department of Transportation (IDOT) District 1, and IDOT Central Operations. Each interviewee was provided a written list of questions in advance, to help focus discussion. This section provides the results of the interviews, in summary form, with details in an Appendix. Data archive goals and objectives, followed by high-level requirements, are presented as well.
The proposed data warehouse will aim to accumulate as much data as is available concerning traffic and transportation within northeastern Illinois, and make it available to interested users or participating agencies. The data warehouse is not expected to exchange real time information between systems, since the GCM Gateway currently accomplishes that task.
3.2 INTERVIEW SUMMARY
The following section presents a summary analysis of the interview results. The detailed questions and agency responses are presented in Appendix A.
The transportation agencies in northeastern Illinois have a variety of data that are potentially available for archiving and further analysis. An initial review of data types
(surveillance, surface condition, events, etc.), sources, and users is presented in this chapter. Generally, the interviewed agencies feel that a successful regional data archive will significantly improve current practices in transportation planning, project programming, demand forecasting, traffic simulation, network operations, and advanced management and reporting. Regarding the format of data storage, most agencies prefer SQL-compliant databases, which is also the standard IT specification for IDOT. Some agencies would like GIS compatibility to be included for enhanced spatial analysis capabilities.
A certain format conversion functionality would be necessary in the archive system, i.e., it is expected that most electronic data feeds will require some form of conversion or
manipulation at the data archive. In terms of data transfer, most agencies prefer the XML format for its compactness and convenience. Data in XML format can be systematically generated from databases. The preferred data aggregation level ranges from 5 minutes to weekly. Since the majority of available data feeds (e.g., traffic surveillance) are available on a finer scale (e.g., 20 seconds), the archive system needs to be equipped with temporal
aggregation functionality.
Most agencies prefer web-based access to the data archive over the internet in which access security is directly addressed. A few agencies also suggest automated periodical data dumps or “offline” CD-ROM deliveries. Due to the nature of a data archive, it is acceptable that the lead time for some data collection, processing and arrangement be as much as a few months. Agencies prefer a much more timely access to data, but recognize that some items may take longer (e.g., crash reports often are not available until several weeks or longer after the occurrence). For data retrieval efficiency, most agencies suggest that, depending on the type of data, the most recent 2-4 years of data should be immediately available, while 10-15 years of retrievable “offline” data is acceptable.
39
It is also worth noting that only a few agencies currently do any data archiving, and even fewer agencies would be able to host the data archive system. This suggests that establishing a new centralized data warehouse is the best approach.
On the business side, most agencies will not be able to guarantee financial investment in this effort, especially long-term commitment for system maintenance and upgrades. Therefore, the data archive needs to have a sustainable financial model. One possibility is to charge users for data usage and to compensate providers for data provision. Most of the agencies say that they will be able to find ways to absorb any potential “profit” generated by the data archive, so long as it is not in the form of a direct cash payment to the agency. Data quality control and an equitable, fair pricing scheme are desirable for the system. Also, each data provider will need to identify the types of data that cannot be released due to legal restrictions, privacy, or security concerns.
3.3 CURRENT DATA EXCHANGE
Figure 3-1 summarizes the current exchange of data in the region at a high level,
including both automated data exchanges and those requiring human intervention of some kind, based entirely on the interviews.
To further establish a framework for the data archive, both agency websites and the
Northeastern Illinois Regional ITS Architecture were reviewed (via the on-line source). The purpose was to identify data exchanges that were listed as currently available, but apparently not shared, based on the fact that they were not identified in the agency interviews. This expanded list of potential data exchanges that might be implemented in the data archive is presented in Appendix B.
TOLLWAY • SYSTEM TO SYSTEM Surveillance Data • SYSTEM TO HUMAN Weather Data Incident Data
Traffic and Revenue Forecast Construction / Maintenance Data Lane Closure Data
CMAP
• SYSTEM TO HUMAN
Land Use Data Transit Data Surveillance Data Incident Data Parking Data
Construction / Maintenance Data WILL COUNTY
• SYSTEM TO SYSTEM
Construction / Maintenance Data
• SYSTEM TO HUMAN
Weather Data Signal Inventory
LAKE COUNTY
• SYSTEM TO SYSTEM
Video and loop detector data Surveillance Data
• SYSTEM TO HUMAN
Weather Data Incident Data
Construction / Maintenance Data
RTA • SYSTEM TO HUMAN Environment Data Transit Data Performance Data Weather Data Incident Data Parking Data
Construction / Maintenance Data Asset Inventory
TRANSIT AGENCIES (CTA, PACE etc.)
• SYSTEM TO HUMAN Transit Data Parking Data IDOT • SYSTEM TO SYSTEM Safety Datamart Surveillance Data • SYSTEM TO HUMAN
Construction / Maintenance Data Incident Data
Bridge Restriction Data
Weather Data gathered by weather sensors
IDOT DISTRICTS (District 1)
• SYSTEM TO SYSTEM
Surveillance Data Loop Detector Status
• SYSTEM TO HUMAN
Incident Data Weather Data
Construction / Maintenance Data
Lane Closure Data
• UNSHARED DATA
Com Center Reports ETP Reports
CITY OF CHICAGO & OEMC (including 311 Center and 911
CAD)
• SYSTEM TO SYSTEM
Traffic Signal Data Video Surveillance Data
• SYSTEM TO HUMAN
Incident Data
Construction/Maintenance Data Land Use Data
Incident Reports (not geocoded)
Figure 3-1. Current Data Exchanges – High Level (see next page for descriptions of the data).
NOTE
SYSTEM TO SYSTEM: Automated electronic exchange
SYSTEM TO HUMAN: Human interaction required; may include email, hard copy, fax etc.
GCM
• SYSTEM TO SYSTEM
Congestion Data Dector Reports Incident Reports
Dynamic Message Sign Reports Construction / Maintenance Data Lane Closure Data
Travel time Reports
AIRPORT WEATHER STATIONS & PRIVATE WEATHER INFORMATION
PROVIDERS
• SYSTEM TO HUMAN
41
Following are the details of available data identified by the agencies in Figure 3-1: AGENCY Surveillance data
(real time traffic/conditions) Construction / Maintenance / Condition data Event-based data (incidents, causalities, etc.)
Other (parking, public transit, environmental and weather, passenger information) OEMC
Real-time Signal (3000 signals inventory)
ADT (1989-2006, 1200 location,15 min intervals, GIS based)
Video detector (15 min aggregate level)
Redlight enforcement information
SunTrack (construction, city operations information)
Crash report (monthly from Chicago police department)
911 (real time incident)
Plow truck information
Contracted weather service(highway advisory radio)
Dynamicmessage signs ( 40 portable signs controlled by TMC-Traffic Management Center) TOLLWAY
Traffic (speed, volume, occupancy, OD)
Lane closures and estimated impact
Incident/cras h report
Traffic and revenue forecast 17 weather sensors in pavementIDOT District I
Traffic counts, volume, occupancy, speed, travel times (20-sec, 5-min, 1-hour data for up to 48 hrs, daily data for up to one month)
Detector status
Ramp
Lane closures (7500 records per half year)
DMS message (hourly updates)
Weather data (snow operations)
Metering rates (fixed rates) IDOT
Datamart
ATMS, ISP
Daily statewide road construction map
Bridge restrictions
Incident reportAGENCY Surveillance data (real time traffic/conditions) Construction / Maintenance / Condition data Event-based data (incidents, causalities, etc.)
Other (parking, public transit, environmental and weather, passenger information)
RTA
Transit info (headway, travel time, ridership, level of service)
Performanc e data by route (ridership for 10-12 years, with 6 months of lag)
AVL reports (per 2 minutes, highly noisy)
Signal priority (signal timing, travel time)
Incident data
Asset inventoryWILL COUNTY
Surveillance data
Construction data
Signal Inventory CMAP
Schematic network model of regional highway and transit systems
Specificinventory data, including a regional highway traffic signal inventory.
Limited traffic data that is mainly for the production of traffic demand model
Land use data, including a landdevelopment database LAKE COUNTY
Travel timeestimate from video and loop detector data
Traffic volume, speed, occupancy
Police reports for incident data
Weather data available from airports43
3.4 DATA ARCHIVE GOALS AND OBJECTIVES
The mission for a regional data archive was addressed in the application for this project: to provide a single source of transportation related information to facilitate not just additional planning and research, but also improved operations. To achieve this need and meet the requirements of the systems engineering process, goals and objectives must be identified. Goals are a high level statement of some result that when accomplished, achieves all or part of the mission. Objectives are a set of statements that include specific measurable
accomplishments that are directly related to the opportunity, need, or problem addressed by a Goal. The Goals are aims that support fulfillment of the mission and the Objectives are the steps/actions necessary to accomplish the goals. Table 3-1 identifies the various goals and objectives for the regional data archive system.
Table 3-1. Data Archive Goals and Objectives
Goals Objectives
1-To provide better transportation data for
all agencies in northeastern Illinois a. Collect both transit and highway data from every transportation agency in the region above township
level
b. Collect data from the larger municipal transportation
agencies.
c. Allow open access to the data for all public uses.
2-To be a sustainable resource to the public agencies throughout northeastern Illinois
a. Maintain data for an extended period of time (up to 20
years)
b. To increase the type of data provided by agencies over
time.
c. To address funding for the archive from the beginning,
including potential costs for services.
d. To ensure the integrity and longevity of all data
collected, so that it is secure and can be migrated to new formats
3-To provide service back to those that
contribute a. Incoming data is to be checked for errors, and host agencies informed if any potential problems are
detected.
b. Participating agencies should have a voice in the
management of the data archive
c. The data archive should produce recurring reports
summarizing the information available and highlighting any anomalies identified.
d. The data archive should provide assistance, such as
spatial reconciliation, to assist participating agencies in providing data
3.5 HIGH-LEVEL REQUIREMENTS FOR THE DATA ARCHIVE
Following the Systems Engineering process, the requirements of a system flow from the goals and objectives. The following requirements are matched to their respective objectives identified in Table 3-1. Based on interview responses and agency discussions, the following high-level requirements for the data archive have been identified, along with identifiers of the associated Table 3-1 Objectives in brackets:
• The data archiving system should be managed with input and oversight from the participating agencies [2a, 3b]
• Depending on the business model, the data archiving system may be managed by a third party [2c, 3b]
• The data archiving system should have at least 10 years of data (eventually), with recent data on-line and older data easily retrieved [2a]
• Data content should expand or contract over time in response to user requirements [2b]
• Users should have remote access to the databases [1c]
• The user interface should be friendly and appropriate [1c]
• The data should be as complete and current as possible [1a, 1b]
• The system should perform validation checks on incoming data [3a]
• The archive should have data aggregation capabilities, and produce and distribute reports [3c]
• There should be some payment for use of the system [2c]
• Data must be secure from tampering and loss [2d]
• As much data as possible should be included in the warehouse, and it should not be limited by storage constraints [2a]
• The warehouse must resolve spatial and time differences, and should have inherent GIS capabilities [3d]
These requirements address the design at a high level. In Chapter 4, more detailed technical requirements for the regional data archive will be developed, and specific types and quantities of data for inclusion will be identified.