econ
stor
www.econstor.eu
Der Open-Access-Publikationsserver der ZBW – Leibniz-Informationszentrum Wirtschaft
The Open Access Publication Server of the ZBW – Leibniz Information Centre for Economics
Nutzungsbedingungen:
Die ZBW räumt Ihnen als Nutzerin/Nutzer das unentgeltliche, räumlich unbeschränkte und zeitlich auf die Dauer des Schutzrechts beschränkte einfache Recht ein, das ausgewählte Werk im Rahmen der unter
→ http://www.econstor.eu/dspace/Nutzungsbedingungen nachzulesenden vollständigen Nutzungsbedingungen zu vervielfältigen, mit denen die Nutzerin/der Nutzer sich durch die erste Nutzung einverstanden erklärt.
Terms of use:
The ZBW grants you, the user, the non-exclusive right to use the selected work free of charge, territorially unrestricted and within the time limit of the term of the property rights according to the terms specified at
→ http://www.econstor.eu/dspace/Nutzungsbedingungen By the first use of the selected work the user agrees and declares to comply with these terms of use.
Inderst, Georg
Article
Infrastructure as an asset class
EIB Papers
Provided in Cooperation with:
European Investment Bank (EIB), Luxembourg
Suggested Citation: Inderst, Georg (2010) : Infrastructure as an asset class, EIB Papers, ISSN
0257-7755, Vol. 15, Iss. 1, pp. 70-104
This Version is available at:
http://hdl.handle.net/10419/45365
ABSTRACT
Georg Inderst ([email protected]) is an independent advisor to pension funds, institutional investors and international institutions.
Infrastructure as a new asset class is said to have
several distinct and attractive investment
characteristics.
This article reviews concepts, market
developments and empirical evidence on the
risk-return and cash flow profile, and the potential for
diversification and inflation protection in investor
portfolios. Furthermore, a new, global analysis of the
historical performance of infrastructure funds is
undertaken. There is no proper financial theory to
back the proposition of infrastructure as a separate
asset class. Infrastructure assets are very heterogeneous,
and empirical evidence suggests an alternative
proposition that treats infrastructure simply as a
sub-asset class, or particular sectors, within the
conventional financing vehicle on which it comes
(e.g. listed and private equity, bonds).
Infrastructure as an asset class
1. Infrastructure assets: Demand, definition, and investment characteristicsInvesting in public infrastructure has become popular with institutional and private investors in recent years. A growing number of specialist products were launched by the financial industry to satisfy the demand for infrastructure as a new asset class with a number of attractive and distinctive investment characteristics.
Can infrastructure investments live up to the promise? Despite the action seen in recent years, the field is still very much under-researched. This is surprising, given the political, economic, financial, social, and also cultural, relevance of infrastructure, and the potential contribution of private finance to long-term investment.
We still know very little, both in theory and in practice. Private investors’ experience with infrastructure funds is rarely longer than four to five years, and is shaped by the boom-bust-environment in financial markets. There are a number of issues that confuse investors and researchers alike.
Research was initially undertaken primarily by product providers (see Inderst 2009 for an overview of the earlier literature). Over the last one or two years, a number of new books and articles have been published in this field. However, data are still very limited in quantity and quality, making empirical work difficult. More surprisingly, there is hardly any theoretical work done on the subject.
This article sheds some light on the question whether infrastructure-related financial assets are distinct enough to form an asset class on their own. It discusses the empirical literature on return, risk and other characteristics of infrastructure-related financial assets and presents new empirical results on the issue. The remainder of this section gives some background on the demand for infrastructure assets, their definition and investment characteristics. Section 2 introduces investment vehicles and provides facts and figures for the growing investment volumes. Section 3 looks at investors’ asset allocation to infrastructure. Section 4 discusses the risk-return profile and specific risks. Section 5 reviews the evidence available on the historical performance of infrastructure investments. Section 6 undertakes a new analysis of the net returns of unlisted infrastructure funds on a global scale. Section 7 discusses the diversification potential and optimal portfolio allocation. Section 8 presents controversial views on inflation-protection with infrastructure assets. Section 9 elaborates on the renewed interest in infrastructure bonds. Section 10 discusses new developments in the market after the financial crisis and revisits the question of infrastructure as an asset class. The main conclusions are summarized in Section 11.
1.1 Demand for “alternative” and “real” assets
Specialist infrastructure funds were first set up by Australian investment banks in the mid 1990s, and the local pension plans were early investors in them. Some big Canadian pension plans also pioneered in the field. Institutional investors’ interest has been growing since the mid 2000s in Europe, Asia and the US.
A key driver in this process is a changed approach to asset allocation after the previous financial crisis of the early 2000s, when the tech shares bubble burst. The financial industry presented infrastructure as one of the new “alternative” asset classes (alternative to mainstream equities and government bonds), expected to provide new sources of return and better diversification of risk. The main asset classes within alternatives are typically real estate, private equity, hedge funds, commodities and overlay structures.
During the financial crisis, fundraising slowed down considerably not only for private equity but also for infrastructure. Nonetheless, the idea of investing in infrastructure struck a chord with many private investors, institutional and retail. Investors expressed interest in “real assets” that feel more solid than many other complex products and strategies presented to them, where they struggled to detect the underlying value.
However, alternative investments did not escape unscathed from the recent global financial crisis. Investors had some disappointments, including losses in “absolute return” funds, rising correlations among asset classes and the emergence of unknown risks. As a consequence, alternative asset classes are coming under increased scrutiny from investors. Key issues include of liquidity, leverage, valuation methods, transparency, governance, counterparties and operational risks.
1.2 Definition of infrastructure
At first sight, defining infrastructure does not appear controversial. The entry in the OECD glossary, for instance, says: “The system of public works in a country, state or region, including roads, utility lines and public buildings.”
In the investment context, it typically includes “economic infrastructure”, in particular Transport (
• e.g. ports, airports, roads, bridges, tunnels, parking); Utilities (
• e.g. energy distribution networks, storage, power generation, water, sewage, waste); Communication (
• e.g. transmission, cable networks, towers, satellites); and Renewable energy;
•
as well as “social infrastructure” such as Schools and other education facilities; •
Healthcare facilities, senior homes; and •
Defence and judicial buildings, prisons, stadiums. •
There are substantial grey areas. For example, do utility companies count as infrastructure? When their activities span production, distribution and networks, where is the dividing line? More generally, where does “public” infrastructure start and where does “private” infrastructure end?
To enlarge the investment universe of funds, the definition is often widened to include “infrastructure-related companies” or “associated industries”. Another popular extension is into “natural resources”. “Green investments” are now en vogue, but are all renewable energy project companies necessarily infrastructure-related?
Such definitional issues are not purely academic as they have an impact, e.g., on the risk-return profile and diversification potential of infrastructure investments and indices. Most empirical research works with a broad definition of infrastructure including utilities, and so does this study.
1.3 Investment characteristics
The investment industry prefers to emphasize the economic and financial (rather than physical) characteristics of infrastructure assets. They should operate in an environment of limited competition as a result of natural monopolies, government regulation or concessions.
Despite the slowdown in fundraising during the financial crisis, the idea of investing in infrastructure struck a chord with many private investors.
The stylized economic characteristics include High barriers to entry;
•
Economies of scale (
• e.g. high fixed, low variable costs); Inelastic demand for services (giving pricing power); •
Low operating cost and high target operating margins; and •
Long duration (
• e.g. concessions of 25 years, leases of 99 years).
Consequently, the value proposition of infrastructure as an asset class is to capture attractive financial characteristics such as
Attractive returns; •
Low sensitivity to swings in the economy and markets; •
Low correlation of returns with other asset classes; •
Long term, stable and predictable cash flows; •
Good inflation hedge; •
Natural fit with long-lasting, often inflation-linked pension liabilities; •
Low default rates; and •
Socially responsible investing. •
Intuitively, such claims often make sense, and people can easily find individual examples that fit well into the picture. However, it may be problematic to generalize too much and too quickly, as questions may be raised on each point.
For example, excess returns should follow from the monopolistic nature of distribution networks. However, other infrastructure companies appear to operate in a more competitive environment, e.g.
upstream energy producers or downstream telecom providers. Also, can favourable market positions be (politically) protected forever?
The defensive qualities of utility stocks are well-researched, as they tend to demonstrate low volatility and low sensitivity with respect to the stock market in general. On the other hand, many transport assets have turned out to be rather cyclical in the crisis.
Using past data, analysts “prove” diversification practically for each and every alternative asset class. However, it is less clear what causes the statistical effect, and how stable low correlations would be in future. Predictable and inflation-linked cash flows may result from long-lasting Public-Private Partnership (PPP) contracts or regulated activities. This also makes them suitable for liability matching purposes. But what if the guarantees are renegotiated or the price indexation changed?
Utilities may have relatively low default rates on average but is it true for the wider infrastructure universe? Some investors also remember their losses in individual projects such as Eurotunnel. The connotation to “sustainable”, “socially responsible” or “ESG” (environmental, social, and corporate governance) investing is also being made but it is less clear which infrastructure assets would fit in. Also, there can be pressure for public pension plans (but not only) to contribute to “green growth” initiatives.
Based on its economic features, infrastructure is supposed to offer investors long-term, low-risk, inflation-protected and a-cyclical returns.
In summary, there has been surprisingly little scrutiny of the supposed commonalties of infrastructure assets.
2. Vehicles and volumes
This section gives an overview of the investment instruments available to investors who wish to invest in infrastructure, and the development of investment volumes.
2.1 Vehicles
There is an increasing, and sometimes confusing, variety of investment vehicles available for infrastructure assets. It is particularly important to distinguish between listed and unlisted investment vehicles, and infrastructure companies and funds.
Infrastructure as a new asset class typically refers to Private equity-type investments
• , predominantly via unlisted funds (mainly closed-end but also
open-ended);
Listed infrastructure funds (closed-end or open-ended); and •
Direct or co-investments in (unlisted) infrastructure companies. •
The term “private infrastructure” is also popular. It is supposed to capture the different forms of unlisted investments.
It is often overlooked that investors have been shareholders of listed infrastructure companies for a long time, i.e. publicly traded utility, transport or energy companies. Traditionally, this would simply be treated as a sector of the equity market.
Similarly, infrastructure bonds are not new to investors, e.g. corporate bonds of such companies or government backed securities such as tax-exempt US municipal bonds. Infrastructure bonds may be earmarked to specific infrastructure projects, e.g. to build a new tunnel. There is also a new breed of infrastructure bonds in the form of PPP/PFI1 bonds, e.g. in the UK.
Further new product developments include infrastructure fund-of-funds, exchange-traded funds (ETF), passive funds, and derivatives built around various listed infrastructure indices.
Within the various categories of investment vehicles, there is considerable differentiation in terms of geography (including emerging markets), industry sectors and development stages (e.g. greenfield, brownfield, secondary – i.e. fully operational – stage)2.
Following the trend, a number of new infrastructure indices have been emerging since the mid 2000s, using different index methodologies, and covering different regions, countries, sectors, company sizes,
etc. Providers include Macquarie/FTSE, S&P, UBS, CSFB, Dow Jones/Brookfield and MSCI. It is worth noting that they capture only publicly listed infrastructure securities. Importantly, Utilities have a broad 1 PPPs are contractual agreements between public bodies, local authorities or central government, and private companies to deliver a public, social or economic infrastructure project. Private Finance Initiatives (PFI) are a form of PPP developed by the UK government.
2 Greenfield involves an asset or structure that needs to be designed and constructed. Investors fund the building of the infrastructure asset as well as the maintenance when it is operational. Brownfield involves an existing asset or structure that requires improvements, repairs, or expansion. The infrastructure asset or structure is usually partially operational and may already be generating income.
Infrastructure as a new asset class typically refers to listed and unlisted infrastructure funds and to direct or co-investments in infrastructure companies.
range of weightings between 33-89 percent in different listed infrastructure indices (Idzorek and Armstrong 2009).
Most unlisted infrastructure funds analysed have traditional closed-end private equity-type fund structures with General Partners (GPs) as fund managers and Limited Partners (LPs) committing capital to the fund. The partnership generally has a 10-12 year life span. Not surprisingly, fee levels and other structures are also quite similar to those of private equity overall. The median management fee of the infrastructure funds reported by Preqin3 based on a sample of 54 funds is 1.75 percent. There is some
dispersion across funds (standard deviation of 0.5 percent, range from 0.6 to 2.5 percent). In addition, there is a performance fee with similar terms for most funds, i.e. a median carried interest of 20 percent over a hurdle rate of 8 percent.
2.2 Market developments
Many industry observers believe that infrastructure was undervalued in the 1990s but enjoyed a revaluation process in the 2000s. Assets appeared to overheat in 2006/2007. Money was cheap and easily available, and this led to excessive leverage and bidding wars among all sorts of players and syndicates: investment banks, private-equity and real-estate investors, specialist boutiques, corporations, insurance companies, pension plans, sovereign-wealth funds etc. Too much money was chasing a limited number of suitable projects, which led to an overvaluation of many assets.4 The size of
infrastructure funds and deal size also grew.
The credit crisis starting in 2007 dramatically reshaped the financial environment at all levels in 2008/09: for infrastructure companies (more difficult lending conditions, falling demand), fund providers (need to de-leverage, investors withdrawing commitments and funds) and investors (e.g. falling asset valuations and rising liabilities, higher risk aversion). As a consequence, the sector faced de-levering, and also some divesting, while raising money became more difficult for funds. The conditions improved in 2010. 2.3 Volumes
The new wave of infrastructure investing has led to the emergence of specialist infrastructure funds. According to Preqin, the number of infrastructure funds grew from 44 to 192 between the years 2000 and 2009. Institutional fundraising in the years 2005 to the first half of 2010 was USD 130bn.
Fundraising rose strongly in the years up to 2007 (USD 45bn) but slowed sharply to a level of USD 8bn in 2009. The number of new funds launched and the target size of funds have also been reduced. In mid 2010, 109 infrastructure funds were reported to be “on the road”, looking to raise a further USD 82bn. The regional focus is quite evenly split between North America, Europe and the rest of the world. The deal flow within these funds was growing up to a number of 216 in 2008 but fell strongly during 2009. There appears to be some recovery in 2010, with a figure of 100 in the first 8 months.
Of the 979 deals recorded in the database until 2009, the majority (423) were made in Europe. The breakdown of other regions is: 288 in North America, 169 in Asia, 53 in South America, 36 in Africa and 10 in Australasia. Deals in Energy (299), Transport (229) and Utilities (193) clearly dominate other sectors.
3 This paper makes use of the latest available figures provided by Preqin, a data provider for alternative investments, in their various publications such as Preqin (2010a), and the database as of September 2010.
4 The rating agency Standard & Poors (2006) warned: “the infrastructure sector is in danger of suffering from the dual curse of overvaluation and excessive leverage – the classic symptoms of an asset bubble similar to the dotcom era of the last decade”. Infrastructure assets were arguably undervalued in the 1990s; they enjoyed a revaluation in the 2000s and appeared to overheat in 2006/2007.
Towers Watson, a consultancy firm, brings other interesting developments to the fore (Towers Watson 2010a). In their survey of the 224 alternative fund managers worldwide, the top 20 infrastructure managers report a total figure of USD 185bn in their (listed and unlisted) infrastructure funds under management at the end of 2009, USD 109bn of which are invested by pension funds, a share of 59 percent.
This survey confirms the growing role of infrastructure in the alternative-investment space. The proportion of infrastructure grew from 5 percent in 2007 to 9 percent in 2008 and to 12 percent in 2009. In the regional distribution of infrastructure assets, Europe leads with 43 percent, followed by North America (36 percent), Asia Pacific (16 percent) and other regions (5 percent).
Interestingly, infrastructure is the sector with the highest fund manager concentration among alternative asset classes. According to the Towers Watson survey, the top manager (Macquarie Group, Australia) controls almost half of the assets (USD 93bn). The top two managers (including the USD 26bn Brookfield Asset Management, Canada) manage almost two thirds of the assets, the top five over three quarters.
3. Asset allocation
3.1 Investors in infrastructure funds
Preqin currently lists over 800 investors in infrastructure funds worldwide. The largest groups are public and private sector pension funds with a share of 23 percent and 13 percent respectively. Endowments/ foundations, superannuation schemes, insurance companies and sovereign wealth funds add another 8 percent, 7 percent, 7 percent and 4 percent, respectively. The rest is made up by other financial institutions.
The eight largest investors in infrastructure (pension plans and insurers) are, with a total commitment volume of USD 28bn:
the Canadian public pension funds Omers and CPP with a commitment of 6.1bn and 4.1bn, •
respectively;
the Danish insurance company PFA (5.2bn) and public pension fund ATP (1.6bn); •
the Dutch pension funds APG (4.8bn) and PGGM (2.1bn); •
the AustralianSuper (2.9bn); and •
the British Railways Pension Scheme (1.4bn). •
3.2 How to classify infrastructure investments?
There are no exact data on the asset allocation of investors to infrastructure. Infrastructure is only slowly appearing on the radar screen of asset allocation surveys and independent performance analysis. One difficulty for data collection is that investors use different routes to invest in infrastructure. The picture becomes more complex as new trends in asset allocation create new categories such as real or inflation-hedging assets.
A first question is how investors classify infrastructure investments in terms of their asset allocation. According to Preqin, as far as unlisted infrastructure funds are concerned, 56 percent of investors have a separate asset allocation category for infrastructure while 28 percent classify it under private equity and 16 percent under real assets. Probitas (2009) finds further distinctions: 39 percent separate allocation, 27 percent private equity, 13 percent real estate, 12 percent general alternatives portfolio, 7 percent inflation-hedged and 15 percent others.
Surveys confirm the growing role of infrastructure in the alternative-investment space.
By contrast, one may assume that listed infrastructure securities are mostly still kept in the traditional equity and corporate bond portfolios.
3.3 Asset allocation data
A second question is about the percentage of infrastructure assets as a proportion of overall investors’ assets. Various survey data are circulating but they need to be interpreted with care for several reasons, including very generous definitions of investor, pension fund, and infrastructure.
Also, there are issues over representativeness as many surveys are based on a relatively small sample of investors, and biased towards the more vocal or “advanced” ones. Furthermore, it is not always clear whether figures refer to capital allocated, committed, drawn down or invested, an important distinction in private equity-type funds.
Preqin records the target allocation to unlisted infrastructure funds by all investors, including the various financial firms. The majority indicate either the range of 1-4.9 percent (37 percent of the funds) or 5-9.9 percent (38 percent). However, the actual investment levels of final investors such as pension funds, endowments and foundations tend to be lower. It is worth looking at pension funds in more detail.
In Preqin’s database, about 300 public and private pension funds globally are reported to already have commitments to infrastructure funds. The number has risen strongly in recent years. The press frequently reports new allocations of individual pension plans to infrastructure, of two, three, five percent or more of their capital. However, such funds are still in a minority.
The allocation of Australian Superannuation Funds and large Canadian public pension funds is estimated at 3.6 percent (listed and unlisted funds) and 1.3 percent (unlisted only), respectively (CFS 2009). However, the allocation to specialist infrastructure vehicles appears to be smaller. Against estimated global pension scheme assets of USD 23,300bn (Towers Watson 2010b), pension funds’ infrastructure investments of USD 109bn (Towers Watson 2010a) implies an allocation of roughly 0.5 percent. Another survey of 119 investors worldwide by Russell Investments (2010) sees the share of infrastructure at 0.3 percent in 2009, but expects it to rise to 1.4 percent of overall assets in three years’ time. The share within alternative assets is only 2 percent in their sample.
An earlier survey of ten major European pension funds by Hesse (2008) reported an average allocation of 0.5 percent with a maximum value of 2.5 percent. For Europe excluding the UK, Mercer (2010) found that 1.4 percent of pension scheme funds were invested in infrastructure, with an average allocation of 5.5 percent for the sub-sample of those pension funds that do invest in infrastructure. In the UK, more pension plans are invested (2 percent) but with a lower average allocation (3.8 percent). The number of actual investments is small also in the US. The JPMAM (2010a) survey of 349 US investors finds that 9 percent of investors have already invested, with an average allocation of 4.3 percent among those who did invest. Infrastructure has the greatest appeal among public pension funds of which 18 percent have invested, perhaps an indication of additional social and economic considerations in some states and municipalities.
In a nutshell, the asset allocation of institutional investors to specialist infrastructure vehicles is growing, but it is still on a level of less than 1 percent globally. That said, it is important to remember that investors’ total exposure to infrastructure is several times higher than these figures because of their investments
Three quarters of all investors have an allocation target between 1 and 10 percent for infrastructure but current investment levels are falling short of targets.
in traditional listed infrastructure stocks and bonds. As an estimate for stocks, one may take a volume of roughly USD 700bn or an allocation of 3 percent of pension funds’ total assets.5 Such investments
are dominated by traditional utility stocks. 3.4 Investment intentions
According to surveys, infrastructure remains one of the most appealing asset classes. The financial crisis seems to have cooled down investors’ interest in infrastructure only temporarily as the latest surveys show a recovery of investment intentions.
In August 2010, according to Preqin, 43 percent of investors were planning new commitments to infrastructure funds during the next 12 months (up from 40 percent in October 2009), while 18 percent (29 percent in October 2009) had no intention to invest. The others were either undecided or opportunistic about future investments.
An investor survey by bfinance (2010a) in May 2010 shows infrastructure as the most attractive asset class in the alternative segment. It found a net 16 percent of pension funds who intended to increase the asset allocation to infrastructure over the following six months. The comparable figures (for changes within one year) were 8 percent in December 2009, 30 percent in March 2009 and 19 percent in October 2008. The longer-term investment intentions over three years are consistently high: the net figures were 32 percent in May 2010, 21 percent in December 2009 and 33 percent in October 2008.
However, actual changes appear to be slower than intentions. Only a net 4 percent of investors reported actual increases in asset allocation over the previous six months in the May 2010 survey, down from a net 6 percent in December 2009.
If the upbeat investment intentions became real, there would be massive new demand for infrastructure assets. To emphasize the potential future demand, Schumacher and Pfeffer (2010) mention that a 1-percent asset allocation shift into infrastructure by the German insurance industry only would generate new demand of EUR 11bn. To exemplify the demand potential further, a 3-percent asset allocation shift into infrastructure by pension funds worldwide would result in an additional demand of roughly USD 700bn.
4. Risk–return profile 4.1 Target returns
Longer term, it is still unclear what the appropriate risk-return profile of infrastructure assets is. History can offer little guidance, and financial theories have not yet been designed.
Investors were being presented all sorts of stylized risk-return charts at the start of the infrastructure boom, often promising (private) equity-type returns with bond-type risk. Absolute return expectations for infrastructure funds were well in the double digits. Some providers differentiated expectations across sectors, stages and regions. RREEF (2007), for example, split expectations for mature infrastructure assets (10-14 percent) and early-stage assets (18 percent or plus).
5 S&P (2009) estimate the size of the global listed infrastructure market at USD 1,800bn, i.e. approximately 6 percent of the global equity market. Given an estimated allocation of pension funds to equities of 54 percent worldwide (Towers Watson 2010b) and assuming no sector bias for or against infrastructure, this implies an allocation of roughly 3 percent of the total pension fund assets (USD 23,300bn) and hence, a volume of pension fund investments in listed infrastructure of about USD 700bn.
If the upbeat investment intentions became real, there would be massive new demand for infrastructure assets.
J.P. Morgan (2010), for instance, circulated a table with “illustrative infrastructure returns”. PFI projects and operating toll roads are expected to provide the lowest internal rate of return (IRR) (6–9 percent and 8–12 percent, respectively) while merchant power generation (15–25 percent) and communication networks (15–20 percent) have the highest IRR expectations. In terms of expected cash yields, railways stand out for their particularly high yield expectation of 8–12 percent.
Other providers prefer risk-return comparisons relative to other asset classes, as is illustrated in Figure 1.
Figure 1. Risk-retrurn profiles of infrastructure investments vary widely in relation to traditional asset classes
Equities Seasoned toll roads
Social infrastructure Electricity generation Gas processing Ports Expec ted R etur ns Expected Risks Airports Desalination Rail infrastructure
Greenfield project development New toll roads
Merchant power plants
Greenfiled Infrastructure
Brownfield Infrastructure Fixed Income
Source: Credit Suisse Asset Management Note: For illustrative purposes only.
More recently, adjustments to the original risk-return picture had to be made for several reasons. First, as the infrastructure sector has become crowded, the prime mover advantage has evaporated. Second, the financial environment has changed as a result of the global financial crisis. Third, sectors greatly differ in their resilience to the recent ups and downs of the economy. Finally, investors have come to realize the enormous heterogeneity of infrastructure assets.
However, the adjustments to the risk-return profile appear to come through only slowly and gradually. Despite the talk about the moderation in the global financial crisis, targets remain fairly ambitious. Preqin reports a net IRR target of 15.8 percent on average (12 percent for developed markets and 19.3 percent for emerging markets). Forty-three percent of funds fit into the target IRR band of 10.1– 15 percent and 32 percent into the 15.1–20 percent band.
Essential to the achievement of such high IRRs are the substantial levels of leverage in underlying infrastructure projects. In a recent infrastructure fund manager survey by bfinance (2010b), about half of the 15 respondents said that gearing levels have dropped over the last two years. Nonetheless, target gearing levels are still predominantly in the 60–70 percent and 70–80 percent ranges.6
6 In an earlier analysis of funds before the crisis, CEPRES (2009) calculate a median target IRR of 15 percent, with values ranging from 10 to 30 percent (sample of 49 funds). The median leverage ratio (at individual transaction level) is 80 percent, ranging from 0 to 95 percent across the 19 funds giving the information.
The original risk-return picture had to be adjusted recently.
4.2 Benchmarks
Investors tend to be more cautious in their assumptions than product providers. In the context of asset-liability-modelling, typical figures used by pension funds are 9–10 percent for expected returns and 7–8 percent for expected volatility.
Another practical question for investors is how they should benchmark infrastructure funds. What could be considered success or failure? This is already difficult (and controversial) for asset classes with a much longer history, such as real estate and private equity. In theory, there are a number of possibilities (see CFS 2007; RREEF 2007), including
Absolute rate of return; •
Inflation plus margin (frequently 5 percent or so); •
LIBOR or bond yield or nominal GDP, plus margin; •
(Inflation-linked) bond index return plus margin; •
Blend of equity, real-estate, bond and private-equity benchmark; •
Listed-infrastructure index; •
Peer group of unlisted infrastructure funds; and •
Proper index of unlisted infrastructure (yet to be produced). •
In practice, there is currently a trend towards absolute return in benchmarking but inflation, cash or bond yield plus mark-up are also popular.
4.3 Risks
Risks go much further than the backward-looking volatility statistics, and certain factors are genuinely uncertain. The recent market turmoil has increased the awareness for the “other risks” in alternative assets. At the level of infrastructure projects and companies, key risks include
Construction risk; •
Operational and management risk; •
Business risk (demand, supply factors); •
Leverage, interest rate risk; •
Refinancing risk; •
Legal and ownership risk; •
Regulatory risk (fees, concessions); •
Environmental risks; •
Political and taxation risks; and •
Social risks (
• e.g. opposition from pressure groups, corruption).
There are additional risks at the level of infrastructure funds and vehicles, notably Concentration or cluster risk (small number of similar assets in portfolio); •
Illiquidity risk (immature secondary market); •
Pricing risk (valuation basis); and •
Risks related to the governance of investment vehicles (
• e.g. conflicts of interests, opacity).
Risks go beyond backward-looking volatility statistics, and certain factors are genuinely uncertain.
Finally, investors face their own risks and issues when starting to invest in infrastructure such as Lack of experience with asset class and investment vehicles;
•
Investment and re-investment programme, diversification by time; •
Integration in asset-liability-management, strategic asset allocation; •
Timing (boom and bust cycles); •
Advisers and counterparties; •
Legal, regulatory and fiduciary risks; and •
Reputation risk. •
Investors are trying to manage and mitigate such risks somehow but there is particularly little guidance in these fields. A more thorough qualitative and quantitative analysis of the risks involved in the underlying assets and investment vehicles is required.
Infrastructure is not a purely private investment and is likely to be under more public scrutiny than e.g.
privately-owned real estate. Trustees and members of pension funds all have their own views about private finance of public infrastructure, and are aware of some fundamental opposition against it.7
5. Historical performance
This section gives a short overview of the empirical literature on infrastructure fund performance, mostly drawing from Australian experience. New results based on a worldwide sample will be presented in Section 6 below.
There are still little reliable data available on the performance of infrastructure investments, for reasons related to the availability of data and their interpretation. Regarding the former, the history of most unlisted infrastructure vehicles is quite short and data are often proprietary while independent performance measurement services have hardly started to collect or provide data. Regarding the latter, there is much variety and diversity in unlisted infrastructure funds. Moreover, infrastructure funds and investors use different benchmarks, and there are no agreed performance and risk reporting standards.
5.1 Infrastructure indices
Researchers normally, and conveniently, use listed infrastructure indices for the construction of historical performance records of infrastructure as an asset class (e.g. UBS 2006; Newell and Peng 2008a; 2008b; 2009 for US, Europe, China and global listed infrastructure indices). However, this is effectively not much more than a traditional stock market sector analysis as such indices are based on publicly traded shares of utility, transport, energy and other infrastructure companies.
It is not very surprising that, given the revaluation process of infrastructure and vutility stocks before the financial crisis, many studies showed some out-performance of infrastructure indices against the stock market in general. More recently, the picture has become more mixed. Depending on the construction of the index and the period chosen, volatility can be somewhat higher or lower than for broader indices.
7 For example, there is vocal opposition against PPP/PFI in the UK, using a number of arguments: lack of transparency, increasing costs of PFI projects, a build-up of huge off-balance-sheet liabilities for future taxpayers, excessive returns for the financial industry etc. (e.g. see Hall 2009).
Before the financial crisis, many studies showed some out-performance by indices of listed infrastructure companies against the stock market in general.
Furthermore, Sawant (2010a) finds the following in his analysis of the distributions of different listed infrastructure indices:
High correlation with general stock market indices (coefficients between 0.77 and 0.82); •
Negative skew (indicating that negative returns are more likely); and •
High kurtosis (“fat tails”, high proportion of outlier periods). •
Overall, such time series are a useful point of reference but they are primarily driven by stock market volatility. They are unlikely to be good proxies for infrastructure in the alternative investment space. 5.2 Listed infrastructure funds
There are 21 infrastructure funds listed on the Australian Stock Exchange with a market capitalization of AUD 35bn (as of August 2010). Some more funds are listed in Toronto, London, New York, Seoul, Singapore and other markets. Preqin currently has 46 listed infrastructure funds in their database; the majority of them are listed in Australia (17), Canada (14) and the UK (6).
Performance figures of the various listed funds show a very high degree of dispersion. No thorough performance and risk analysis of listed infrastructure funds is available to date.
5.3 Investor reports
One approach is to analyze results as reported by investors. However, not many investors provide details of the performance of their assets, let alone a breakdown by asset classes. An additional complication is that many institutional investors are used to time-weighted annual returns while project finance and private equity funds work with IRRs.
As an early indication, performance reports from individual investors show a high degree of dispersion of results across funds and also over time. Weber and Alfen (2010), for instance, list some figures reported by pension funds across the world. The annual returns (in local currency) range from 6.0 to 41.3 percent in 2006, from 7.4 to 21.0 percent in 2007 and from –13.9 to 12.6 percent in 2008.
As a particular example, the biggest pension fund of Europe, the Dutch APG, started with infrastructure investments in 2004. At the end of 2009, it had 1.2 percent of its assets invested, against a target allocation of 2 percent. It reported annual returns (in percent) for the years 2005 to 2009 of –6.7, 41.3, 21.0, –3.1, –4.8, and of 15.2 for the first half of 2010.
Clearly, performance figures for the early investment years of investors need to be interpreted carefully. First, the investment programmes are normally phased in over several years. Second, there is typically a J-curve effect, whereby private equity-type funds deliver negative returns in early years and investment gains in the outlying years as the portfolio of companies matures. Third, market volatility also affects the valuation of unlisted companies and funds, although often less markedly so and with a time lag. 5.4 Australian unlisted funds
Some work has been done to produce historical time series and performance figures for unlisted infrastructure funds in Australia where the record is longest. Table 1 summarizes the results of different studies.
Performance reports from individual investors show high dispersion of results across funds and over time.
The first academic study known is by Peng and Newell (2007). They analyze the quarterly returns of five unlisted Australian infrastructure and utilities funds.8 Over the ten-year period to Q2 2006, both
risk and returns compare very favourably to other asset classes. The average annual return of unlisted infrastructure funds of 14.1 percent beats the returns of bonds (7.2 percent), stocks (12.9 percent) and direct property (10.9 percent).
Volatility of unlisted infrastructure (5.8 percent) is lower than that of the listed asset classes but higher than for bonds (4.3 percent) and direct property (1.5 percent). Listed infrastructure shows both higher returns and risk than unlisted infrastructure.
As a common measure for risk-adjusted returns, the authors calculate the Sharpe ratio, defined as the excess return over a risk-free rate, per unit of risk in an investment. Direct property is well ahead with an extraordinary Sharpe ratio of 3.67, while unlisted infrastructure (1.47) comes second, with stocks (0.67) and bonds (0.39) ranked at the bottom.
Table 1. Returns, volatility and Sharpe ratio of unlisted infrastructure in Australia in comparison
Study Period Frequency Unlisted infra. Equities Bonds propertyListed propertyDirect Listed infra. Average annual
return
Peng and Newell
(2007) Q3 1995- Q2 2006 quarterly 14.1 12.9 7.2 13.8 10.9 22.4 Newell et al. (forthcoming) Q3 1995- Q2 2009 quarterly 14.1 9.1 7.0 4.9 10.6 16.7 Newell et al. (forthcoming) Q2 2007- Q2 2009 quarterly 8.2 -13.2 7.1 -35.8 3.3 -23.9 Finkenzeller et al. (2010) Q4 1994- Q1 2009 quarterly 8.2 7.9 8.2 9.8 15.6 Annualized volatility
Peng and Newell
(2007) Q3 1995- Q2 2006 quarterly 5.8 11.0 4.3 7.9 1.5 16.0 Newell et al. (forthcoming) Q3 1995- Q2 2009 quarterly 6.3 13.9 4.6 17.5 3.0 24.6 Newell et al. (forthcoming) Q2 2007- Q2 2009 quarterly 6.7 21.5 6.9 31.6 5.8 23.0 Finkenzeller et al. (2010) Q4 1994- Q1 2009 quarterly 3.8 15.0 5.0 5.1 16.6 Sharpe ratio
Peng and Newell
(2007) Q3 1995- Q2 2006 quarterly 1.47 0.67 0.39 1.04 3.67 1.05 Newell et al.
(forthcoming) Q3 1995- Q2 2009 quarterly 1.34 0.25 0.30 -0.05 1.63 0.45 Newell et al.
(forthcoming) Q2 2007- Q2 2009 quarterly 0.32 -0.90 0.15 -1.32 -0.47 -0.7
8 It is the average weighted monthly total return index using five major unlisted infrastructure fund series available from Mercer Investment Consulting since January 1990: AMP Infrastructure Equity Fund (1995), Colonial First State Infrastructure Income Fund (2003), Perpetual Diversified Fund (2004), Hastings Infrastructure Fund (2000) and Hastings Utilities Trust of Australia (1994). This is a valuation-based performance index, similar to the Mercer unlisted property index.
In Australia, direct property investments achieved the highest risk-adjusted returns in the decade before the financial crisis, ahead of unlisted infrastructure funds.
Newell et al. (forthcoming) have undertaken a follow-up study to integrate the effects of the global financial crisis. The focus is on the same five Australian unlisted infrastructure funds. The authors state that this is still the only unlisted performance index available worldwide. The analysis is undertaken over the 14-year period from Q3 1995 to Q2 2009. Compared to the earlier study (Peng and Newell 2007), the average annual returns are down for all asset classes except unlisted infrastructure that remains unchanged at 14.1 percent. Volatilities are all up in the new study, and quite substantially so for listed property and listed infrastructure.
Risk-adjusted returns are sharply lower for all asset classes except bonds and unlisted infrastructure over the full 14-year period to mid 2009 compared to the first ten years of that period. Unlisted infrastructure (Sharpe ratio of 1.34) again comes second behind direct property (now with a more moderate 1.63).9
Table 1 also shows the implications of the financial crisis on the performance of asset classes over the nine quarters between Q2 2007 and Q2 2009. All asset class returns were negative except for unlisted infrastructure funds (8.2 percent), bonds and direct property. In terms of risk-adjusted performance, unlisted infrastructure comes out first over this period with a Sharpe ratio of 0.32.
The five-year rolling volatility results suggest little change for unlisted infrastructure during the financial crisis, again in contrast to increased volatility of the listed assets and even direct property. Given the time of the publication, the paper only covers the downside period of the financial crisis, leaving out the sharp recovery of listed asset prices after Q2 2009.
Finkenzeller et al. (2010) analyze similar data over a longer time between Q4 1994 and Q1 2009, including the impact of the financial crisis. However, the authors make adjustments to get “desmoothed” and “unlevered” returns for better comparability with transaction-based indices of listed assets (removing a gearing level of 60 percent). Unlisted infrastructure and utility shows similar returns to equities and bonds, but is behind direct property and listed infrastructure. However, unlisted infrastructure comes out with the lowest volatility figure, even lower than bonds and direct property. Again, listed infrastructure is found to have higher returns and much higher risk than unlisted infrastructure. The most up-to-date performance data are published by CFS (2010) who use their own index of five equally-weighted Australian unlisted infrastructure funds over the ten years to June 2010. They confirm the low volatility compared to other asset classes and the high risk-adjusted returns over one, three, five and ten years. The rolling 12-month return slipped only briefly into negative territory in 2009. In summary, the Australian performance studies of unlisted funds find relatively high risk-adjusted returns and relatively strong resilience in the market downturn. However, strong caveats are necessary, some also mentioned by the authors:
Small and incomplete sample of funds (different sizes and inception years – only two funds before •
the year 2000);
Data gathering from different sources; •
Results depend on the specific period analyzed; and •
Appraisal-based valuation of unlisted infrastructure and direct property, which tends to •
underestimate volatility and correlations with listed instruments, and overestimate their diversification potential.
9 When the time series is divided into two sub-periods of 7 years (not shown in Table 1), Q3 1995 – Q2 2002 and Q3 2002 – Q2 2009, infrastructure shows relatively consistent returns of 15.1 percent and 13.1 percent, respectively. This is in sharp contrast e.g. to listed infrastructure or listed property with falls from 28.8 to 5.9 percent and from 12.8 to -2.5 percent, respectively.
During the financial crisis, all asset class returns were negative except for unlisted infrastructure funds, bonds and direct property.
5.5 Direct investment by funds
CEPRES (2009) take a different approach in their empirical analysis of the risk-return characteristics of direct investments in unlisted infrastructure companies within funds in their private-equity database. They develop two global datasets – a narrow one (dataset I) where the word “infrastructure” appears in the fund name, and a wider one (dataset II) including other funds with an infrastructure or mixed focus – covering the time period from 1986 to 2007 (i.e. not including the financial crisis).
Dataset I shows a median gross IRR of 14.3 percent for 196 realized transactions and of 0 percent for 187 unrealized investments. The corresponding average values are 48.0 and 14.3 percent. In dataset II, the median figures are 18.4 percent for 478 realised transactions and 10.1 percent for 355 unrealized investments, and the averages are 34.2 and 45.4 percent, respectively.
In terms of investment multiples10, dataset I has median multiples of 1.4 and 1.0 for realized and
unrealized investments, respectively. The corresponding average multiples are 2.99 and 1.39. In dataset II, the median figures are 1.73 and 1.21, the average figures are 2.43 and 1.76.
The authors also emphasize an extraordinary degree of variation across projects, and also the high spread of returns across sectors, regions and years. The frequency distribution of IRRs of fully realized transactions shows substantial deviation from a normal distribution. It is skewed to the right with a high frequency of extreme outliers in both tails.
Overall, the empirical evidence available to date suggests:
High absolute returns to infrastructure investments before the financial crisis; •
High returns and low volatility relative to most other asset classes; •
Relatively good defensive qualities in the downturn (although not absolute resilience). •
However, it is obviously still very early days for performance measurement and analysis of infrastructure investments and much is left to do in this field in every sense. Other than the availability of data, there are a number of difficult questions, including the construction of appropriate indices for valuation-based, unlisted assets, the likely existence of survivor (and other) biases, the frequency of data, the appropriate measures for return and risk, the diversity of vehicles, the impact of fees, the effect of gearing and the appropriate performance measurement methodology in general.
6. Performance of global unlisted funds
The analysis of the performance of unlisted infrastructure funds is normally concentrated on a very small number of Australian funds. In this chapter, new analysis is undertaken with a much bigger number of funds on a global scale, and using figures of net returns.
The empirical analysis is based on the range of infrastructure funds in the database of Preqin, a major provider of data on alternative investments. The Preqin Private Equity Intelligence (Preqin) database was launched in 2002 with private-equity funds. Preqin extended its scope to include private-equity real estate in 2006, hedge-fund investors in 2007 and infrastructure in 2008. The database includes data on alternative funds, fund managers, institutional investors, consultants, lawyers and placement agents.
10 The multiple is defined as the ratio between the total value that the LP has derived from its interest in the partnership – i.e. distributed cash and securities plus the value of the LP’s remaining interest in the partnership – and its total cash investment in the partnership. It is one measure of profit or loss for the LP.
A study of fully realized private-equity transactions worldwide finds an extraordinary degree of variation in returns across projects, sectors, regions and years.
6.1 The Preqin database
The Preqin infrastructure database has been growing fast since its launch. As of September 2010, it consisted of 455 funds, 283 fund managers and 819 institutional investors. The data include the investment vehicle, fund vintage (year in which the fund made its first investment), size, geography, strategy, project stage and sector.
There are 46 listed and 403 unlisted infrastructure funds in the database. The fund size ranges from very small (18 funds with less than USD 50m assets under management) to very large (three funds with more than USD 5bn).
The location of fund managers is widely spread over the globe, although the numbers for South America and Africa are still small. The US, UK and Australia have the highest numbers by country.
In terms of the regional investment focus, Europe is clearly the most popular destination of funds, followed by North America and Asia. The vast majority (404) have a primary investment strategy (i.e., invest directly in a company or in assets), while there is a growing number of debt/mezzanine funds11
(29) and fund of funds (32). There is not a single secondary fund12 in the infrastructure database.
In terms of focus on project stages, the funds are pretty evenly spread across brownfield, greenfield, and secondary stage. About two thirds of the funds invest in economic infrastructure only, about one third in both economic and social infrastructure. A number of funds (140) explicitly invest in PPP or PFI, 36 do not.
Energy is the most popular sector: of the 263 energy funds, a surprisingly high number of 176 funds claim a focus on renewable energy. The other main sectors are transport (195 funds), water (140) and utilities (136). Thirty-six funds reportedly make investments in clean technology, 31 in environmental services and 62 in natural resources.
6.2 Main fund and performance statistics for infrastructure funds
Performance data of infrastructure funds are difficult to get hold of, even by the standards of alternative asset classes. Preqin collects data from the public sources available (e.g. US public pension funds under the Freedom of Information Act). They also ask fund managers, investors and advisers to release reliable performance data. Fund statistics are continuously updated from the latest available quarterly, semi-annual or semi-annual reports.
The Preqin database includes performance data of 80 unlisted infrastructure funds of vintages from 1993 to 2010. The statistics provided are:
Called-up percentage (Called): the proportion of the LPs’ aggregate commitments that have been •
contributed to the fund;
Distributed to paid-in percentage (DPI): the proportion of the called-up capital that has been •
distributed or returned back to LPs. DPI refers to distributions between the fund and the investors;13
Remaining value to paid-in percentage (RVPI): valuation of unrealized investments expressed as a •
percentage of called capital;
11 Mezzanine debt is debt that incorporates equity-based options, such as warrants, with lower-priority debt.
12 A secondary fund is an investment vehicle that purchases the interests of original investors in limited partnership funds before the limited-partnership contract expires.
13 For cash flows between the portfolio companies and the fund, see Bitsch et al. (2010), in this issue. The Preqin database
of private-equity funds around the globe contains 455 infrastructure funds, of which 90 percent is unlisted.
Multiple: sum of called DPI and RVPI
• (divided by 100);
Net IRR: the net IRR earned by an LP to date after fees and carry; the IRR is an estimated figure •
based on the realized cash flows and the valuation of unrealized assets.
Median IRRs and multiples are the most common measures to benchmark the performance of private equity-type funds.
Forty-seven fund managers are represented with only one fund in the sample, five with two funds, five with three funds and two with four funds. Table 2 summarizes the main performance statistics of the Preqin infrastructure sample as of September 2010. DPI, RVPI and multiple are provided for 78 of the 80 funds while IRR figures are available for 37 funds. The key summary statistics are as follows:
Called ranges from 3 to 109 percent with a median of 63 percent; •
DPI has a very wide range from 0 to 254 percent with a median of 5 percent and a much higher •
average (37 percent);
RVPI ranges from 0 to 259 percent with a median of 88 percent; •
Multiple ranges from 0.41 to 2.59 with a median of 1.08 and an average of 1.19; •
Net IRR ranges from -33 to +54 percent with a median of 5.5 percent, the average being •
somewhat higher at 6.3 percent.
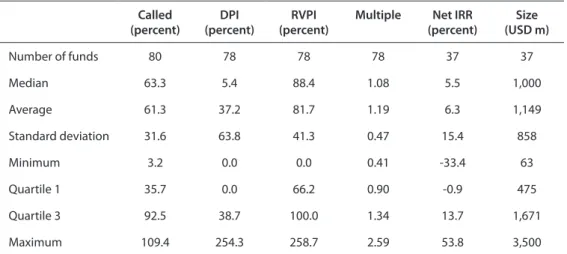
Table 2. Descriptive statistics of unlisted Infrastructure funds
Called
(percent) (percent)DPI (percent)RVPI Multiple (percent)Net IRR (USD m)Size
Number of funds 80 78 78 78 37 37 Median 63.3 5.4 88.4 1.08 5.5 1,000 Average 61.3 37.2 81.7 1.19 6.3 1,149 Standard deviation 31.6 63.8 41.3 0.47 15.4 858 Minimum 3.2 0.0 0.0 0.41 -33.4 63 Quartile 1 35.7 0.0 66.2 0.90 -0.9 475 Quartile 3 92.5 38.7 100.0 1.34 13.7 1,671 Maximum 109.4 254.3 258.7 2.59 53.8 3,500 Source: Prequin
6.3 Key statistics over vintage years
The wide dispersion of figures is better understood by looking at the time dimension of fund vintage years that shows a very back-loaded picture. Although the sample goes back to the early 1990s, the majority of funds were only launched in the second half of the 2000s, in particular in the years 2006, 2007 and 2008 when a total of no less than 45 funds were launched.
For a better overview, the 17-year period is grouped into the following three sub-periods: Sub-period I: 1993-1999; Sub-period II: 2000-2004; and Sub-period III (2005-2009 or 2005-2007 for the analysis of IRRs) as no IRRs are reported for later vintages). Table 3 compares the number of funds available and the median values for each performance variable. In the following, results for all variables are discussed except for Net IRR, which is discussed in Sub-section 6.4.
Median IRRs and multiples are the most common measures to benchmark the performance of private equity-type funds.
Table 3. Number of funds and statistics by sub-periods
Number of funds Median
Year Called DPI RVPI Multiple with IRR Called DPI (%) RVPI (%) Multiple net IRR
1993-99 7 6 6 6 6 95.0 153.6 0.2 1.54 9.0
2000-04 13 13 13 13 7 99.8 99.7 58.5 1.54 8.8 2005-09 60 59 59 59 24 50.7 1.0 93.5 1.00 4.8
Source: Preqin
Called. There is little surprise that the majority of older funds have a call rate of around 100 percent. From 2004, the values go down, and the median percentage called in the third sub-period is 51 percent. However, there is a high degree of variation across funds even within vintage years.
Distributed. Three early vintages have achieved a DPI of 200 percent or over, but for vintages newer than 2003 the figures are generally very low. The strong fall over the vintage years is also reflected in the statistics of the three sub-periods. To date, only four funds have distributed over 200 percent and seven over 150 percent. Twenty-nine out of 78 funds are still at 0 percent and a further 15 funds have paid out less than 10 percent.
Remaining value. The RVPI is expectedly very low for older funds but the vintage-year median rises in 2000-03 and stabilizes at around 90 percent from 2004. This is also reflected in the median values for the three sub-periods as they rise from 0 to 59 percent and then to 94 percent.
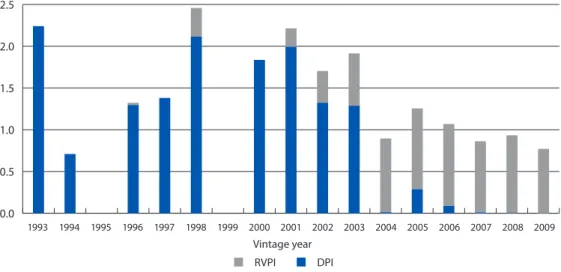
Figure 2 illustrates the development of DPI, RVPI and Multiple over vintage years. It is a snapshot as of September 2010 that shows how each vintage of infrastructure funds has performed on average. For example, column 2003 shows that infrastructure funds created in 2003 have distributed 1.29 times their paid-in capital and that the remaining value represents 0.63 times the paid-in capital. This implies a multiple of 1.92, the multiple being the sum of DPI and RVPI.
Figure 2. DPI, RVPI and Multiples over vintage years
DPI RVPI 1993 1994 1995 1996 1997 1998 1999 2000 2001 2002 2003 2004 2005 2006 2007 2008 2009 Vintage year 0.0 0.5 1.0 1.5 2.0 2.5 Source: Preqin Distributed to paid-in
ratios are generally very low for vintages newer than 2003.
Multiple. Figure 2 shows that multiples are highest for vintages in the early 2000s (abstracting from two individual high-performing funds in 1993 and 1998). Some new funds have multiples well below one, which may also reflect valuation adjustments in the financial crisis. Interestingly, the median values for Sub-periods I and II are identical at around 1.54 (see Table 3). The average values are a bit higher than the medians in all sub-periods.
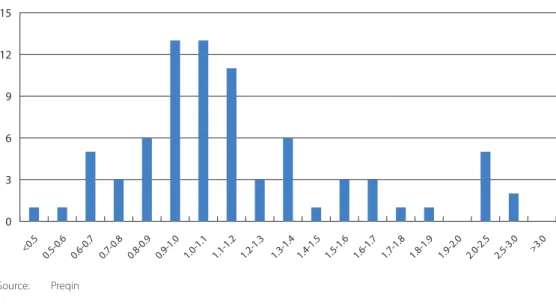
Taking all vintages over 17 years, the multiples show median and average values not much above one. The standard deviation is 0.47 while the first and third quartiles have values of 0.90 and 1.34, respectively. Figure 3 illustrates the frequency for different ranges of multiples.
Figure 3. Frequency chart for Multiples
<0.5 0.5-0.6 0.6-0.7 0.7-0.8 0.8-0.9 0.9-1.0 1.0-1.1 1.1-1.2 1.2-1.3 1.3-1.4 1.4-1.5 1.5-1.6 1.6-1.7 1.7-1.8 1.8-1.9 1.9-2.0 2.0-2.5 2.5-3.0 >3.0 0 3 6 9 12 15 Source: Preqin
6.4 Internal rates of return
The 37 funds in the Preqin infrastructure performance database reporting an IRR have the following distributions in terms of background characteristics:
GP base: 21 fund managers are based in the US, 10 in the UK and the remainder in France, •
Singapore and Canada;
Geographical focus: 7 funds invest globally, 10 predominantly in North America, 11 in Europe, 5 in •
Asia, 4 in Latin America;
Sector focus: 15 funds are multi-sector, 16 focus primarily on energy, 6 on social PPP/PFI projects; •
Project stage: appears to be evenly split between greenfield, brownfield and secondary stage •
(where known);
Size: there is an enormous spread of volumes across funds. The smallest fund has USD 63m, the •
largest USD 3.5bn. The median and average fund sizes are at around USD 1.0bn and USD 1.15bn, respectively (see Table 2).
Over the full period 1993-2007, there is a wide distribution of IRRs around the median of 5.5 percent and the average of 6.3 percent, with a standard deviation of 15.4 percent. The first quartile is negative, thus more than one quarter of the 37 funds have a negative IRR.
Figure 4 depicts the median and the average IRR for each sub-period. The median values are 9.0 percent (1993-1999), 8.8 percent (2000-2004) and 4.8 percent (2005-2007), respectively, while the average values
Taking all vintages over 17 years, the multiples show median and average values not much above one, with a standard deviation of 0.47.
are 11.2 percent, 11.4 percent and 3.6 percent. The difference between median and average values reflects the existence of individual outliers in Sub-period I (+41 percent) and Sub-period II (+24 percent and +28 percent). In Sub-period III, two more funds may be considered as outliers with values of +54 percent and –22 percent.
Figure 4. Median and average IRRs over vintage periods
2 4 6 8 10 12 2005-2007 2000-2004 1993-1999 IRR average Vintage period Per cen t IRR median Source: Preqin
Focusing on the recent past, there has been a remarkably sharp fall in vintage returns after 2003 as well as in distributions and multiples. The reason may be found in a combination of structural and cyclical factors. Given the J-curve effect, lower IRRs are indeed to be expected for more recent vintages. Furthermore, the increasing number of funds raised during the private-equity boom years (2004-2008) seem to be struggling to get their returns going. The capital is either not yet fully invested or was often invested in projects which faced subsequent downgrades in valuation.
6.5 Comparison with other private equity funds
In this section, infrastructure funds are compared to all private-equity funds and the most important categories buyout, venture, and private-equity real-estate funds14. Mezzanine funds are also added
because their investment characteristics might a priori be similar to those of infrastructure.15 Preqin
compiles benchmarks for the different categories of funds that go back to 1980 for buyout and venture-capital funds, to 1995 for real estate, to 1998 for secondaries and to 1996 for all other categories. Category All funds has double-digit median returns for virtually all vintages recorded from 1980 to 1997 and again from 2001 to 2003. The vintages of the late 1990s turn out weaker, while those from 2006 are still in negative territory so far.
Among the broad private-equity fund categories, the time profile of Buyout is broadly similar to that of All funds albeit with stronger vintages in the early 2000s. The pattern is similar for Real estate, but with more negative IRRs in recent vintages. Venture funds are behaving rather differently. The period of strong performance until 1997 has been followed by poor, and mostly negative, vintages ever since. As one would expect, mezzanine funds show smaller fluctuations over vintage years than other private equity funds.
14 For an analysis of private-equity real-estate funds using the Preqin database, see Tomperi (2010). He finds that performance increases with fund size but tends to decrease in follower funds of the same fund manager.
15 Further private-equity categories in the Preqin database are: distressed, early stage, secondaries and fund of funds. There has been a
remarkably sharp fall in vintage returns, distributions and multiples after 2003.
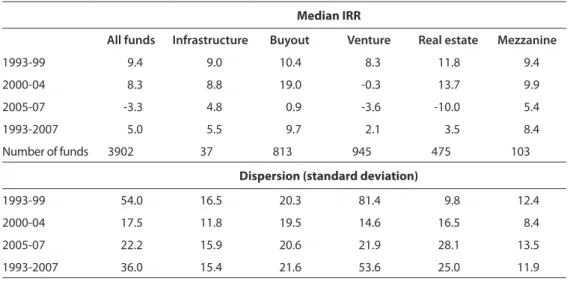
Table 4 compares the median returns of the different categories over the three sub-periods. The salient features include:
Period I: Infrastructure median IRR of 9 percent, similar to All funds and Mezzanine and slightly •
below Buyout and Real estate;
Period II: Infrastructure median of 8.8 percent, again close to All funds and Mezzanine but well •
below Buyout and Real estate; and
Period III: Infrastructure and Mezzanine with positive returns for the vintages (even for each •
vintage within the period) but near or below zero for other categories.
Table 4. Median and dispersion of returns in comparison
Median IRR
All funds Infrastructure Buyout Venture Real estate Mezzanine
1993-99 9.4 9.0 10.4 8.3 11.8 9.4
2000-04 8.3 8.8 19.0 -0.3 13.7 9.9
2005-07 -3.3 4.8 0.9 -3.6 -10.0 5.4
1993-2007 5.0 5.5 9.7 2.1 3.5 8.4
Number of funds 3902 37 813 945 475 103
Dispersion (standard deviation)
1993-99 54.0 16.5 20.3 81.4 9.8 12.4
2000-04 17.5 11.8 19.5 14.6 16.5 8.4
2005-07 22.2 15.9 20.6 21.9 28.1 13.5
1993-2007 36.0 15.4 21.6 53.6 25.0 11.9
Source: Preqin
Figure 5 depicts the IRR figures of Table 4, illustrating the soaring and then plummeting vintage returns for Buyout and Real estate, the under-performance of venture funds and the more stable returns for infrastructure and mezzanine funds over the sub-periods.
Figure 5. Median IRRs in comparison for sub-periods
-10 -5 0 5 10 15 20 25 2005-2007 2000-2004 1993-1999
Infrastructure All funds Buyout Venture Real estate Mezzanine
Vintage period
Per
cen
t
Source: Preqin
Vintage returns for Buyout and Real estate soared and plummeted while those for infrastructure and mezzanine funds were more stable.