200 |
P a g e
Optimization of MIG Welding Process Parameters on 316l
Stainless Steels Using Taguchi Technique
M.Shailaja
1*, A.Yakanna
21
Associate
Professor, Dept of ME, JNTUHCEJ.
*Corresponding Author
2M.Tech Student, Dept of ME, JNTUHCEJ.
Abstract:
Metal inert gas (MIG) welding is a semi - automatic or automatic arc welding process in
which a continuous and consumable wire electrode and a shielding gas are supplied through a welding
torch. MIG welding is one such welding process which is used extensively in the manufacturing field
due to its simplicity, versatility and capability to produce neat and strong joint. With the rise in the
economy recent research on welding is focused on the techniques to get the optimum results for
maximum production with minimum investment. The most important factors which affect the quality,
strength, productivity and cost of manufacturing are the welding parameters. In present work MIG
welding is performed by varying parameters such as welding current, welding voltage, gas flow rate,
feed rate and type of cooling medium. The performance measures like hardness, yield strength and
ultimate strength of welded stainless steel 316l plates are assessed. Experiment is performed
according to L16 mixed orthogonal array and optimal values are obtained from Taguchi technique.
KEY WORDS: MIG Welding, Welding parameters, Hardness, Strength, Taguchi, ANOVA.
INTRODUCTION
A continuous consumable electrode in the form of wire is supplied through a suitable gun which is used as both an electrode & filler material. Electrical energy converted in to heat energy which melts base metal when we maintain a small gap between electrode and work piece. Due to small air resistance electrons try to jump from negative electrode with high velocity. This kinetic energy is converted into heat and produces high temperature. The shielding gas (usually helium, argon) supplied from separate cylinder preventing the newly produced weld from surrounding atmospheric contamination.
201 |
P a g e
WELDING PROCESS PARAMETERS
Welding Current
As increasing the current will increase the width and depth of penetration and the size of weld bead increases. As the welding current increases wire feed rate also increases which results in higher rate of deposition. Lower the welding current for any given size of electrode produces poor penetration and also lower the strength of joint. For too high welding current the weld bead size is high and the deep penetration produces. Hence the filler metal wasted results in burn-through & undercut. Too low as well as too high current affects the tensile strength and ductility of weld metal.
Welding Voltage
Welding voltage controls the arc length, it is the distance from wire electrode tip to the weld pool
during welding. When the welding process parameters like electrode size and composition, shielding gas type, and the welding operation held constant, the arc length varies directly with arc voltage. With increasing the voltage the section of weld bead turns into wider and flatter. High as well as low voltages results in an unstable arc. High voltage produces excessive spatter & porosity. Low voltage causes narrower weld beads with high crown.
Travel Speed
It is defined as speed at which the MIG torch travels along with the work. In semi-automatic welding, travel speed is handled by welder and by machine in automatic welding process. The arc travel speed effects on welding same way as the arc voltage. The weld penetration first increases and is maximum at a given travel speed and then decreases with increasing it. For any given current, lower travel speeds provide larger beads & higher heat input because longer heating time. The high heat supply increases the penetration and the metal deposit rate per unit length. The lower travel speed causes lower penetration, slag inclusions, poor fusion and porosity.
Gas Flow Rate
In MIG welding Shielding gas are used to protect melted weld pool from atmospheric conditions. Helium, argon, carbon dioxide and sometimes mixture of them can be used. Appropriate gas flow rate should use in order to get good welding. Increasing gas flow rate weld quality also increases and after reaching maximum value it starts decreasing. High gas flow rate leads to excessive weld spatter, uneven weld deposition, porosity, and mechanical properties also decreases.
Cooling Medium
202 |
P a g e
in increasing hardness and strength of the joint. For stainless steel 316l alloy water quenching doesn’t affect the
hardness.
Other parameters like electrode diameter, electrode sickout, type of joint and shielding gas type etc also affect weld quality.
The objective of the present work is to analyse the effect of current, voltage, feed rate, gas flow rate, and type of cooling on welding characteristics (hardness, yield strength, & ultimate tensile strength) and optimization of the welding parameters of metal inert gas welding to achieve optimized value using Taguchi robust design methodology and also effect of each parameter on hardness and strength of welded joint is analysed. Many researchers worked on effect of welding parameters and attempted on optimization of parameters and characteristics.
Vikas Chauhan et al. [1]have optimized the process parameters of MIGW for SS-304 and low carbon steel using Taguchi technique. Three MIG welding parameters viz. voltage, current and weld speed were selected for optimization. The analysis for signal-to-noise ratio was done for higher-the-better quality characteristics. The effect of each selected parameter was investigated by using the ANOVA. Lastly the confirmation tests were conducted to compare the concluded values with the experimental values. Salawadagi Sushant S., Kumbhar S et al. [2] researched the influence process parameters of MIG welding viz. welding speed, weld current and weld plate angle. The ANOVA and GRA method is used by considering residual stress as output parameter. R Raman Mishra et al. [3] have analysed on dissimilar metal joint as a structural material used in various applications which provided good combined mechanical properties i.e. corrosion resistance, strength with low cost. In this study, stainless steel grades 316, 310, 304 and 202 were welded with mild steel by TIG and MIG welding processes. The percentage of dilutions of weld and tensile strength ware investigated. The comparison of results is done for different joints welded by TIG &MIG welding technique. It was concluded that TIG welded joints have better mechanical properties than MIG welded joints. S.R. Meshram and N.S. Pohokar et al [4]studied the influence of process parameters MIGW like voltage, gas flow, welding speed, electrode gap and feed rate by using ANOVA methodology. Penetration value and UTS are taken as observed parameters. From result, it was concluded that increasing the welding current, UTS and depth of penetration increases. On the other hand, welding speed and arc voltage is another parameter that influenced the value of UTS. Bhargav Patel, Jaivesh Gandhi et al. [5]researched the effect of process parameters of MIGW like welding speed, arc voltage, gas flow and welding current are taken as input parameters and Tensile strength is taken as output parameter. ANOVA software is used to analyse effect of each parameter on it. It was observed that increasing current results in increased the UTS value. Moreover, voltage is another parameter which increases the value of UTS. However, its effect is not as much as current. Pawan Kumar et al. [6] have studied the Taguchi’s design method for optimization of GMAW of Stainless Steel. The input parameters considered here are welding voltage, welding current& gas flow. In this work, L9orthogonal array is used and total nine experiments were performed.
203 |
P a g e
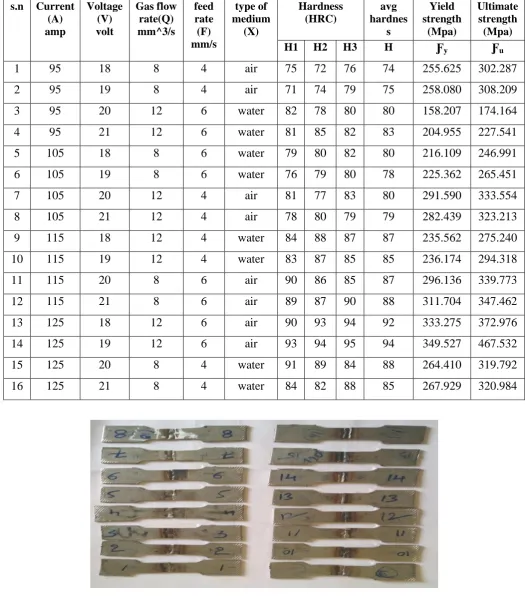
EXPERIMENT PROCEDURETotal 16 experiments were run to investigate effect of welding parameters on MIG welding. These analyses have been under taken to inspect the effect of voltage, welding current, feed rate, gas flow rate, & type of cooling on the hardness and yield strength and ultimate strength and presented in Table 4 . The stainless steel 316l is welded by MIG welding machine using SS 316l as electrode wire. Specifications of MIG welding machine, description of work piece material and tool material are presented in the following tables. MIG welding is carried out and after grinding work pieces are tested for hardness on Vickers hardness tester as shown in Figure 2. Testing is done at three places on welded portion on work piece. Three hardness results obtained are noted and average of three is taken as final hardness value. Yield strength & ultimate tensile strength obtained from universal testing machine.
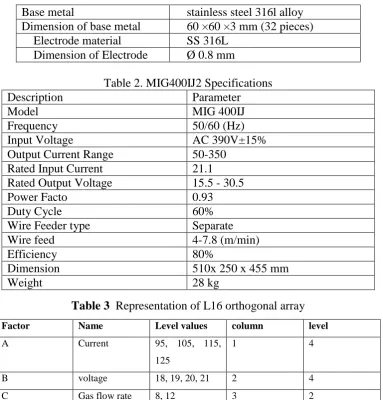
Table 1
.
Description of work piece material and tool material
Base metal
stainless steel 316l alloy
Dimension of base metal
60 ×60 ×3 mm (32 pieces)
Electrode material
SS 316L
Dimension of Electrode
Ø 0.8 mm
Table 2. MIG400IJ2 Specifications
Description
Parameter
Model
MIG 400IJ
Frequency
50/60 (Hz)
Input Voltage
AC 390V±15%
Output Current Range
50-350
Rated Input Current
21.1
Rated Output Voltage
15.5 - 30.5
Power Facto
0.93
Duty Cycle
60%
Wire Feeder type
Separate
Wire feed
4-7.8 (m/min)
Efficiency
80%
Dimension
510x 250 x 455 mm
Weight
28 kg
Table 3
Representation of L16 orthogonal array
Factor Name Level values column level
A Current 95, 105, 115, 125
1 4
B voltage 18, 19, 20, 21 2 4
C Gas flow rate 8, 12 3 2
D Feed rate 4, 6 4 2
204 |
P a g e
Table 4
Influence of design parameters on strength and hardness
Figure 2
Welded pieces after UTM test
s.n Current
(A)
amp
Voltage
(V)
volt
Gas flow
rate(Q)
mm^3/s
feed
rate
(F)
mm/s
type of
medium
(X)
Hardness
(HRC)
avg
hardnes
s
Yield
strength
(Mpa)
Ultimate
strength
(Mpa)
H1
H2
H3
H
Ƒ
yƑ
u1
95
18
8
4
air
75
72
76
74
255.625
302.287
2
95
19
8
4
air
71
74
79
75
258.080
308.209
3
95
20
12
6
water
82
78
80
80
158.207
174.164
4
95
21
12
6
water
81
85
82
83
204.955
227.541
5
105
18
8
6
water
79
80
82
80
216.109
246.991
6
105
19
8
6
water
76
79
80
78
225.362
265.451
7
105
20
12
4
air
81
77
83
80
291.590
333.554
8
105
21
12
4
air
78
80
79
79
282.439
323.213
9
115
18
12
4
water
84
88
87
87
235.562
275.240
10
115
19
12
4
water
83
87
85
85
236.174
294.318
11
115
20
8
6
air
90
86
85
87
296.136
339.773
12
115
21
8
6
air
89
87
90
88
311.704
347.462
13
125
18
12
6
air
90
93
94
92
333.275
372.976
14
125
19
12
6
air
93
94
95
94
349.527
467.532
15
125
20
8
4
water
91
89
84
88
264.410
319.792
205 |
P a g e
In this experimental work L16 mixed orthogonal array was used. This array consists of five parameters and four levels for two parameters (current, voltage) and two levels for three parameters (gas flow rate, feed rate, type of medium) as illustrated in table 6.2. In this Taguchi technique, all the experimental values are determined based on “larger is the better”. Thus in this work, the observed values of hardness, yield strength &
ultimate strength were set to maximum. Then, the optimum observed values were calculated by comparing the standard analysis & analysis of variance which was based on the Taguchi method
In this study, Taguchi's DOE software (Quality- 4) is used to calculate the effects of the process parameters, to perform the analysis of variance (ANOVA) and to evaluate the optimum conditions.
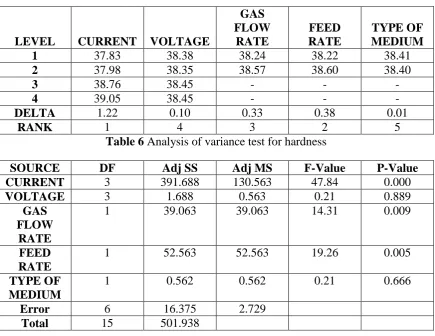
Table 5
Response table for signal to noise ratio for hardness
LEVEL
CURRENT VOLTAGE
GAS
FLOW
RATE
FEED
RATE
TYPE OF
MEDIUM
1
37.83
38.38
38.24
38.22
38.41
2
37.98
38.35
38.57
38.60
38.40
3
38.76
38.45
-
-
-
4
39.05
38.45
-
-
-
DELTA
1.22
0.10
0.33
0.38
0.01
RANK
1
4
3
2
5
Table 6
Analysis of variance test for hardness
SOURCE
DF
Adj SS
Adj MS
F-Value
P-Value
CURRENT
3
391.688
130.563
47.84
0.000
VOLTAGE
3
1.688
0.563
0.21
0.889
GAS
FLOW
RATE
1
39.063
39.063
14.31
0.009
FEED
RATE
1
52.563
52.563
19.26
0.005
TYPE OF
MEDIUM
1
0.562
0.562
0.21
0.666
Error
6
16.375
2.729
Total
15
501.938
Results obtained from ANOVA software, the delta value indicate difference between highest & lowest average value for each parameter. Rank 1 is given to maximum delta value that is welding current & rank 2 given to the second maximum i.e feed rate, and so on, to indicate the relative effect of each factor on response. Hence current, feed rate, and gas flow rate are mostly effect on hardness hence is given by first three ranks. Voltage and type of medium are least effect on hardness and hence given fourth and fifth rank respectively.
206 |
P a g e
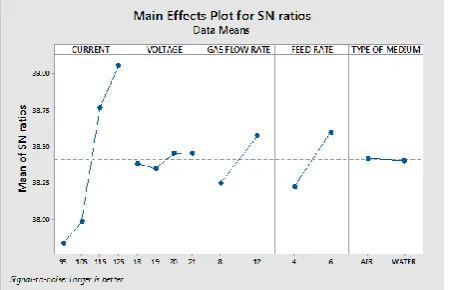
Figure 3
Main effective plots for SN ratio for hardness
From above graphs we can conclude that hardness varies with current which increases with increase in current and is maximum when current value taken as 125 amp and minimum at 95 amp. For voltage when we take 21 volts gives maximum hardness. Hardness increases with raise in both gas flow rate & feed rate and is maximum for 12 mm^3 /sec and 6 mm/sec respectively. Type of medium didn’t affect much on hardness.
Regression Equation
HARDNESS = 83.438- 5.438 CURRENT_95- 4.187 CURRENT_105+3.313
CURRENT_115+ 6.313 CURRENT_125-0.188 VOLTAGE_18- 0.438 VOLTAGE_19+
0.312 VOLTAGE_20- 0.313 VOLTAGE_21+ 1.563 GAS FLOW RATE_12+ 1.563 GAS
FLOW RATE_8- 1.813 FEED RATE_4+ 1.813 FEED RATE_6+ 0.187 TYPE OF
MEDIUM_AIR- 0.187 TYPE OF MEDIUM_WATER.
Table 7
Response table for signal to noise ratio for yield strength
Level
CURRENT VOLTAGE
GAS
FLOW
RATE
FEED
RATE
TYPE OF
MEDIUM
1
46.65
48.19
48.31
48.33
49.42
2
48.02
48.41
48.10
48.07
46.99
3
48.55
47.79
4
49.58
48.42
Delta
2.93
0.63
0.21
0.25
2.43
Rank
1
3
5
4
2
Table 8
Analysis of variance test for yield strength
Source
DF
Adj SS
Adj MS
F-Value
P-Value
CURRENT
3
28748.3
9582.8
15.84
0.003
VOLTAGE
3
4059.7
1353.2
2.24
0.185
GAS FLOW RATE
1
19.3
19.3
0.03
0.864
FEED RATE
1
79.7
79.7
0.13
0.729
TYPE OF MEDIUM
1
28100.2
28100.2
46.44
0.000
Error
6
3630.6
605.1
207 |
P a g e
From table 7 delta value for both current and type of medium is 2.93 and 2.43 and given by Rank 1 & Rank 2 respectively. Gas flow rate & feed rate is least effect on yield strength and hence is given by rank5 and rank4 respectively. From table 8 P value for both type of medium and current is 0.000 & 0.003 are less than 0.005 hence are effects mostly on yield strength.
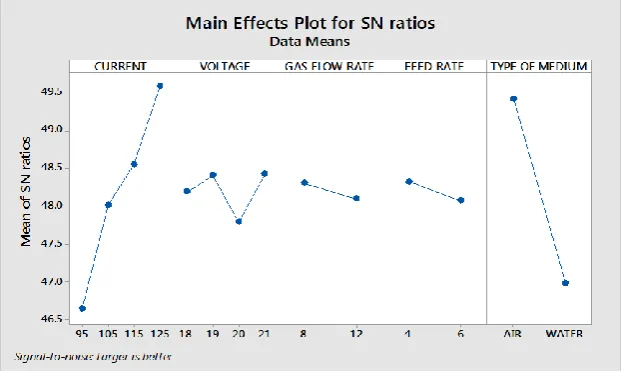
Figure 6.2
Main effects plot for SN ratio for yield strength
Yield strength increases with increase in current and maximum at 125 amps and minimum at 95 amps. Voltage gives maximum yield strength at 21 volts. Gas flow rate and feed rate are not effect on yield strength. Type of medium relatively mostly effect on yield strength and is maximum when cooling is done in air.
Regression Equation
YIELD STRENGTH = 283.26- 51.36 CURRENT_95- 17.7 CURRENT_105+ 5.1
CURRENT_115+ 59.5 CURRENT_125- 9.5 VOLTAGE_18+25.7 VOLTAGE_19-16.4
VOLTAGE_20- 2.7 VOLTAGE_21- 1.26 GAS FLOW RATE_8+ 1.26 GAS FLOW
RATE_12+ 2.73FEED RATE_4- FEED RATE_6+ 39.49 TYPE OF MEDIUM_AIR- 39.49
TYPE OF MEDIUM_WATER.
Table 9
Response table for signal to noise ratio for ultimate strength
Level
CURRENT VOLTAGE
GAS
FLOW
RATE
FEED
RATE
TYPE OF
MEDIUM
1
47.84
49.42
49.67
49.80
50.79
2
49.25
50.26
49.45
49.32
48.34
3
49.90
49.00
4
51.26
49.57
Delta
3.43
1.26
0.22
0.48
2.45
208 |
P a g e
Table 10
Analysis of variance test for ultimate strength
Source
DF
Adj SS
Adj MS
F-Value
P-Value
CURRENT
3
28748.3
9582.8
15.84
0.003
VOLTAGE
3
4059.7
1353.2
2.24
0.185
GAS FLOW RATE
1
19.3
19.3
0.03
0.864
FEED RATE
1
79.7
79.7
0.13
0.729
TYPE OF MEDIUM
1
28100.2
28100.2
46.44
0.000
Error
6
3630.6
605.1
Total
15
64638.0
From table 9 delta value for both current and type of medium is 3.43 and 2.45 and given by rank1 & rank2 respectively. Gas flow rate and feed rate is least effect on ultimate strength and hence is given by rank5 and rank4 respectively. From table 10 P value for both parameters, type of medium and current is 0.000 & 0.003 are less than 0.005 hence are effects mostly on ultimate strength.
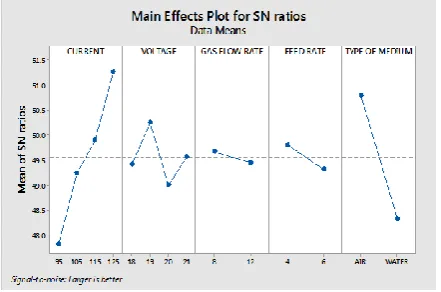
Figure 6.3
Main effects plot for SN ratio for ultimate strength
Ultimate strength increases with increase in current and maximum at 125 amps and minimum at 95 amps. Voltage gives maximum ultimate strength at 19 volts. Gas flow rate doesn’t effect on ultimate strength. Maximum ultimate strength obtained when feed rate is 4 mm/sec. Type of medium relatively mostly effect on ultimate strength and is maximum when cooling is done in air.
Regression Equation
ULTIMATE STRENGTH = 307.47- 54.4
CURRENT_95- 15.2
CURRNT_125+ 6.7
209 |
P a g e
CONCLUSIONS
The following conclusions were made out by this project:
It is concluded that welding current & feed rate have a significantly influence on hardness of joint
and type of medium is not effect much on hardness. Welding current and type of medium have effect on both yield strength and ultimate strength of welded plate.
It is concluded that when current 125 amp, voltage 21 volts, gas flow rate12 mm^3 /sec, and feed rate 6
mm/sec, at specified values hardness is optimum.
It is concluded that when current 125 amp, voltage 21 volts, gas flow rate 8 mm^ /sec, feed rate 4
mm/sec, and air cooling, gives optimised yield strength.
It is concluded that when current 125 amp, voltage 19 volts, gas flow rate 8 mm^ /sec, feed
rate 4 mm/sec, and air cooling gives optimised ultimate strength.
It is also concluded that with increase current response values hardness, yield strength & ultimate
strength increases.
REFERENCES
[1] S. C. Juang and Y. S. Tarng. , Process parameters selection for optimizing the weld pool geometry in the tungsten inert gas welding of stainless steel. J. of Materials Processing Technology, Vol. 122, 2002, 33-37 (2002)
[2] Tarng YS, Yang WH., Optimization of the weld bead geometry in gas tungsten arc welding by the Taguchi method. Int J Adv Manuf Technol 14: 549–554 (1998).
[3] K. H., Lee, B. S., Hong, J. K., Son, and Y. H., Han, Optimization of Nd:YAG laser welding process parameters for enclosing ends of titanium tube. J. of Materials Science & Engg, Vol. A415, pp. 149-155 (2006). [4] K. L., Pan, C. P., Wang, C. Y., Hsiso and C. K., Hog, Optimization of Nd-YAG laser welding on Mg alloy using Taguchi method. J. of Optics and Laser Tech, Vol. 37, pp. 33-42 (2004)
[5] I. Z.,Ibrahim, et al., The effect of MIG welding parameters on different output parameters. Procedia Engineering 41:1502-1506 (2012)
[6] S. R. Parmar. and N. Murugan., effects of MIG welding parameters on geometry of the weld bead of stainless steel. J. of Materials Processing Tech, Vol. 41, pp. 381-398 (1994)
[7] T.Senthil., et al., effect of welding current of TIG welding on tensile properties of AL 6061 alloy. Materials and Design 28: 2080-2092 (2007)
[8] Sompong, P., Santirat, N., and Sittichai, K., Study of MIG welding affecting physical properties of stainless steel 304l. World Academy of Science, Engg and Technology: 61:402–405 (2012)