a Corresponding author: mariya.brovchenko@irsn.fr
Neutron-gamma flux and dose calculations in a Pressurized
Water Reactor (PWR)
Mariya Brovchenko1 a, Benjamin Dechenaux1, KennethW. Burn2, Patrizio Console Camprini2, Isabelle Duhamel1, and
Arthur Peron3
1Institut de Radioprotection et de Sûreté Nucléaire (IRSN), Fontenay-aux-Roses, 92260, France 2ENEA, Via M.M.Sole, 4, 40129 Bologna, Italy
3IRSN subcontractor
Abstract. The present work deals with Monte Carlo simulations, aiming to determine the neutron and gamma responses outside the vessel and in the basemat of a Pressurized Water Reactor (PWR). The model is based on the Tihange-I Belgian nuclear reactor. With a large set of information and measurements available, this reactor has the advantage to be easily modelled and allows validation based on the experimental measurements. Power distribution calculations were therefore performed with the MCNP code at IRSN and compared to the available in-core measurements. Results showed a good agreement between calculated and measured values over the whole core. In this paper, the methods and hypotheses used for the particle transport simulation from the fission distribution in the core to the detectors outside the vessel of the reactor are also summarized. The results of the simulations are presented including the neutron and gamma doses and flux energy spectra. MCNP6 computational results comparing JEFF3.1 and ENDF-B/VII.1 nuclear data evaluations and sensitivity of the results to some model parameters are presented.
1
Introduction
The Institute of Radiological Protection and Nuclear Safety (IRSN) acts as technical support to the French nuclear safety authorities. In this context, one of its missions is to improve nuclear safety through the enhancement of knowledge regarding operating nuclear power reactors. The issues concerning the aging and the characterisation of the reactor vessel require knowledge of the neutron and gamma radiation environment on the vessel and beyond.
Since few years, ENEA (Energia Nucleare e Energie Alternative, i.e. Nuclear Energy and Alternative Energy agency) and IRSN collaborate on Monte-Carlo simulations and Variance Reduction Techniques (VRT), which are used to determine neutron and gamma spectra in and out of the core.
Additionally, IRSN participates in the DISCOMS project [1], which stands for “DIstributed Sensing for COrium Monitoring and Safety”, aiming at examining the status of the third barrier of confinement, in order to define possible mitigation strategies in case of a severe accident, namely: i) reactor pressure vessel breakthrough and corium relocation outside the vessel, ii) reactor pit concrete erosion and iii) corium cooling. One of the IRSN tasks in the frame of the DISCOMS project is to provide the radiation level in terms of neutron and gamma doses and flux energy spectra at various locations.
The work presented in this paper summarizes the studies performed on the radiation transport in the Tihange-I Belgian nuclear reactor and contributes to several issues requiring the knowledge of the radiation environment in and outside the reactor vessel.
2 Neutron flux distribution in the core
Tihange-I is a Pressurized Water Reactor (PWR), producing a nominal electric power of 900 MW. Following the first divergence of the core in 1975, start-up physics tests were performed. In this work, the authors used the data from the Hot Zero Power (HZP) tests, namely the flux distribution measurements that are freely available [2], and thus, were able to validate the calculations of the neutron fission distribution in the core. It is a tremendous advantage to have the possibility to validate the fission distribution in the core, since it is then used as the source term in the fixed source transport calculation to determine the neutron and gamma spectra outside the core.
2.1 Core model
conditions can be used). For this configuration, two separate measurement campaigns were executed, one by FRAMATOMEa and another one by EDF, that resulted in two different fission distribution maps over a 1/8th slice of the core [2]. The moderator temperature and the boron concentration were measured, and these values were adopted for the modelling. The studied configuration corresponds to the case where no control rods are inserted into the core. Unfortunately, no information was available to the authors on the methods used to obtain the flux distribution maps, neither on the uncertainty of the values.
Power distribution calculations were made with the MCNP5 Monte Carlo code [3] that allows a detailed 3D geometry description of the core, as shown in figure 1.
Fig. 1. Pin by pin modelling in the MCNP model, with 12 poisoned fuel rods and 9 guide tubes
2.2 Neutron flux distribution validation
An accurate neutron fission source distribution is a key ingredient to perform irradiation calculations outside the reactor primary vessel. The comparison of the flux distribution in the core allows core simulations on a realistic case to be validated. The measured and calculated flux distribution assembly by assembly is given in figure 2, corresponding to a 1/8th slice of the core. The statistical errors associated with these data are very low < 1%.
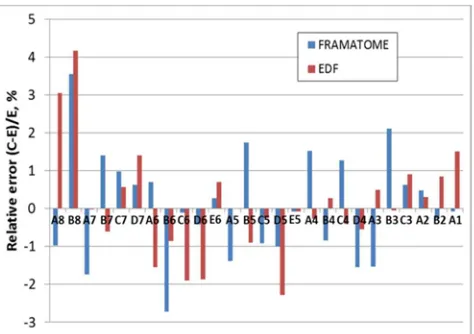
The relative errors between the calculated and the measured flux distribution are given in figure 3. Almost all discrepancies are lower than 2%. The major discrepancies are observed in the assemblies on the edge of the core. It should be noticed that the differences between the two sets of measurements and between measurements and calculations are of the same magnitude. Since no measurement uncertainty is provided, the calculated values can be considered in agreement with experimental ones.
A B C D E
1
1.086 1.069
1.085
2
1.087 1.081
1.089 1.069 Framatome
1.092 1.078 EDF
3
1.090 1.066 1.074 MCNP
1.068 1.089 1.071
1.073 1.088 1.081
4
1.066 1.078 1.076 1.099 1.085 1.066 1.094 1.088
1.082 1.069 1.090 1.082
5
1.074 1.050 1.066 1.075 0.901
1.059 1.078 1.059 1.089 0.901
1.059 1.068 1.056 1.064 0.900
6
1.049 1.065 0.986 0.940 0.709
1.073 1.045 1.004 0.954 0.706
1.056 1.036 0.985 0.936 0.711
7
1.033 1.037 0.968 0.648 1.015 1.058 0.972 0.643
1.015 1.052 0.977 0.652
8
0.921 0.675 0.885 0.671
0.912 0.699
Fig. 2. Flux distribution in each assembly for a 1/8th slice of the core, experimental measurements and simulation results with MCNP5 and nuclear data library ENDF-B/VII.1. The assembly A1 corresponding to the central assembly of the core.
Fig. 3. Relative error (C-E)/E of the calculated flux distribution C compared to the experimental measurements E
3 Fixed source calculations
3.1 Model
Hypotheses maximizing the radiation transport through the lower part of the vessel were adopted for this model. The radial positions of the piercing tubes were based on the information from [2].
Fig. 4. Modelling of the internals and supporting structures in the bottom of the vessel
The responses of interest are defined on surfaces/volumes with symmetry around the Z-axis. The detectors were placed outside the vessel at the level of the active core. The responses were calculated with an axial segmentation, as detailed in figure 5. The radiation was also studied under the vessel bottom on the basemat surface and at different depths inside the basemat. As shown in figure 6, the reactor pit is divided into 3 rings.
Fig. 5. Positions of the responses on the side of the vessel with the adopted axial segmentation
Fig. 6. Positions of the responses on the bottom of the basemat with a radial segmentation in 3 rings
3.2 Source term
The only source term considered in these calculations is the fission neutrons. The activation of structures outside the core is not taken into account in this study although it is, a priori, not negligible.
Previous studies showed that a flat radial distribution within an assembly leads to an overestimation of the responses outside the vessel [4]. For this reason, in this study the fission source distribution was defined in each pin.
The source term was calculated in two different ways: one by IRSN, the other by ENEA. The calculations were performed using MCNP6 [5]. In both sources, the radial fission distribution within a pin was considered as flat.
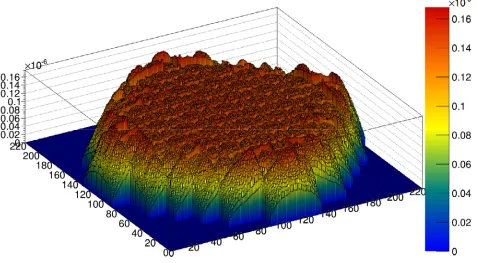
The fission source calculated by IRSN was based on 300 independent fundamental mode calculations with 5.107 simulated histories each, after 400 inactive cycles and using 100 000 particles per cycle. These calculations allowed a maximal standard deviation of the mean of 0.5% to be obtained in each pin. The axial distribution was taken as identical for all the pins in the core and 200 segments were used. This hypothesis was verified by considering the axial distribution in ten different pins. The nuclear data library used for the neutron source calculation was ENDF-B/VII.1.
Fig. 7. Fission rate distribution in the core in arbitrary units evaluated by IRSN, each segment corresponding to a fuel pin
The fission source calculated by ENEA employed the nuclear data library JEFF-3.1 and was based on 512000 fission neutrons per cycle and 3600 cycles after the fundamental mode had been reached. An axial segmentation of 21 bins was employed. The lengths of the bins were not equal: the length of the first bin at the bottom of the fissile zone was 1 cm, then the length was doubled for each interval up to 16 cm, then 12 intervals each of length 24 cm, then the length was gradually reduced to finish at 8 cm for the top interval. The same axial segmentation was employed for all the bins. A separate axial variation of the neutron source for each pin was written. The resulting standard deviations on the source in each pin segment as given by MCNP (i.e. between source fission neutron histories and ignoring correlations) was typically 1% or less for the 24 cm central segments and 10-15% for the lowest 1 cm segment, apart from the external corner assemblies for which for the outer pins the deviations were 2% for the central segments and as much as 30% for the lowest segment.
It is not possible to define such a pin-by-pin source with a different axial variation for each pin in standard MCNP. Therefore the code had to be modified to accept the ENEA and the IRSN source.
The radiation source in this problem being the fissions occurring in the core of the reactor, the flux of neutral particles is strongly attenuated, especially in the concrete of the basemat. Therefore, such neutron-gamma shielding calculations require the use of variance reduction techniques.
3.3 Variance reduction methods
In such problems, the positions of the responses (beside the vessel, at the vessel bottom, within the basemat) and the physical quantities (gamma dose, fast and thermal neutrons) are numerous. Optimizing the set of importance maps (neutrons and gamma rays for different energy groups) to all of the responses is a challenge.
For this reason, the variance reduction (VR) parameters were calculated at ENEA using a detailed mathematical approach called the DSA (Direct Statistical Approach) that optimizes the VR parameters that govern the sampling [6]. The approach has been extended to include among other options, weight control and a multi-response capability [7].
The VR parameters calculated with the DSA can then be translated into classical Weight Window maps implemented in the MCNP code. The fixed source calculations were performed at IRSN using the Weight Window maps based on the VR parameters calculated with the DSA at ENEA.
a high probability of passing through the region without collision (for example in the case of air).
Fig. 8. Weight window parameters for neutrons with energy 2-5 MeV based on the DSA calculations
The Weight Window parameters for gamma rays with energy of 0.7-1.5 MeV are shown in figure 9. The white region in the core demonstrates that the gamma rays in this energy group created in the core by capture or fission do not contribute to any response outside the vessel (i.e. the importance is too low).
Fig. 9. Weight window parameters for gamma rays with energy 0.7-1.5 MeV based on the DSA calculations
4 Results
First, the results of the calculations and comparisons between the fixed source calculations performed at IRSN using ENDF-B/VII.1 library, and, at ENEA with JEFF-3.1 one, are presented in the following. Additional sensitivity calculations were performed at IRSN to see
the impact of different physical parameters on the results and are detailed below.
4.1 Comparison of the two simulations
The axial distribution of the neutron flux on the side of the vessel (see figure 5) is presented in figure 10 for the simulations performed at IRSN and at ENEA. The neutron flux is divided into 3 groups: En < 0.1 MeV, 0.1 – 1 MeV, 1 – 20 MeV. Since irradiation effects on the vessel material is mainly due to rather fast neutrons, the neutrons with En > 0.1 MeV and En > 1 MeV were separated. The standard deviation of the calculations is presented in some figures, and is in most cases not visible since very low (< 1%).
The neutron flux behaviour in the figure 10 for the two simulations is very similar. Only small differences can be observed for the lower energy neutrons En< 0.1 MeV, that may be due either to the different nuclear data used or to the different source term definitions used in the simulations.
Fig. 10. Neutron flux axial distribution on the side of the vessel for 3 energy groups calculated by IRSN and ENEA
The energy distribution of the neutron flux is presented in figure 11. The neutron spectra for the central and the lower axial parts are very similar. On this logarithmic scale plot, the slight difference in the low energy neutrons observed previously cannot be seen anymore due to the scale of the figure. The slight differences between the two simulations for the neutrons with Enaround 10-3 eV at the lower segment between the two simulations is due to the low statistics, and is not of high interest here.
Fig. 11. Neutron spectra for the central part (segment 5) and the lower axial part (segment 9) on the side of the vessel calculated by IRSN and ENEA
Concerning the gamma rays, the energy spectra are presented in figure 12. As for neutrons, the total gamma ray flux in axial segment 5 is higher by a factor of 2 than the axial segment 9, even if the energy spectrum is in both cases very similar. Between the two simulations of IRSN and ENEA no difference can be observed, except for very low energy gamma rays Eg < 30 keV and very high energy rays Eg > 12 MeV, due to low sampling in these regions.
Fig. 12. Gamma ray spectra for the central part and the lower axial part on the side of the vessel calculated by IRSN and ENEA
Figure 13 illustrates the neutron spectra on the basemat for the three rings detailed in figure 6. The fast component of the neutron spectrum is much lower compared to the spectrum on the side of the vessel. The central ring in the basemat, directly under the vessel, has a slightly lower flux, especially for the faster component compared to the external rings. A good agreement can be observed between the two simulations.
Fig. 13. Neutron spectra for the 3 rings in the basemat under the vessel calculated by IRSN and ENEA
Concerning the gamma ray flux on the basemat, the results are presented in figure 14. No significant difference can be observed between the different rings, nor between the two simulations, except for Eg > 12 MeV.
Fig. 14. Gamma ray spectra for the central and the 1st rings in the basemat under the vessel calculated by IRSN and ENEA
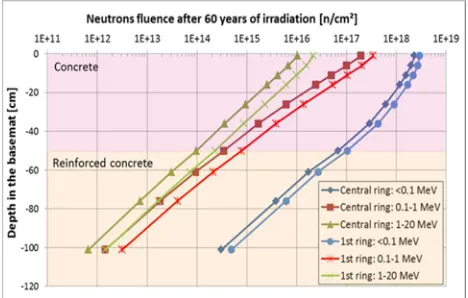
To give an idea of the neutron fluence in the basemat, considering the strong hypothesis that the presented reactor modelling is representative of the whole lifetime of the reactor (assumed to be 60 years), figure 15 shows the neutron fluence attenuation in the basemat for the 3 energy groups described previously based on calculations performed at IRSN. It is to be noticed that only the fastest component has an exponential attenuation in the basemat, since the two other groups have in addition to the attenuation also a “production” contribution due to the moderation of the neutrons in the concrete. The reinforcement in the concrete has no significant impact on the attenuation of the fast neutrons.
Fig. 15. Neutron fluence attenuation for 3 energy groups and different rings in the basemat
Fig. 16. Gamma kerma in silica attenuation for different rings in the basemat
4.2 Parameter sensitivity study
Varying different physical parameters of the nuclear reactor model gives an idea of the importance of these parameters on the calculated results. Instead of varying the geometrical dimensions, the densities/concentrations of different materials were modified. The variation of the parameter is not to be considered as real value since it was chosen to be high enough so as to be able to detect an impact on the calculated results.
To observe the impact of the water layer thickness inside the vessel (radial part) and in the bottom of the vessel, the water density was decreased by a factor of two. To observe the impact of the total steel thickness inside the vessel, composed of the thermal protection and the baffle, its density was decreased by a factor of two. Finally, the boron concentration was changed from 650 ppm to 0 ppm, to check if it has an impact on the radiation transport out of the vessel.
In figure 17 the impact of each parameter variation separately on the neutron flux spectrum on the side of the vessel in the central axial part is presented. As expected, almost no impact can be observed for the water density variation in the bottom of the vessel. Boron concentration variation has similarly no significant impact on the neutron flux except on the limits of the spectrum (low and high energy neutrons), which might be due to lower sampling. Steel thickness has an impact on the neutron flux, quietly proportional to the density variation, with a higher impact on the faster neutrons En > 1 MeV. The density of the water located in the vessel has an even higher impact. It can reach a factor of 4 to 5 on the neutron flux, except the fast neutrons with En > 1 MeV, where the impact is only of a factor 2 to 3.
Similar tendencies were observed for the gamma ray spectrum at the same location (see figure 18). Boron concentration modification has small impact on the overall gamma flux. The water density in the bottom of the vessel has no significant impact on the gamma flux. Decreasing steel density increases the gamma flux on the side of the vessel by a factor of 2 to 3, as for the neutrons,
while the gamma flux increases by a factor of 3, with the water density reduction in the vessel.
Fig. 17. Neutron spectrum for parameter modification over the reference case values
Fig. 18. Gamma ray spectrum for parameter modification over the reference case values
For these sensitivity calculations, other responses were also analysed, but are not presented here. It is nevertheless interesting to mention that for the neutrons and gamma rays on the basemat, the water density in the bottom of the vessel has no significant impact.
Concerning the variance reduction methods employed here, it is important to mention that the particle streaming through the piercing tubes (see figure 4) was not sampled in the runs that generated the VR parameters. This effect may not be negligible and will be examined separately.
5 Conclusion
In the framework of different R&D activities, IRSN aims to study the radiation environment in terms of neutron and gamma fluxes outside the vessel during the reactor operation.
The results of the fixed source ex-core calculations performed at IRSN and at ENEA using different nuclear data and different neutron-source spatial definition have shown a very good agreement. The variance reduction parameters optimized for the set of different neutron and gamma responses outside the vessel calculated by ENEA were used by both institutes. Then, the gamma ray and neutron spectra were evaluated outside the vessel. The neutron fluence and gamma kerma attenuation in the basemat concrete results were presented. From the parameter variation study, it was shown that the water thickness and the total steel thickness have a high impact on the neutron and gamma ray flux outside the vessel.
Acknowledgment
The IRSN work presented in this paper is co-funded by the French “Programme Investissements d'Avenir” referenced by n° ANR-11-RSNR-0007 and managed by ANR (National Research Agency).
References
1. P. Ferdinand et al., “DISCOMS: DIstributed Sensing for COrium Monitoring and Safety”, CANSMART 2015: International Conference on Smart Materials and Structures - Vancouver, BC, Canada (2015) 2. H. Panek ”Qualification du système NEPTUNE –
Ébauche d’une nouvelle chaîne de calcul basée sur les codes APOLLO et Tortise”, Note CEA-N-2092, (1979)
3. X-5 Monte Carlo Team, ”MCNP - A general Monte Carlo n-particle transport code, version 5”, Los Alamos National Laboratory, (2005)
4. M. Brovchenko et al., “Neutron-gamma flux and dose calculations for feasibility study of instrumentation implementation in the European Pressurized Reactor (EPR)”, submitted to ICRS-13 & RPSD-2016
5. T. Goorley et al., ”Initial MCNP6 Release Overview – MCNP6 version 1.0”, LA-UR-13-22934, (2013) 6. A. Dubi et al., “General Statistical Model for
Geometrical Splitting in Monte Carlo – parts I and II”, Transp. Theory Stat. Phys. 14(2), 167-193 and 195-221 (1985)