Clinical Ophthalmology
Dove
press
O r i g i n a l r e s e a r C h open access to scientific and medical research
Open access Full Text article
The correlation between visual acuity outcomes
and optical coherence tomography parameters
following surgery for diabetic epiretinal
membrane and taut posterior hyaloid
hülya güngel
Zeynep Kayaarası Öztürker
Sibel Zırtıloğlu
Kadir eltutar
Ophthalmology Department, istanbul research and Training hospital, Istanbul, Turkey
Purpose: To evaluate the relationship between visual outcomes and the determinants detected by spectral domain optical coherence tomography (OCT) in eyes with epiretinal membrane (ERM) and/or taut posterior hyaloid (TPH) that underwent pars plana vitrectomy (PPV).
Materials and methods: A total of 30 participants with diabetic ERM and TPH were included in the study. All study participants underwent PPV. Preoperative and postoperative best corrected visual acuity (BCVA), peripapillary retinal nerve fiber layer (RNFL), macular RNFL, ganglion cell layer, inner plexiform layer, and ganglion cell complex thicknesses were measured in each participant. Linear regression analyses were performed to determine the association between the OCT parameters and the visual acuity measured at the time of the OCT measurement.
Results: The postoperative BCVA logarithm of the minimum angle of resolution (logMAR) values were statistically higher than the preoperative values in the ERM group and TPH group
(P=0.001 and P,0.001, respectively). The postoperative BCVA logMAR value was negatively
correlated with average RNFL, inferior RNFL thicknesses, and image quality (P=0.002, P=0.004,
and P=0.006, respectively). The preoperative and postoperative BCVA logMAR value difference
was not correlated with age and all of the OCT parameters measured (P.0.05).
Conclusion: This study shows that achievement of better peripapillary RNFL thickness results in better visual outcome after PPV and ERM/TPH removal.
Keywords: diabetic epiretinal membrane, taut posterior hyaloid, retinal nerve fiber layer, ganglion cell complex, optical coherence tomography
Introduction
Epiretinal membrane (ERM) and taut posterior hyaloid (TPH) are vitreoretinal interface diseases that may develop as complications of diabetic maculopathy and/or retinopathy. Pars plana vitrectomy (PPV) is generally accepted as the treatment modality.1
Accompa-nying internal limiting membrane (ILM) peeling would also allow for the removal of the contractile membranes with consequent elimination of any tangential tractional forces, thus leading to resolution of the macular edema. In addition to the visual improvement following surgery, recurrences are prevented by inhibiting astrocyte proliferation.2
It is also reported that ILM peeling contributes to the resolution of the macular edema by facilitating the fluid passage from the retina through the vitreous.3
The functional and anatomical outcomes of PPV for ERM and TPH differ in various studies.4–9 Despite the improved visual prognosis and the resolution of macular edema
following ERM removal, the morphology is rarely conserved.10 Correspondence: Zeynep Kayaarası
Öztürker
Ophthalmology Department, istanbul research and Training hospital, selale Cad spradon evleri 554 ada D01-01, Bahcesehir, Basaksehir, PO Box 34488, Istanbul, Turkey
Tel +90 212 669 4389
email zeynepkayaa@yahoo.com
Journal name: Clinical Ophthalmology Article Designation: Original Research Year: 2015
Volume: 9
Running head verso: Güngel et al
Running head recto: Visual acuity outcomes and OCT parameters DOI: http://dx.doi.org/10.2147/OPTH.S86069
Clinical Ophthalmology downloaded from https://www.dovepress.com/ by 118.70.13.36 on 21-Aug-2020
For personal use only.
Number of times this article has been viewed
This article was published in the following Dove Press journal: Clinical Ophthalmology
Dovepress
güngel et al
Optical coherence tomography (OCT) imaging plays an essential role in the diagnosis and treatment of macular diseases, including those of the vitreomacular interface. The influence of the integrity of the photoreceptor inner/outer segment (IS/OS) junction line and ILM on postoperative visual acuity (VA) and the change in choroidal thickness during the course of the retinopathy can be evaluated more precisely by
OCT.11,12 Pelosini et al13 reported an interesting correlation
between the VA at the time of the edema and the amount of tissue located between the two plexiform layers on en face OCT scans, and they have shown that retinal tissue integrity could be an indicator of visual function before treatment.
In this study, the relationship between visual outcomes and determinants detected by spectral domain (SD)-OCT in eyes with ERM and/or TPH that underwent PPV was investigated.
Methods
This was a prospective cohort study. The protocol was approved by the ethical committee of the Istanbul Research and Training Hospital (Istanbul, Turkey). All participants signed informed consent forms, and the study adhered to the tenets of the Declaration of Helsinki. The subjects were 30 patients (30 eyes) who underwent surgery after the diag-nosis of ERM (ERM group; n=17) and/or TPH (TPH group; n=13) between April 2013 and March 2014.
All participants underwent ophthalmological examina-tions, including VA and refraction, slit lamp biomicroscopy, applanation tonometry, axial length, and dilated fundoscopy. VA data (Snellen chart) were converted to logarithm of the minimum angle of resolution (logMAR) values. Preopera-tive central macular thickness (CMT), fundus fluorescein angiography (FFA) findings, laser treatments, and intravitreal injections were recorded.
Eligibility criteria were the diagnosis of diabetic macular edema with diffuse leakage in the FFA and OCT param-eters that were stable for the last 4 months after intravitreal bevacizumab or steroid injections. Panretinal scatter laser photocoagulation of all subjects was completed at least 6 months prior to surgery. All eligible patients had panretinal laser photocoagulation treatment and OCT findings were consistent with ERM formation.
The exclusion criteria included any history of uveitis, neurological diseases, retinal vascular occlusion, glaucoma, ocular hypertension, retinal detachment, and vitrectomy. Patients with cataracts, optic atrophy, and laser scars in the macula that would affect the functional results were excluded. Subjects with vitreous hemorrhage, fibrovascular traction
2YHUOD\
,/0 ,626
$YHUDJLQJVXFFHVVUDWH
53(
*ULG &LUFOH %0 &DOLSHU
$%
Clinical Ophthalmology downloaded from https://www.dovepress.com/ by 118.70.13.36 on 21-Aug-2020
Dovepress Visual acuity outcomes and OCT parameters 'GLVFUHSRUWZLWKWRSRJUDSK\ '2&7 )$ SOXV9 HU 3ULQWGDWH (WKQLFLW\
7HFKQLFLDQ )L[DWLRQ2'5'LVF 6FDQ'îPP±îPP
6H[0DOH '2% $JH ,'SRVWRSYLWKJJ
&
1DPH 2'5 ,PDJHTXDOLW\ 0RGH)LQH &DSWXUHGDWH &RORUSKRWR 71 7KLFNQHVVPDS51)/ 5HGIUHH 51)/ FLUFXODUWRPRJUDPWKLFNQHVV $YHUDJHWKLFNQHVV51)/ P 7RWDOWKLFNQHVV 7 6 1 ,6XSHULRU ,QIHULRU &RPPHQWV
6LJQDWXUH 'DWH ,VWDQEXO($+ 6$0$ 7< $ +RUL]RQWDOWRPRJUDP 'LVFDUHDPP 'LVFWRSRJUDSK\ &XSDUHDPP 5LPDUHDPP
&'DUHDUDWLR /LQHDU&'5 9HUWLFDO&'5 &XSYROXPHPP
5LPYROXPHPP +RUL]RQWDO''PP 9HUWLFDO''PP P 76 1, 7 'LVFPDUJLQ 7 61 5'UDWLR 'LVFSDUDPHWHUVDUHGHWHUPLQHG DWWKHUHIHUHQFHSODQHKHLJKW RIPLFURQVIURPWKH53(SODQ HLQWKLVYHUVLRQ ,7 &XSPDUJLQ P 6LJQLILFDQFHPDS Figure 1 (A ) The image of a g CC scan which is centered 1 mm temporal to the fovea and covered a square grid on the central macula. (B ) The OCT image showing ILM, IS/OS, RPE, and BM. ( C ) The postoperative OCT image of a
patient showing retinal nerve fiber layer, ILM and IS/OS, and optic nerve head parameters. Abbreviations:
BM, basement membrane; GCC, ganglion cell complex; ILM, internal limiting membrane; IS, inner segment; OCT, optical coherence tomography; OS, outer segment; RPE, retinal pigment epithelium.
Clinical Ophthalmology downloaded from https://www.dovepress.com/ by 118.70.13.36 on 21-Aug-2020
Dovepress
güngel et al
affecting the macula, tractional detachment, damaged IS/ OS layer integrity, residual ILM, or iatrogenic retinal breaks were also excluded. All eyes were dilated with tropicamide 0.5%, and OCT images were obtained by the same experi-enced technician. The surgeon was the same (HG) for the 30 patients.
Postoperative CMT, central choroidal thickness (CCT), peripapillary retinal nerve fiber layer (pRNFL) thickness, ganglion cell layer with inner plexiform layer (GCIPL), and ganglion cell complex (GCC) thickness were measured by Topcon 3D OCT-2000 (Topcon Corporation, Tokyo, Japan) (Figure 1).
The enhanced depth imaging mode of the OCT was used in the choroidal thickness evaluations. The protocol of the enhanced choroidal mode cross scan was performed, center-ing on the fovea. This protocol consisted of 6 mm cross lines with 1,024 A-scans/B-scans and overlapping four B-scans per image; direct B-scan observation was available. Choroi-dal thickness was measured perpendicularly from the outer edge of the retinal pigment epithelium to the choroid–sclera boundary at the fovea, and at five more points, which are sequentially located.
Mean RNFL and GCC thicknesses were measured by SD-OCT, which acquires 26,000 A-scans per second and provides a 5 μm depth resolution in tissue. RNFL thickness was determined by the optic nerve head mode, in which data along a 3.45 mm diameter circle around the optic disc were recalculated with a map created from six circular and 12 linear data inputs. Mean, superior, and inferior thicknesses were calculated. The GCC scan was centered 1 mm tempo-ral to the fovea and covered a square grid (7×7 mm) on the central macula. GCC thickness was measured from the ILM to the outer boundary of the GCIPL, and mean, superior, and inferior GCC thicknesses were calculated.
Images were excluded when the signal strength index was less than 60, when overt misalignment of the surface detec-tion algorithm occurred, or when there was overt decentradetec-tion of the measurement circle location.
surgical technique
After informed consent was obtained, the patient received either general or local anesthesia (posterior subtenon block, using 3 mL of 0.5% bupivacaine and 2% prilocaine). Pupillary dilation was obtained with tropicamide 1% and phenylephrine 2.5% drops prior to surgery. Standard 23 gauge, three-port PPV was then performed using the Alcon Constellation vitrectomy unit (Alcon Laboratories, Inc., Fort Worth, TX, USA). The ERM was identified with intravitreal
triamcinolone and peeled using ILM forceps. In all cases with residual traction after ERM peeling, Brilliant Blue dye was injected and the ILM was peeled as well. The vitreous cavity was filled with 10% SF6. All eyes underwent Brilliant Blue dye-assisted ILM peeling with fluid–SF6 exchange, and endolaser photocoagulation was performed anterior to the equator of each eye (if necessary). At the end of the PPV, the patient received a subconjunctival injection of gentamicin and dexamethasone. Postoperatively, all patients received topical prednisolone acetate 1%, lomefloxacin 3 mg/mL, and oral moxifloxacin 400 mg, unless a contraindication was present.
Patients were examined postoperatively at the 1st day, 1st week, 1st month, 3rd month, and 6th month after the sur-gery. The best corrected VA (BCVA) and OCT parameters were measured at each visit. For data analyses, the BCVA at 6 months after surgery was recorded and converted to logMAR format. (Visual acuities that could not be measured using a Snellen chart were converted using the following algorithm: count fingers =1.6; hand motion =2; light percep-tion =2.5; and no light perception =3). The preoperative and postoperative 6-month data of the BCVA logMAR value difference was calculated and compared in each group and between both groups. The postoperative BCVA logMar value was correlated with preoperative BCVA, age, postoperative CMT, postoperative CCT, postoperative RNFL, postopera-tive GCC, and image quality.
Statistical analyses were performed using SPSS 20.0 software. The distribution of variables was evaluated using the Kolmogorov–Smirnov test. A comparison of mean BCVA before and after surgery was evaluated using the Wilcoxon test. A comparison of the BCVA between the ERM group and TPH group was analyzed using the Mann–Whitney U-test. The correlations between BCVA and OCT parameters were evaluated with Pearson’s cor-relation analysis.
Results
A total of 30 patients (15 men, 15 women) with unilat-eral ERM or TPH were included. Their mean age was 67.8±8.3 years (range: 49–82 years). Patient demographics and the postoperative OCT parameters of the study popula-tion are summarized in Table 1. The mean postoperative CMT and CCT were 284.8±102.7 μm and 230.8±59.6 μm, respectively. All eyes were pseudophakic before the sur-gery. All eyes underwent Brilliant Blue dye-assisted ILM peeling with fluid–SF6 exchange, and endolaser photoco-agulation was performed anterior to the equator of each eye
Clinical Ophthalmology downloaded from https://www.dovepress.com/ by 118.70.13.36 on 21-Aug-2020
Dovepress Visual acuity outcomes and OCT parameters
Table 1 Demographics and postoperative OCT parameters of
the study population
Mean ± SD Median Minimum–maximum
age 67.8±8.3 65.5 49.0–82.0
Preoperative BCVa logMar
0.80±0.28 0.75 0.32–1.80
Postoperative BCVa logMar
0.42±0.28 0.32 0.10–1.51
CMT 284.8±102.7 248.5 91.0–593.0
CCT 230.8±59.6 243.5 130.0–372.0
prnFl average 93.8±17.4 95.5 51.0–126.0 prnFl superior 103.3±23.1 106.5 46.0–142.0 prnFl inferior 109.6±24.0 109.0 53.0–148.0 prnFl temporal 81.3±17.5 82.0 40.0–112.0 prnFl nasal 75.0±25.4 79.0 40.0–164.0
mrnFl 59.0±28.4 49.5 28.0–134.0
GCIPL 75.3±20.7 71.5 49.0–132.0
gCC 106.0±27.9 105.0 66.0–178.0
Abbreviations: OCT, optical coherence tomography; sD, standard deviation; BCVa, best corrected visual acuity; logMar, logarithm of the minimum angle of
resolution; CMT, central macular thickness; CCT, central choroidal thickness; pRNFL, peripapillary retinal nerve fiber layer; mRNFL, macular retinal nerve fiber layer; GCIPL, ganglion cell layer + inner plexiform layer; gCC, ganglion cell complex.
Table 2 The comparison between preoperative and postoperative
BCVa
Mean ± SD Median
(minimum–maximum) P
Preoperative
BCVa (logMar) 0.80±0.28 0.8 (0.3–1.8) ,0.001 Postoperative
BCVa (logMar) 0.42±0.28 0.3 (0.1–1.5) ,0.001
Abbreviations: BCVa, best corrected visual acuity; sD, standard deviation; logMar, logarithm of the minimum angle of resolution.
(if necessary). No intraoperative or postoperative complica-tions occurred in any of the patients.
The mean preoperative BCVA was 0.80±0.28 logMAR,
whereas the mean final postoperative BCVA was 0.42±0.28 logMAR (P,0.001) (Table 2). The postoperative BCVA logMar values were statistically higher than the preoperative values in both groups (P=0.001 and P,0.001, respectively). There was a statistically significant correlation between the preoperative and postoperative BCVA (r=0.686; P,0.001). There was no significant difference between the ERM group and the TPH group with respect to preoperative and postoperative BCVA logMar value differences (P=0.712) (Table 3).
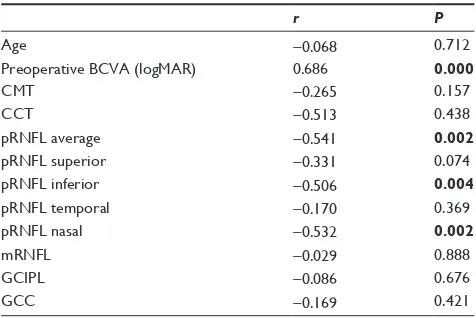
The postoperative BCVA logMar value was not correlated with age, postoperative CMT, CCT, superior RNFL, temporal RNFL, nasal RNFL, and mean GCC thicknesses (P.0.05), whereas it was negatively correlated with average RNFL,
inferior RNFL thicknesses, and image quality (P=0.002,
P=0.004, and P=0.006, respectively). The preoperative and postoperative BCVA logMar value difference was not cor-related with age or any of the OCT parameters measured (P.0.05) (Table 4).
Discussion
This study demonstrated that VA (BCVA) after PPV is strongly correlated with preoperative BCVA, as well as postoperative average and inferior pRNFL thicknesses.
ERM is a macular disease that causes decreased vision and metamorphopsia. Vitrectomy and removal of the membrane are the standard treatment for ERM. Recently, this surgical approach has been combined with ILM peeling to reduce
Table 3 The comparison between the preoperative and post-
operative logMar value difference in the study population
Mean ± SD Median
(minimum–maximum) P
ERM (n=17) BCVa logMar
Preoperative 0.84±0.35 0.7 (0.4–1.8) 0.712
Postoperative 0.39±0.35 0.3 (0.1–1.5) 0.158
Difference 0.45±0.22 0.4 (0.2–0.9) 0.191
TPH (n=13) BCVa logMar
Preoperative 0.77±0.22 0.8 (0.3–1.0) 0.712
Postoperative 0.45±0.22 0.4 (0.2–0.8) 0.158
Difference 0.34±0.25 0.3 (0.1–0.8) 0.191
Abbreviations: logMar, logarithm of the minimum angle of resolution; erM, epiretinal membrane; BCVA, best corrected visual acuity; TPH, taut posterior
hyaloid; sD, standard deviation.
Table 4 The correlation between postoperative BCVa logMar
value, age, and OCT parameters
r P
age -0.068 0.712
Preoperative BCVA (logMAR) 0.686 0.000
CMT -0.265 0.157
CCT -0.513 0.438
prnFl average -0.541 0.002
prnFl superior -0.331 0.074
prnFl inferior -0.506 0.004
prnFl temporal -0.170 0.369
prnFl nasal -0.532 0.002
mrnFl -0.029 0.888
GCIPL -0.086 0.676
gCC -0.169 0.421
Note: Bold font indicates that the correlations are statistically significant. Abbreviations: BCVa, best corrected visual acuity; logMar, logarithm of the minimum angle of resolution; OCT, optical coherence tomography; CMT, central
macular thickness; CCT, central choroidal thickness; pRNFL, peripapillary retinal nerve fiber layer; mRNFL, macular nerve fiber layer; GCIPL, ganglion cell layer +
inner plexiform layer; gCC, ganglion cell complex.
Clinical Ophthalmology downloaded from https://www.dovepress.com/ by 118.70.13.36 on 21-Aug-2020
Dovepress
güngel et al
ERM recurrence by eliminating the area where myofibroblasts can proliferate.14 TPH is also a cause of tangential traction on
the retinal surface, thereby inducing or exacerbating edema and producing a tractional retinal detachment as part of the clinical syndrome. The importance of OCT is recognized, and the vitreomacular interface and changes in retinal thickness before and after surgery can be measured.15–17
Previous studies have reported favorable functional and anatomical results after vitrectomy.18–20 Their surgical
approach was the removal of the posterior hyaloid and trac-tional forces associated with a thickened and taut premacular hyaloid in patients with diabetic macular edema. The size of the macular capillary dropout area and the IS/OS regen-eration in the parafoveal quadrants contribute significantly to the recovery of BCVA following ERM surgery.21,22 ILM
peeling appears to have a significant effect on functional success, whereas only a few studies have reported the effect of ILM peeling on retinal thickness.23–25 In this study, it was
not possible to evaluate the difference resulting from ILM peeling, as ILM peeling was done and there was IS/OS integrity obtained by OCT in all cases.
Significant changes in VA were obtained in all subjects. After PPV with ILM peeling in both the ERM group and the TPH group, the postoperative BCVA was statistically higher than the preoperative values. There was no significant difference between the ERM group and the TPH group with respect to preoperative and postoperative BCVA logMar value differences. The postoperative BCVA logMar value was negatively correlated with the average RNFL, inferior RNFL thicknesses, and image quality.
CMT values may reflect traction on the retinal ganglion cells, and greater CMT values may be associated with greater traction and, in turn, more severe ganglion cell damage in idiopathic ERM.10 In this study, the preexisting metabolic,
inflammatory, and vascular factors due to diabetes increased RNFL thickness; and degenerative changes were the additional factors affecting CMT. Since CMT value is considered to decrease in ERM cases postoperatively up to 12 months, the duration of the study is short.10 We think that the partial or
com-plete elimination of these factors, as well as microcirculatory changes, specific responses to the surgery, and the long-lasting changes to the macula, might have prevented establishing a relationship between postoperative VA and CMT.
Surgical and laser procedures have variable effects on RNFL thickness in the follow-up period.10,26 Müller cells
produce metabolic and morphological interactions between the retinal vessels and neurons. Hyperglycemia causes Müller
cell dysfunction in diabetic patients, and progressive axonal degeneration occurs due to an imbalance between the intra- and extracellular matrix. Changes in the Müller cells give rise to an apoptotic response in these eyes. In several studies, it has been demonstrated by OCT that the inferior GCIPL and RNFL thicknesses are thinner in diabetic patients.26 In our study,
we evaluated the relationship of RNFL thickness to VA after PPV. The postoperative BCVA logMar value was negatively correlated with the average and inferior RNFL thickness.
VA improvement in patients with idiopathic ERM is closely related to the thickness of the inner retinal layers.10,26,27
As a result of a traction, GCC damage occurs in idiopathic ERM.10 Pierro et al28 showed that GCC thickness is higher in
eyes with idiopathic ERM, and postoperative GCC reduction is proportionally higher than thinning of the whole retina; this reduction is correlated with visual restoration. Bonnin et al29 demonstrated that the average and minimum GCIPL
thicknesses evaluated by Cirrus high definition-OCT were strongly correlated with VA. However, this work relied on the analysis of inner retinal changes on a dried retina, so this method avoids segmentation errors made by the ganglion cell analyzer and allows for an objective assessment of GCIPL changes in the macula.29 Since the early stages of diabetes
mellitus affect the inner and outer retinal layers in differ-ent ways, they cause progressive neurodegenerative retinal diseases.30–32 GCIPL begins to thin in the early stages of
diabetic retinopathy among patients with retinopathy.31 The
progressive loss of ganglion cells and astrocytes leads to a loss of RNFL.31,33–36 In our study, there was no relationship
between the average GCC thickness and postoperative VA. The reason for the preoperative and postoperative BCVA value difference is dependent on metabolic, inflammatory, and vascular factors, as well as on degenerative changes in the retina. The advanced stage of retinopathy suggests a severe neurodegeneration in these cases. The resultant visual func-tion is mainly dependent on the neuronal activity of the retina. The reason for this can include the advanced stage of the cases and not having significant differences between GCIPL values among the cases. The neurodegeneration is expected to cause thinning and atrophy of the RNFL. The correlation between VA and RNFL thickness is compatible with the nature of the disease in cases with advanced diabetic retinopathy.
The number of patients who completed the follow-up examinations for 6 months was small, and it was not pos-sible to conduct any long-term follow-up over 6 months in this study. Furthermore, the software for measuring RNFL was developed for normal eyes, and the ERM may affect
Clinical Ophthalmology downloaded from https://www.dovepress.com/ by 118.70.13.36 on 21-Aug-2020
Dovepress Visual acuity outcomes and OCT parameters
the RNFL thickness measurement.37 The ability of the
soft-ware to accurately measure RNFL thickness in these eyes is uncertain because it was not possible to segment the original signals to determine the accuracy of RNFL measurements. For this reason, preoperative OCT measurements were not evaluated.
Conclusion
In conclusion, this study shows that better RNFL thickness achievement results in higher levels of visual outcomes after PPV and ERM/TPH removal. The first studies using SD-OCT showed the importance of IS/OS layer integrity in diabetic eyes. RNFL and GCC thickness were also shown to be very important in eyes with IS/OS layer integrity, and this factor has been reviewed in a recent study.38
Disclosure
The authors report no conflicts of interest in this work.
References
1. Bovey EH, Uffer S, Achache F. Surgery for epimacular membrane: impact of retinal internal limiting membrane removal on functional outcome. Retina. 2004;24(5):728–735.
2. Kumar A, Wagh VB, Prakash G, Nag TC, Prakash S. Visual outcome and electron microscopic features of indocyanine green-assisted internal limiting membrane peeling from macular hole of various aetiologies.
Indian J Ophthalmol. 2005;53(3):159–165.
3. Radetzky S, Walter P, Fauser S, Koizumi K, Kirchhof B, Joussen AM. Visual outcome of patients with macular edema after pars plana vitrectomy and indocyanine green-assisted peeling of the internal limiting membrane. Graefes Arch Clin Exp Ophthalmol. 2004;242(4): 273–278.
4. Yamamoto T, Akabane N, Takeuchi S. Vitrectomy for diabetic macu-lar edema: the role of posterior vitreous detachment and epimacumacu-lar membrane. Am J Ophthalmol. 2001;132(3):369–377.
5. Kimura T, Kiryu J, Nishiwaki H, et al. Efficacy of surgical removal of the internal limiting membrane in diabetic cystoid macular edema.
Retina. 2005;25(4):454–461.
6. Yanyali A, Horozoglu F, Celik E, Ercalik Y, Nohutcu AF. Pars plana vitrectomy and removal of the internal limiting membrane in diabetic macular edema unresponsive to grid laser photocoagulation.
Eur J Ophthalmol. 2006;16(4):573–581.
7. Dillinger P, Mester U. Vitrectomy with removal of the internal limiting membrane in chronic diabetic macular oedema. Graefes Arch Clin Exp Ophthalmol. 2004;242(8):630–637.
8. Kamura Y, Sato Y, Isomae T, Shimada H. Effects of internal limiting membrane peeling in vitrectomy on diabetic cystoid macular edema patients. Jpn J Ophthalmol. 2005;49(4):297–300.
9. Hartley KL, Smiddy WE, Flynn HW, Murray TG. Pars plana vitrectomy with internal limiting membrane peeling for diabetic macular edema.
Retina. 2008;28(3):410–419.
10. Massin P, Allouch C, Haouchine B, et al. Optical coherence tomography of idiopathic macular epiretinal membranes before and after surgery.
Am J Ophthalmol. 2000;130(6):732–739.
11. Oster SF, Mojana F, Brar M, Yuson RM, Cheng L, Freeman WR. Disrup-tion of the photoreceptor inner segment/outer segment layer on spectral domain-optical coherence tomography is a predictor of poor visual acuity in patients with epiretinal membranes. Retina. 2010;30(5):713–718.
12. Hee MR, Puliafito CA, Duker JS, et al. Topography of diabetic macular edema with optical coherence tomography. Ophthalmology. 1998;105(2): 360–370.
13. Pelosini L, Hull CC, Boyce JF, McHugh D, Stanford MR, Marshall J. Optical coherence tomography may be used to predict visual acuity in patients with macular edema. Invest Ophthalmol Vis Sci. 2011;52(5): 2741–2748.
14. Kwok AKh, Lai TY, Yuen KS. Epiretinal membrane surgery with or without internal limiting membrane peeling. Clin Experiment Ophthalmol. 2005;33(4):379–385.
15. Massin P, Duguid G, Erginay A, Haouchine B, Gaudric A. Optical coherence tomography for evaluating diabetic macular edema before and after vitrectomy. Am J Ophthalmol. 2003;135(2):169–177. 16. Shah SP, Patel M, Thomas D, Aldington S, Laidlaw DA. Factors
pre-dicting outcome of vitrectomy for diabetic macular oedema: results of a prospective study. Br J Ophthalmol. 2006;90(1):33–36.
17. Gallemore RP, Jumper JM, McCuen BW 2nd, Jaffe GJ, Postel EA, Toth CA. Diagnosis of vitreoretinal adhesions in macular disease with optical coherence tomography. Retina. 2000;20(2):115–120. 18. Harbour JW, Smiddy WE, Flynn HW, Rubsamen PE. Vitrectomy for
diabetic macular edema associated with a thickened and taut posterior hyaloid membrane. Am J Ophthalmol. 1996;121(4):405–413. 19. van Effenterre G, Guyot-Argenton C, Guiberteau B, Hany I, Lacotte JL.
[Macular edema caused by contraction of the posterior hyaloid in diabetic retinopathy. Surgical treatment of a series of 22 cases].
J Fr Ophtalmol. 1993;16(11):602–610. French.
20. Lewis H, Abrams GW, Blumenkranz MS, Campo RV. Vitrectomy for diabetic macular traction and edema associated with posterior hyaloidal traction. Ophthalmology. 1992;99(5):753–759.
21. Pendergast SD, Hassan TS, Williams GA, et al. Vitrectomy for diffuse diabetic macular edema associated with a taut premacular posterior hyaloid. Am J Ophthalmol. 2000;130(2):178–186.
22. Mayer WJ, Vogel M, Neubauer A, et al. Pars plana vitrectomy and internal limiting membrane peeling in epimacular membranes: correla-tion of funccorrela-tion and morphology across the macula. Ophthalmologica. 2013;230(1):9–17.
23. Haritoglou C, Gandorfer A, Gass CA, Schaumberger M, Ulbig MW, Kampik A. Indocyanine green-assisted peeling of the internal limiting membrane in macular hole surgery affects visual outcome: a clinico-pathologic correlation. Am J Ophthalmol. 2002;134(6):836–841. 24. Christensen UC. Value of internal limiting membrane peeling in surgery
for idiopathic macular hole and the correlation between function and retinal morphology. Acta Ophthalmol. 2009;87 Thesis 2:1–23. 25. Christensen UC, Krøyer K, Sander B, Jorgensen TM, Larsen M, la Cour M.
Macular morphology and visual acuity after macular hole surgery with or without internal limiting membrane peeling. Br J Ophthalmol. 2010;94(1):41–47.
26. Lee EK, Yu HG. Ganglion cell-inner plexiform layer thickness after epiretinal membrane surgery: a spectral-domain optical coherence tomography study. Ophthalmology. 2014;121(8):1579–1587. 27. Kim J, Rhee KM, Woo SJ, Yu YS, Chung H, Park KH. Long-term
temporal changes of macular thickness and visual outcome after vit-rectomy for idiopathic epiretinal membrane. Am J Ophthalmol. 2010; 150(5):701–709.e1.
28. Pierro L, Iuliano L, Gagliardi M, Codenotti M, Ambrosi A, Bandello F. Role of ganglion cell complex in visual recovery following surgical internal limiting membrane peeling. Graefes Arch Clin Exp Ophthalmol. 2015;253(1):37–45.
29. Bonnin S, Tadayoni R, Erginay A, Massin P, Dupas B. Correlation between ganglion cell layer thinning and poor visual function after resolution of diabetic macular edema. Invest Ophthalmol Vis Sci. 2015;56(2):978–982.
30. Bikbova G, Oshitari T, Baba T, Yamamoto S. Neurotrophic factors for retinal ganglion cell neuropathy – with a special reference to diabetic neuropathy in the retina. Curr Diabetes Rev. 2014;10(3):166–176.
Clinical Ophthalmology downloaded from https://www.dovepress.com/ by 118.70.13.36 on 21-Aug-2020
Clinical Ophthalmology
Publish your work in this journal
Submit your manuscript here: http://www.dovepress.com/clinical-ophthalmology-journal Clinical Ophthalmology is an international, peer-reviewed journal covering all subspecialties within ophthalmology. Key topics include: Optometry; Visual science; Pharmacology and drug therapy in eye diseases; Basic Sciences; Primary and Secondary eye care; Patient Safety and Quality of Care Improvements. This journal is indexed on
PubMed Central and CAS, and is the official journal of The Society of Clinical Ophthalmology (SCO). The manuscript management system is completely online and includes a very quick and fair peer-review system, which is all easy to use. Visit http://www.dovepress.com/ testimonials.php to read real quotes from published authors.
Dovepress
Dove
press
güngel et al
31. Vujosevic S, Midena E. Retinal layers changes in human preclinical and early clinical diabetic retinopathy support early retinal neuronal and Müller cells alterations. J Diabetes Res. 2013;2013:905058. 32. Ly A, Yee P, Vessey KA, Phipps JA, Jobling AI, Fletcher EL. Early
inner retinal astrocyte dysfunction during diabetes and development of hypoxia, retinal stress, and neuronal functional loss. Invest Ophthalmol Vis Sci. 2011;52(13):9316–9326.
33. van Dijk HW, Verbraak FD, Kok PH, et al. Decreased retinal ganglion cell layer thickness in patients with type 1 diabetes. Invest Ophthalmol Vis Sci. 2010;51(7):3660–3665.
34. van Dijk HW, Kok PH, Garvin M, et al. Selective loss of inner retinal layer thickness in type 1 diabetic patients with minimal diabetic retin-opathy. Invest Ophthalmol Vis Sci. 2009;50(7):3404–3409.
35. Reichenbach A, Wurm A, Pannicke T, Iandiev I, Wiedemann P, Bringmann A. Müller cells as players in retinal degeneration and edema.
Graefes Arch Clin Exp Ophthalmol. 2007;245(5):627–636.
36. Gardner TW, Antonetti DA, Barber AJ, LaNoue KF, Levison SW. Diabetic retinopathy: more than meets the eye. Surv Ophthalmol. 2002;47 Suppl 2:S253–S262.
37. Lee SB, Shin YI, Jo YJ, Kim JY. Longitudinal changes in retinal nerve fiber layer thickness after vitrectomy for epiretinal membrane. Invest Ophthalmol Vis Sci. 2014;55(10):6607–6611.
38. Demir M, Oba E, Sensoz H, Ozdal E. Retinal nerve fiber layer and ganglion cell complex thickness in patients with type 2 diabetes mel-litus. Indian J Ophthalmol. 2014;62(6):719–720.
Clinical Ophthalmology downloaded from https://www.dovepress.com/ by 118.70.13.36 on 21-Aug-2020