Very high energy emission sources beyond the Galaxy
V.G. Sinitsynaa, M.S. Andreeva, K.A. Balygin, S.S. Borisov, I.A. Ivanov, A.M. Kirichenko, A.I. Klimov, I.P. Kozhukhova, R.M. Mirzafatikho, N.I. Moseiko, I.E. Ostashev, A.I. Palamarchuk, V.Y. Sinitsyna, and I.G. Volokh
P. N. Lebedev Physical Institute, Russian Academy of Science, Russia
Abstract. Active Galactic Nuclei (AGN) are considered as potential extragalactic sources of very and ultra high energy cosmic rays. According to theoretical predictions cosmic ray acceleration can take place at the shock created by the expanding cocoons around active galactic nuclei as well as at AGN jets. The measurements of AGN TeV spectra, the variability time scale of TeV emission can provide essential information on the dynamics of AGN jets, the localization of acceleration region and an estimation of its size. SHALON observations yielded data on extragalactic sources of different AGN types in the energy range of 800 GeV–100 TeV. The data from SHALON observations are compared with those from other experiments at high and very high energies.
1. Introduction
High and very high energy γ-rays have come to play an important role in the study of Active Galactic Nuclei (AGN). Many AGNs have been detected from MeV to TeV energies. The detection of any flares from AGNs in VHE gamma-rays and the determination of the time-scales of the flux variability in different wavelengths, including TeV energies, helps to clarify the location of the emission and limits the size of the emitting region.
The long term SHALON observations yielded data on AGNs of different types in the energy range of 800 GeV - 100 TeV (Table 1). Some of these AGNs were discovered at TeV energies by SHALON. The results on fluxes, spectral energy distributions and images are shown here and in [1–7]. All SHALON results are compared with data from experiments at high and very high energies (see Figs.1,2,3,4).
2. Mkn 421 (
z
=
0
.
031
), Mkn 501
(
z
=
0
.
034
) and Mkn 180 (
z
=
0
.
046
)
The observation results of known BL Lacs Mkn 421, Mkn 501 and Mkn 180 are presented (see Fig. 2, [7]). The images and spectral energy distributions at energies above 800 GeV are obtained for each of the sources.
A number of flare periods in different wavelengths including VHEγ-rays were found. For example, the last flaring state of Mkn 501 at TeV energies was detected by SHALON between March and June 2009. A flux increase was detected on 23–24 April and 23–25 May with an average flux of (3.41±0.70)×10−12cm−2s−1. The increase of the Mkn 501 flux in the 2009 SHALON data correlates with one at a lower energy range of > 2 GeV by Fermi LAT and has a time lag with the flare at 0.2–2.0 GeV [8]. Also, this flare was detected at TeV energies by VERITAS, MAGIC and Whipple [8].
ae-mail:sinits@sci.lebedev.ru
Mkn 180 was observed by SHALON in 2007, 2009– 2014, for a total of 71 hours. After the standard analysis, a clear excess corresponding to an 18.5σ effect [9] was detected. The Mkn 180 spectrum fitting parameters are shown in Table1.
Extreme variability in different wavelengths, including VHE γ-rays, on time-scales from minutes to years is the most distinctive feature of BL Lac objects, but the variations in total optical brightness are small. Also, no evidence for any significant flux variability was found during the full observation period of Mkn180 by SHALON.
3. 3C 382 (
z
=
0
.
0578)
3C 382 is a typical Broad Line Radio Galaxy (BLRG), essentially identical to a quasar except for the optical luminosity. 3C382 is a well-known X-ray source. Its radio structure shows several quasar-like features. The core is very bright and there is a narrow jet with a compact hotspot and with a lobe opposite the jet. In contrast to blazars, the jets in BLRGs do not point directly toward the observer, and the relativistic beaming effects and the related jet dominance are only moderate, so it becames possible to investigate both the accretion disk and the jet. Our observations are mainly aimed at searches for TeVγ -ray emission from 3C 382.
3C 382 was detected by SHALON at TeV energies [4] (in observations during the years 2009–2016, 46.3 hours in total) with a significance [9] of 9.5σ. The integral γ-ray flux above 0.8 TeV was estimated to be (0.91± 0.14)×10−12cm−2s−1. The energy spectrum of γ-rays at energies above 800 GeV is described by a power law with index −1.08±0.11. Correlations of the TeV flux with MeV-GeV energy fluxes were not found as the observations of 3C 382 at high energies with Fermi LAT [10] only gave an upper limit in the range 0.1–100 GeV (Fig.2).
EPJ Web of Conferences 145, 19004 (2017) DOI: 10.1051/epjconf/201714519004 ISVHECRI 2016
Table 1. The catalogue of extragalacticγ-ray sources observed by SHALON with parameters for spectrum fitting in the form of a power low with exponential cutoff F(> E)∝Ekγ×ex p(−E/E
cut o f f).
Sources Observable fluxa k
γ Ecut o f f, TeV Distance, z Type
NGC 1275 (0.78±0.05) −2.18±0.12 32±7 0.018 Seyfert SN2006 gy (3.71±0.65) −3.10±0.30 4.4±1.9 0.019 SN
IC 310 (0.89±0.09) −0.84±0.10 13±3.9 0.019 RG Mkn 421 (0.63±0.05) −1.51±0.18 10±3 0.031 BL Lac Mkn 501 (0.86±0.06) −1.48±0.15 11±3 0.034 BL Lac Mkn 180 (0.65±0.09) −1.84±0.15 7.3±2.2 0.046 BL Lac 3c382 (0.91±0.14) −1.05±0.11 21±7.0 0.0578 BLRG 4C+31.63 (0.73±0.16) −1.13±0.16 10.4±3.2 0.295 FSRQ OJ 287 (0.26±0.07) −1.14±0.11 9.5±1.2 0.306 BL Lac 3C 454.3 (0.43±0.07) −0.52±0.12 6.2±1.0 0.859 FSRQ 4C+55.17 (0.90±0.16) −1.40±0.15 5.4±2.1 0.896 FSRQ
PKS 1441+25 (0.52±0.23) − − 0.939 FSRQ
1739+522 (0.49±0.05) −0.50±0.18 6.1±1.2 1.375 FSRQ
B2 0242+43 (0.58±0.20) − − 2.243 FSRQ
B2 0743+25 (0.37±0.16) − − 2.979 FSRQ
aIntegral flux at energy>800 GeV in units of 10−12cm−2s−1.
Figure 1. Top: VLA radio image of of 3c382. Bottom: SHALON image of 3c382 at energies 800 GeV −35 TeV. The contours represent the source’s radio structure from VLA.
Figure1presents a VLA 1477 MHz image of 3C 382. It shows a core-lobe structure with hot-spots at the end of the North jet and at the South. The TeV image of 3C 382 is correlated with the structures visible in radio energies by VLA [11]. The structure viewed in TeV γ-rays by SHALON (Fig.1) can be the result of heating or blowing the interstellar medium by jets similar to one observed in
the NGC 1275 Seyfert galaxy. No significant emission was found from the position of core core, which is clearly seen in the radio-image.
4. OJ 287 (
z
=
0
.
306
)
OJ 287 is a low-frequency peaked BL Lac object. It is one of the most studied blazars whose spectrum has been well measured through radio [12,13] to X-ray bands [14,15] and for optical studies. The most outstanding characteristic of OJ 287 is its 12 year period, which has been found in the optical [14] and also confirmed in X-rays. OJ 287 is supposed to be a binary black hole system in which a secondary black hole passes the accretion disk of the primary black hole and produces two impact flashes per period. The spectral energy distributions of blazars consist of two broad peaks. The first, lower frequency peak, is due to the synchrotron emissions of relativistic electrons in the jet. It is supposed that the second, higher frequency peak, is due to Inverse Compton emission of the same electrons [16]. GeV emission from OJ 287 has been detected by EGRET [17] and Fermi LAT [18]. It has also been suggested to be a TeV source.
OJ 287 was observed by SHALON in 1999, 2000, 2008–2010, for a total of 47.3 hours, at zenith angles ranging from 22◦ to 34◦. The observations of 1999 and 2000 do not reveal a γ-ray flux from the position of OJ 287, but only an upper limit of <1.1×10⁻¹³cm−2s−1. In the observations of 2008, 2009 and 2010 (31.2 hours) a weakγ-ray flux was detected [3]. An excess corresponding to a 6.9σ effect was observed. The measured integral energy spectrum of OJ 287 can be well described by a power law with index−1.43±0.18. The observed integral flux above 800 GeV is (0.26±0.07)×10−12cm−2s−1. The image of γ-ray emission from OJ 287 by SHALON telescope is shown in Fig.2.
A flux increase over the detected average flux was found on 14, 15 November and 4, 5 December 2010. The average value of the increase is (0.63±0.15)× 10−12cm−2s−1 (statistical significance of 6.2σ [9]) with a softer energy spectrum with a power law of index
EPJ Web of Conferences 145, 19004 (2017) DOI: 10.1051/epjconf/201714519004 ISVHECRI 2016
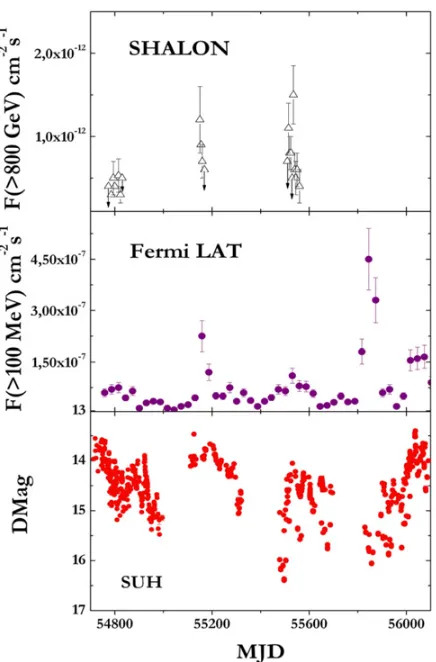
Figure 3. Comparison of the OJ 287 light curve observed by SHALON in the energy range 800 GeV−35 TeV with data in the MeV-GeV energies by Fermi LAT and in R-band.
November 2009. The duration of the flux increase in December 2010 was 2 days with a peak intensity (1.16± 0.51)×10−12cm−2s−1. No duration of intervals of flux
increase were found in 2009, because the observations were interrupted due to weather conditions.
Figure2presents the spectral energy distribution of the γ-ray emission from OJ 287 by SHALON in comparison with other experiments’ data – MAGIC [19], EGRET [17], and with theoretical predictions from [18] and [19]. The
at TeV energies in Fig. 2 are the SHALON spectrum of OJ287; an upper limit at >0.8 TeV corresponds to SHALON observations in 1999, 2000. Thepresent the γ-ray spectrum during the increased flux period of 2010. OJ 287 is the weakest extragalactic source observed by SHALON.
To reveal possible correlations of the emissions in various energy ranges, including those at high and very high energies, we compared the OJ287 γ-ray fluxes observed by SHALON in the periods when the observations were simultaneous with those by the Fermi LAT experiment (see Fig.3) and data in R-band (Suhora Astronomical Observatory) [20]. A slight local flux increase can be seen in the period of November 2010 in the Fermi LAT data [21] and at R-band, which corresponds to the above-mentioned γ-ray flux increase observed by SHALON in 2010. The increase of OJ 287 flux in the 2009 SHALON data correlates with flares at MeV-GeV energies and R-band (see Fig.3).
In [22] it is shown that the GeV flares are produced due to the interaction of moving plasma blobs with a standing shock. The flare correlations can indicate that the TeV emission observed by SHALON is a very high energy population of particles formed in the spectrum viewed by Fermi LAT, which are produced by the synchrotron self-Compton process at the jet away from the central core [22].
5. 4C+31.63 (
z
=
0
.
295
)
To collect data for FSRQ type, sources at a large distance range from z<0.3 to extremely high z sources from the first and second Fermi LAT AGN catalogue are observed by SHALON.
4C+31.63 is a FSRQ type source at redshift z= 0.295 and was observed by SHALON in the period 2012– 2015 for a total of 45.7 hours. γ-ray emission from the position of 4C+31.63 was detected above 800 GeV [1] with a 9.7σeffect. Energy spectrum parameters are shown in Table 1. 4C+31.63 was previously detected at high energies with Fermi LAT. The image of 4C+31.63 in TeV γ-rays by the SHALON telescope is shown in Fig.4. No high activity of 4C+31.63 in TeV energies was found.
6. 3C 454.3 (
z
=
0
.
859
)
3C 454.3 is a known flat-spectrum radio quasar at redshift z=0.859. It has shown very high activity over the last fifteen years and displayed variability at all wavelengths. 3C 454.3 was detected at high energies by the EGRET telescope, with an average photon index of =2.2. 3C 454.3 was detected with Fermi LAT at high energies in 2008 [23]. This object has been particularly bright in theγ-ray band covered by AGILE and Fermi LAT.
In 1998 3C 454.3 was detected by SHALON at TeV energies [5] and was observed by SHALON in the period from 1998 to 2013, for a total of 69.2 hours, at zenith angles ranging from 18◦to 35◦. After the standard analysis, a clear excess corresponding to a 14.9σ effect [9] was determined. The observed energy spectrum parameters and integral γ-ray flux are presented in Table 1. The TeV γ-ray emission map is presented in Fig. 4 right. The spectral energy distribution of 3C 454.3 and limits on the intrinsic spectrum at TeV energies de-absorbed using extragalactic background light shapes (see [6]) is presented in Fig. 4 left with lines. 3C 454.3 has been detected with Fermi LAT at energies 200 MeV–300 GeV [23]. The spectrum by Fermi LAT is fitted with a broken power-law with photon indiceslow=2.27±0.3,high =3.5± 0.05 with an average flux of ∼3×10⁻⁶cm−2s−1, for energies>100 MeV. Additional identification of detected sources with 3C 454.3 is performed because of the correlation of high level TeV fluxes with its flares at lower energies.
Figure 4. Spectral energy distributions (left) and images (right) of theγ-ray emission from AGNi observed by SHALON.
period of Nov.–Dec. 2010. The flare of TeV flux detected by SHALON on 10 Nov. 2010 correlates with a flux increase observed by Fermi LAT at the phase of the plateau and flare in R-band. The flux increase was detected on 2–4 Dec. with flux of (3.41±0.70)×10−12cm−2s−1. This increase correlates with flares observed by Fermi LAT [25] and corresponds to the phase of increasing flux of the post-flare.
Very high energy flux variation time-scales observed by SHALON are similar to ones observed by Fermi LAT [24]. The short flaring times suggest parsec-scale size regions for the origin of TeV and MeV-GeV emission [24].
7. 4C + 55.17 (
z
=
0
.
896
)
4C+55.17 is a radio-loud active galaxy classified as a FSRQ. This object was previously detected at high energies with EGRET and Fermi LAT with an unusually hard MeV-GeV γ-ray spectrum [26]. 4C+55.17 was observed by SHALON in the period from 2012–2016 for
a total of 61.2 hours [1]. After the standard analysis, a clear excess corresponding to an 8.4σ effect [9] was determined with an integral flux and the observed energy spectrum shown in Table 1. Figure 4 shows the spectral energy distribution of 4C+55.17, represent the data from the SHALON telescope, and the line limited area at TeV energies is the intrinsic spectrum in the source corrected on the extragalactic background light attenuation [6]. The image of 4C+55.17 obtained by SHALON at TeV energies is in Fig.4.
EPJ Web of Conferences 145, 19004 (2017) DOI: 10.1051/epjconf/201714519004 ISVHECRI 2016
with low variability in radio [28] points out an absence of features providing high activity at all wavelengths.
8. 1739 + 522 (4C + 51.37) (
z
=
1
.
375
)
One more remote metagalactic γ-source of the FSRQ type was detected by SHALON in 1999 and is being intensively studied since then [1,5]. This object was identified with 1739+522 (4C+51.37). It was observed by SHALON in the period from 1999, 2003–2013 for a total of 119.8 hours. The average value of the integral flux is (0.49±0.05)×10−12cm−2s−1 at E >0.8 TeV, with 15.1σ [9]. The energy spectrum parameters are shown in Table 1. The image of 4C+51.37 at TeV energies by SHALON is presented in Fig. 4; on the spectral energy distribution (fig. 4) represent the data from the SHALON telescope. Lines at TeV energies limit the range of the intrinsic spectrum in the source corrected on the extragalactic background light attenuation [6].
1739+522 is a high polarization radio quasar. It is detected by EGRET with an average γ-flux in the range∼30 MeV to 50 GeV about 2×10⁻⁸cm−2s−1with a photon index of∼2.2 [29]. The 100 MeV–100 GeV γ-ray emission from 1739+522 was detected by Fermi LAT with average flux of F (>1 GeV)=(2.5±0.2)× 10−9cm−2s−1 and power-law with photon index = 2.5±0.04 [30].
Two periods of TeV flux increase were found since the first detection of 1739+522. In observations from 8 to 20 June 2004 the flux increase from the level of the average value up to (1.93±0.60)×10−12cm−2s−1 at E >0.8 TeV in the peak on 12 June 2004 was recorded in two night observations. A similar high flux increase was detected on 12 May 2005, but no duration of flux increase were found, because the observations were interrupted due to weather conditions.
9. B2 0242 + 43 and B2 0743 + 25 (z
>
2)
It was discussed in [31] and later, that theγ-ray spectra of distant sources at 10s of GeV to TeV energies begin to be attenuated by the still poorly known EBL photon field due to theγ +γ →e+e−process. So, to estimate the cosmic γ-ray horizon two extremely high-redshifted sources from the first and second Fermi LAT AGN catalogue were observed by SHALON in the autumn-winter period of 2014.
B2 0242+43, with z=2.243, is a radio-loud active galaxy classified as a FSRQ. It was observed by SHALON in 2014, for a total of 14 hours, at zenith angles from 16◦to 33◦. After the standard analysis, an excess corresponding to a 4.8σ effect [9] was determined with an integral flux of (0.58±0.20)×10−12cm−2s−1. The unexpected
high-level flux increase up to twice that detected on average was observed at the end of November. The area around B2 0242+43 of 20 size in radius doesn’t contain any candidate for TeV-emission nor any GRBs, supernova explosions or other powerful sources over the wide wavelength range variable sources that could be sources of the flares detected in the observation period. The list of nearby sources includes two weak radio-objects and one X-ray source weren’t confirmed after their detection [32,33].
B2 0743+25, at redshift z=2.979, is an FSRQ from the Fermi LAT catalogues. It was observed by SHALON in the period from 2014 to 2016 on clear moonless nights, for a total of 20 hours, at zenith angles ranging from 15◦ to 32◦. The integral γ-ray flux of I (>0.8 TeV)= (0.37±0.16)×10−12cm−2s−1 was determined with a significance of 5.1σ [9]. An analysis of the region of 20 in radius around B2 0743+25 was performed in order to find any close powerful sources that could be resolved as this distant quasar [33,34]. Among the nearby sources no candidate for TeV-emission were found as four quasar objects, known only due to identification by V B U magnitude, were not recognized in radio, X-ray or MeV-GeV energies [34].
Further observations and investigations of B2 0242+ 43, B2 0743+25 and the area around these objects are continuing to establish a reliable source of TeV γ-ray emission.
10. Conclusion
The results presented here are a brief summary of long-term observations of AGNs by the SHALON telescope such as spectral energy distributions and images. A number of variability periods at different wavelengths including VHEγ-rays were found. Short flaring times of very high energy emission from 3C 454.3 and 1739+522 are found and it suggests parsec scale size regions of TeV gamma-ray origin in these sources. In addition, all data obtained in SHALON observations are compared with those from other experiments at high and very high energies.
References
[1] V.G. Sinitsyna and V.Yu. Sinitsyna “Astroparticle, Particle, Space Physics and Detectors Physics Applications” (Proc. 14th ICATPP, 2013) ed. S. Giani, C. Leroy, P.-G. Rancoita, L. Price and R. Ruchti (Singapore: World Scientific 2014) vol. 8, p. 3; ibid. p. 20
[2] V.G. Sinitsyna,V.Yu. Sinitsyna, Astron. Lett. 40 (2–3), 75 (2014)
[3] V.G. Sinitsyna et al., In Proc. of 32nd ICRC, Beijing, China, 2011; vol. 8/11, p. 26
[4] V.G. Sinitsyna, V.Yu. Sinitsyna EPJ Web of Conferences 52, 10005 (2013)
[5] V.G. Sinitsyna et al., Int. J. Mod. Phys. A 29, 7023, 7026, 7029 (2005)
[6] V.G. Sinitsyna et al., J. Phys.: Conf. Ser. 409, 012113 (2013)
[7] V.G. Sinitsyna et al., J. Phys.: Conf. Ser. 409, 012112 (2013)
[8] A.A. Abdo et al., Astrophys. J. 727, 129 (2011) [9] T.-P. Li and Y.-Q. Ma, Astrophys. J. 272, 317 (1983) [10] J. Kataoka et al. Astrophys. J. 2011, 740, 29
[11] J.P. Leahy, R.A. Perley Astrophys. J. 102, 537 (1991) [12] E. Idesawa et al. Publ. Astron. Soc. Jpn. 49, 631
(1997)
[13] H. Seta et al. Publ. Astron. Soc. Jpn. 61, 1011 (2009) [14] E. Valtaoja et al., Astrophys. J. 531, 744 (2000) [15] C.E. Tateyama et al. Astrophys. J. 608, 149 (2004) [16] G. Ghisellini et al. Mon. Not. R. Astron. Soc. 301,
451 (1998)
[18] A.A. Abdo et al., Astrophys. J. 700, 597 (2009); ibid.
715, 429 132 (2010)
[19] M. Hayashida et al., In Proc. of 31st ICRC, Lodz, Poland, 2009
[20] P. Pihajoki et al. Astrophys. J. 764, 5 (2013) [21] M. Ackermann et al. Astrophys. J. 810, 14 (2015) [22] I. Agudo et al. Astrophys. J. Lett. 726, L13 (2011) [23] A.A. Abdo et al., Astrophys. J. 699, 817 (2009) [24] M. Ackermann et al. Astrophys. J. 721, 1383 (2010) [25] A.A. Abdo et al. Astrophys. J. 733, L26 (2011)
[26] W. McConville et al. Astrophys. J. 738, 148 (2011) [27] A.P. Marscher et al. Astrophys. J. 577, 85 (2002) [28] P. Augusto et al. MNRAS 368, 1411 (2006) [29] R. Mukherjee et al. Astrophys. J. 490, 116 (1997) [30] P.L. Nolan et al. ApJS 199, 31 (2012)
[31] A.I. Nikishov Sov. Phys. JETP 14, 393 (1962) [32] I.I.K. Pauliny-Toth et al., Astron. J. 77, 265 (1972) [33] W. Voges et al. Astron. Astrophys. 349, 389 (1999) [34] M.-P. Veron-Cetty, P. Veron Astron. Astrophys. 518,


![Winston Churchill's speech [on a Council of Europe]. Zurich, 19 September 1946](data:image/gif;base64,R0lGODlhAQABAIAAAP///wAAACH5BAEAAAAALAAAAAABAAEAAAICRAEAOw==)