P R O C E E D I N G S
Open Access
Analysis of Genetic Analysis Workshop 18 data
with gene-based penalized regression
Kristin L Ayers
*, Heather J Cordell
From
Genetic Analysis Workshop 18
Stevenson, WA, USA. 13-17 October 2012
Abstract
Under the premise that multiple causal variants exist within a disease gene and that we are underpowered to detect these variants individually, a variety of methods have been developed that attempt to cluster rare variants within a gene so that the variants may gather strength from one another. These methods group variants by gene or proximity, and test one gene or marker window at a time. We propose analyzing all genes simultaneously with a penalized regression method that enables grouping of all (rare and common) variants within a gene while
subgrouping rare variants, thus borrowing strength from both rare and common variants within the same gene. We apply this approach using a burden based weighting of the rare variants to the Genetic Analysis Workshop 18 data.
Background
Genome-wide association studies have identified many common variants associated with complex diseases, yet these variants explain only a small proportion of the her-itability. Previous studies demonstrate that multiple rare variants (RVs) within the same gene can contribute to monogenic disorders. Availability of imputation and sequence data has sparked interest in methods for the analysis of RVs that group or collapse variants within a region, gene, or gene pathway. Burden tests collapse RVs into a single variable (such as an indicator or count) for analysis, and require the use of a minor allele frequency (MAF) threshold to define a RV. Burden-based methods such as CAST [1], GRANVIL [2], and the variable thresh-old method [3], ignore the effects from the common var-iants (CVs), which may contain additional information. The combined multivariate and collapsing [4] method allows RVs to be simultaneously analyzed with CVs in a multivariate test. Weighting methods [5] avoid the issue of defining and separating common and rare variants by placing a predefined weight on each variant; for example, one that is inversely related to the MAF.
Burden tests have high power when all causal variants have effects in the same direction, but can lose power
when there are protective effects in addition to risk effects. Thus, methods, such as C-alpha [6], were intro-duced, which compare the expected variances of the dis-tribution of the allele frequencies to the actual variance. Sequence kernel association test (SKAT) [7] is a general-ized version of C-alpha that allows for variant weights; its successor, SKAT-O [8], optimally combines SKAT with a burden test. All these methods operate on a sin-gle gene, ignoring information contained in other genes or outside gene boundaries. Because multiple genes can contribute to disease, we propose to analyze all genes simultaneously in a penalized regression framework. Penalized regression methods can perform model selec-tion by shrinking the size of the coefficients, driving the coefficients of markers with little or no apparent effect down toward zero. To find the subset of genes most associated with disease, we propose penalized regression of rare and common variants (PeRC), a method that groups single-nucleotide polymorphisms (SNPs) by genes, and collapses the RVs within a gene into a single variable.
Methods
Quantitative traits can be analyzed by minimizing the sum of square residuals (RSS). Given a phenotype vector
Y ofmobservations, and a matrix ofpSNP genotypesX,
* Correspondence: [email protected]
Institute of Genetic Medicine, Newcastle University, Central Parkway, Newcastle Upon Tyne, NE1 3BZ, UK
we estimate our vector of regression coefficients,β, by
whereβis our vector of regression coefficients andηi,
the estimated trait value, is computed asηi=
p
j=1xijβj. To perform model selection in a high-dimensional pro-blem, we maximize the negative RSS subject to a penalty that is dependent on the magnitude of the estimated parameters. Models that include many variables with large regression coefficients incur heavier penalties, and thus optimization tends to occur with sparser models that include only the variables with the greatest effects on the RSS. We maximize our objective function, the penalized RSS:
O(X,Y,β,λ)=−1
2RSS(X,Y,β)−f(β,λ)
where the penalty f is a function of the regression coefficients and penalty parameters. Many different pen-alty functions have been proposed, such as the L1 norm
(or lasso), the L2norm (or ridge), and the combination
of these 2 norms, the elastic net [9]. The elastic net pen-alty may be written as:
f(λ,β)=λ1||β||1+λ2||β||22,
and L2norm, respectively, with jindexing variables, and λ1andλ2are fixed parameters controlling the penalty strengths.λ2= 0and λ1= 0correspond to the lasso and the ridge, respectively. The L1 norm imposes heavy
shrinkage, driving the coefficient of many variables to zero, and generally includes only 1 of a group of highly correlated variables. Ridge regression results in similar coefficients for highly correlated variables. The elastic net lies in the middle, encouraging correlated variables to enter the model together.
To encourage (a) variables within a group to enter a model together and (b) sparsity between groups, we can employ the group lasso or the sparse group lasso [10]. The sparse group lasso additionally enforces sparsity within groups, and has been previously applied in gen-ome-wide association studies for variants with MAFs >1% in the software package Mendel [11]. This penalty function may be written as:
f(λ,β)= is a parameter that controls the strength of the group pen-alty, andλ2is a parameter that controls the strength of the sparsity penalty. Zhou et al [11] recommend setting λ1=λ2.
In PeRC, we use a combination of the group lasso and elastic net penalties to group both RVs and CVs within genes. We first collapse/cluster the RVs within a group into a single variable to model a common effect. We can replaceηiwith:
ηi(β,X)=β0+
γgis the coefficient for the collapsed RVs in group g, whilegris the set of RVs within group g with MAF <τ, andgcis the set of common variants with MAF≥τing. To rescale the collapsed genotype to the range 0[2],dmax
anddmincorrespond to the maximum and minimum num-ber of RVs in groupgthat any individual possesses. Addi-tionally, we can encourage RVs and CVs in the same gene or window to be in the model together via a group penalty. Our generalized penalty function can be written as:
f(λ,β)=Gg=1
The first term groups the RVs and CVs within our region of interest; the second and third terms correspond to the elastic net and promote sparsity of the individual CVs and the collapsed RV groups. Ifλ= (λ1,λ2,λ3), then when τ = 1,λ= (λ1,λ2, 0)corresponds to a sparse group lasso, andλ= (0,λ2,λ3)corresponds to the elastic net. We set the weightsgon each group equal to√(lg/max(lg)),where
lgis the number of CVs in groupg plus 1 to account for the collapsed RV variable. This prevents the preferential selection of large groups solely for their ability to explain a greater proportion of phenotype variance because of increased degrees of freedom. We assign individual weights to each CV, settingωj= 2√(MAFj(1−MAFj)), as
imple-mented in the software Mendel. This downweights rarer variants relative to CVs. We also place a weightrgon the rare group coefficient of√(fr1−fr), wherefris the fre-quency of the collapsed locus. We have currently set
(λ1,λ2,λ3) =κ(1, 1, 1)whereκcontrols the amount of sparsity in the model. The objective function is maximized using Newton’s method and cyclic coordinate ascent. We update our coefficients at each iteration with the CLG algo-rithm [12]:βjn+1=βjn−O(βn)/Oβn,where nis the iteration number. If the proposed new value forβjn+1does
not improve the objective function, we halve the proposed change inβjand reattempt.
Results
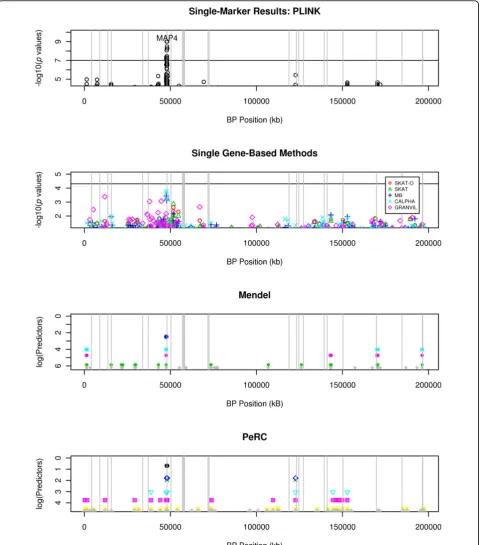
Figure 1Results for simulated DBP. The top 2 plots report the −log10(pvalues) for the PLINK and the single gene-based methods,
locate genes. For each gene symbol, the minimum tran-scription start and maximum trantran-scription end positions were adopted as the base pair position boundaries for the gene. Overlapping genes were collapsed into a single group/gene region, which will be referred to as a gene from now on. Genes with multiple positions or less than 500 base pairs were removed. The result was a list of 1026 genes, of which 1024 were present in the imputed data. Of the 1,215,399 SNPs on chromosome 3, 590,721 were within a gene, and 315,970 of the remaining SNPs had a MAF >0.01.
We analyzed chromosome 3 with a variety of methods. PeRC and Mendel were run on a data set comprised of all SNPs within genes plus the common SNPs (MAF >0.01) outside the boundaries of any gene. In PeRC, we usedτ= 0.005 as the cutoff threshold for the RVs. Single marker analysis was performed in PLINK [13] on all SNPs, using an additive model. Additionally, single-gene tests were performed in the R package SKAT [7], and in the software package GRANVIL with the default RV threshold of 0.05 [2]. In SKAT, we performed 3 different analyses from the Beta(MAF,a1,a2) distribution: (a) a1= 1
and a2= 25, the SKAT default (SKAT), (b) a1= 1 and a2
= 1, equivalent to C-alpha (CALPHA), and (c) a1 = 0.5
and a2= 0.5, equivalent to the weights used in Madsen
and Browning (MB) [5]. Analysis was also performed in SKAT-O with the SKAT default values. The sparse group lasso was implemented in Mendel with equal group and sparsity penalties, and variant weights based on MAF. Family information was ignored for each method, and test statistic inflation as a result of familial relationships or poor quality control was corrected via genomic control.
Diastolic blood pressure
We analyzed both real diastolic blood pressure (DBP) and the simulated DBP for replicate 1. For both the real and simulated data, DBP was first regressed on age, age × age, sex, smoking status, and use of medication, considering each time point for each individual as a separate data entry. The mean residual over all time points for each individual became the quantitative trait variable to be used in each method. The residuals for both the real and simu-lated trait appeared normally distributed.
Real data
After analysis, we looked for statistically significant (after genomic control correction for inflation and Bonferroni correction for multiple testing) SNPs or genes from those methods that provided a test statistic. For the gene-based methods, the Bonferroni correctedpvalue threshold was 4.9 × 10⁻⁵. For the PLINK analysis, we used a significance threshold of 10−7. None of the methods gave any significant results, so we examined the top 5 hits for the gene-based
methods and PLINK, or the models that gave us closest to 5 independent signals for PeRC and Mendel. Little concor-dance existed between the non-closely related methods, except for 2 genes: ZNF35was one of the top hits for SKAT/SKAT-O and GRANVIL, as wasRBMS3for SKAT/ SKAT-O and Mendel.
Simulated data
Figure 1 plots the results. There is a strong significant signal aroundMAP4 for the single-marker method. No genes were significant for any of the gene based meth-ods, butMAP4 is a top hit for both MB and CALPHA. PeRC and Mendel both selected SNPs in the vicinity of MAP4 as one of their top hits. PeRC identifies the neighboring gene DHX30 on the left and a SNP not contained in a known gene on the right. Mendel selected the gene group AK094639:CSPG5, approxi-mately 100 kilobases away.
Conclusions
There was little power to detect effects in this data set, suggesting that most of our top findings were most likely false positives. We did observe inflation in the sta-tistics (which we corrected using genomic control), sug-gesting that either (a) family structure needs to be taken into account, (b) the imputed data needs some heavy quality control, or (c) both. The Q-Q plots for the methods in the SKAT software were skewed, which may have left our corrected p values slightly conservative. Ideally, the imputed SNPs should have been cleaned using the imputation info score. However, several meth-ods were still able to detect a signal near the causal geneMAP4in the simulated data.
To control for family structure with imputed data, a possible strategy is to use the software package ProA-BEL [14] to construct the inverse variance-covariance matrix on the basis of the relationship matrix, which is made up of the kinship coefficients for family members. This package is not designed for RVs, but one could possibly collapse the counts of the RVs in a gene into a multiallelic marker to perform a burden-type test. Alter-natively, we may be able to use family information in the PeRC framework by maximizing the log likelihood,
−1 2
ln|V|+(Y−βX)TV−1(Y−BX), instead of the
−RSS, whereV is the variance-covariance matrix and|V| is its determinant.
Competing interests
The authors declare that they have no competing interests.
Authors’contributions
Acknowledgements
This work was supported by the Wellcome Trust (grant reference 087436). The Genetic Analysis Workshop 18 (GAW18) whole genome sequence data were provided by the T2D-GENES Consortium, which is supported by NIH grants U01 DK085524, U01 DK085584, U01 DK085501, U01 DK085526, and U01 DK085545. The other genetic and phenotypic data for GAW18 were provided by the San Antonio Family Heart Study and San Antonio Family Diabetes/Gallbladder Study, which are supported by NIH grants P01 HL045222, R01 DK047482, and R01 DK053889. The Genetic Analysis Workshop is supported by NIH grant R01 GM031575.
This article has been published as part ofBMC ProceedingsVolume 8 Supplement 1, 2014: Genetic Analysis Workshop 18. The full contents of the supplement are available online at http://www.biomedcentral.com/bmcproc/ supplements/8/S1. Publication charges for this supplement were funded by the Texas Biomedical Research Institute.
Published: 17 June 2014
References
1. Morgenthaler S, Thilly WG:A strategy to discover genes that carry multi-allelic or mono-multi-allelic risk for common diseases: a cohort multi-allelic sums test (CAST).Mutat Res2007,615:28-56.
2. Morris AP, Zeggini E:An evaluation of statistical approaches to rare variant analysis in genetic association studies.Genet Epidemiol2009,
34:188-193.
3. Price AL, Kryukov GV, de Bakker PI, Purcell SM, Staples J, Wei LJ, Sunyaev SR:
Pooled association tests for rare variants in exon-resequencing studies.
Am J Hum Genet2010,86:832-838.
4. Li B, Leal SM:Methods for detecting associations with rare variants for common diseases: application to analysis of sequence data.Am J Hum
Genet2008,83:311-321.
5. Madsen BE, Browning SR:A groupwise association test for rare mutations using a weighted sum statistic.PLoS Genet2009,5:e1000384.
6. Neale BM, Rivas MA, Voight BF, Altshuler D, Devlin B, Orho-Melander M, Kathiresan S, Purcell SM, Roeder K, Daly MJ:Testing for an unusual distribution of rare variants.PLoS Genet2011,7:e1001322. 7. Wu MC, Lee S, Cai T, Li Y, Boehnke M, Lin X:Rare-variant association
testing for sequencing data with the sequence kernel association test.
Am J Hum Genet2011,89:82-93.
8. Lee S, Emond JM, Bamshad MJ, Barnes KC, Rieder MJ, Nickerson DA, Christianin DC, Wurfel MM, Lin X:Optimal unified approach for rare-variant association testing with application to small-sample case-control whole-exome sequencing studies.InAm J Hum Genet. Volume 91.NHLBI GO Exome Sequencing Project-ESP Lung Project Team; 2012:224-237. 9. Zou H, Hastie T:Regularization and variable selection via the elastic net.
J Roy Stat Soc Ser B2005,67:301-320.
10. Friedman J, Hastie T, Tibshirani R:A note on the group lasso and sparse group lasso.Technical report, Department of Statistics, Stanford University
2010.
11. Zhou H, Sehl ME, Sinsheimer JS, Lange K:Association screening of common and rare genetic variants by penalized regression.
Bioinformatics2010,26:2375-2382.
12. Genkin A, Lewis DD, Madigan D:Sparse logistic regression for text categorization.DIMACS Working Group on Monitoring Message Streams
Project Report2005.
13. Purcell S, Neale B, Todd-Brown K, Thomas L, Ferreira M, Bender D, Maller J, Sklar P, de Bakker P, Daly M,et al:PLINK: a tool set for whole-genome association and population-based linkage analyses.Am J Hum Genet
2007,81:559-575.
14. Aulchenko YS, Struchalin MV, Duijin CM:ProABEL package for genome-wide association analysis of imputed data.BMC Bioinformatics2010,11:134.
doi:10.1186/1753-6561-8-S1-S43
Cite this article as:Ayers and Cordell:Analysis of Genetic Analysis Workshop 18 data with gene-based penalized regression.BMC
Proceedings20148(Suppl 1):S43.
Submit your next manuscript to BioMed Central and take full advantage of:
• Convenient online submission
• Thorough peer review
• No space constraints or color figure charges
• Immediate publication on acceptance
• Inclusion in PubMed, CAS, Scopus and Google Scholar
• Research which is freely available for redistribution