R E S E A R C H A R T I C L E
Open Access
Self-reported pregnancy-related health
problems and self-rated health status
in Rwandan women postpartum: a
population-based cross-sectional study
Jean Paul S. Semasaka
1,2*, Gunilla Krantz
3, Manasse Nzayirambaho
2, Cyprien Munyanshongore
2,
Kristina Edvardsson
1,4and Ingrid Mogren
1Abstract
Background:Self-rated health status (SRH) can be used as a predictor of morbidity and mortality. Postpartum self-rated health has been used to estimate maternal morbidity and postpartum problems. Reproductive history factors are associated with poor self-rated health postpartum. This study investigated prevalence of self-reported health problems during first, second, and third trimesters of pregnancy, delivery, and postpartum. In addition, this study investigated SRH in Rwandan women up to 13 months from partus.
Methods:This population-based, cross-sectional study collected data in 2014 using structured interviews (N= 921). Univariable analysis was used to identify variables that were associated with poor self-rated health status (poor-SRH). Logistic regression analyses were performed to identify factors associated with poor-SRH at one day, one week, and one month postpartum and at the time of the interview.
Results:Mean time between latest delivery and the time of interview was 7.1 months. Prevalence of anaemia, hypertension, diabetes mellitus during pregnancy, and severe bleeding during pregnancy and labour were 15.0, 4.9, 2.4, and 3.7 %, respectively. The prevalence of poor-SRH was 32.2 % at one day postpartum, 7.8 % at one month, and 11.7 % at time of the interview. Hypertension during pregnancy and significant postpartum haemorrhage were associated with poor-SRH at one day and one week postpartum. Severe bleeding during pregnancy and labour were associated with poor-SRH at one week and one month postpartum. Infection and anaemia during pregnancy were associated with poor-SRH at one month postpartum and at the time of interview. The Kaplan-Meier curves illustrate restitution of health for most women during the study period.
Conclusions:This population-based study reports a high prevalence of poor SRH status among Rwandan women in the early postpartum period. Identified factors associated with poor-SRH were severe bleeding, hypertension, infection, and anaemia during pregnancy and postpartum haemorrhage. These factors may be prevented or reduced by providing more frequent and specific attention during pregnancy and by providing timely measures that address complications during delivery, including adequate postpartum care.
Keywords:Self-rated health status, Pregnancy, Rwanda, Reproductive history, Cross-sectional study, Pregnancy-related complications
* Correspondence:[email protected] 1
Department of Clinical Sciences, Obstetrics and Gynecology, Umeå University, Umeå, Sweden
2University of Rwanda College of Medicine and Health Sciences School of
Public Health, Kigali, Rwanda
Full list of author information is available at the end of the article
© The Author(s). 2016Open AccessThis article is distributed under the terms of the Creative Commons Attribution 4.0 International License (http://creativecommons.org/licenses/by/4.0/), which permits unrestricted use, distribution, and reproduction in any medium, provided you give appropriate credit to the original author(s) and the source, provide a link to the Creative Commons license, and indicate if changes were made. The Creative Commons Public Domain Dedication waiver (http://creativecommons.org/publicdomain/zero/1.0/) applies to the data made available in this article, unless otherwise stated. Semasakaet al. BMC Pregnancy and Childbirth (2016) 16:340
Background
Self-rated health status (SRH) is recognised as a global measure of estimation of quality of life and a good predictor of morbidity and mortality [1–3]. SRH uses subjective questions, to ask how people perceive their health status. These questions summarize the partici-pants’ health status, including physical, psychological, and social dimensions that are not easily accessible to an objective observer [4, 5].
In 2012, an estimated 213 million pregnancies occured in the world and more than 1.5 million of these pregnan-cies had pregnancy-related complications [6, 7]. The most common pregnancy-related complications are postpartum haemorrhage, hypertensive disorders (including pre-eclampia and eclampsia), sepsis, obstructive or prolonged labour, and spontaneous abortion [8]. Health problems such as headache, low back pain, anxiety, depression, urin-ary incontinence, and feacal incontinence may remain after childbirth [9–12]. There is poor documentation glo-bally about the extent and the nature of women’s postpar-tum health status [13–16]. Poor self-rated health status has been found to be associated with reproductive history factors such as being a single mother, higher parity, deliv-ery by caesarean section, and young age [10, 17, 18].
In 2013, an estimated 323,197 women gave birth in Rwanda, and 14.7 % of these women were delivered by caesarean section [19, 20]. Rwanda, like other low in-come countries, has made sincere efforts during the last decade to decrease maternal mortality and morbidity [21]. In Rwanda, from 2010 to 2015, the four recom-mended antenatal care (ANC) visits by the World Health Organization (WHO) increased from 35 to 44.3 %, with the incease number of women having the first ANC visit during the first trimester of pregnancy from 38 to 56.3 %. Skilled provider assistance during de-livery increased from 69 to 91 %, and uptake of postnatal care from 18 to 43 %. Moreover, maternal mortality ratio was estimated to have decreased from 476 to 210 per 100 000 live births during the same period [21–23].
Rationale of the study
There is insufficient information on rates of pregnancy-related complications in Rwanda. In addition, health status postpartum in Rwandan women is not well de-scribed. This study aims to fill the knowledge gap in this area and to serve as a base for policy-makers in their decision-making in order to improve maternal and foetal health and women’s health postpartum.
Aims
In a population-based sample, this study investigated the self-rated overall health status in relation to reproductive history within 13 months from partus. Specific aims to investigate were: i) prevalence of self-reported health
problems during first, second, and third trimesters of pregnancy, delivery, and postpartumii) self-rated overall health status and its determinants at one day, one week, and one month postpartum and at the time of the interview.
This study is part of the Maternal Health Research Programme (MaTHeR) undertaken by the University of Rwanda in collaboration with University of Gothenburg and Umeå University in Sweden.
Methods
The study setting
The Rwandan health system is decentralised with the community level as the first level of maternal health service provision. There are three community health workers (CHWs) in each village includingAnimatrice de Santé Maternelle (ASM), a CHW who is exclusively in charge of maternal health services [24, 25]. The second-ary level of maternal health services is the health center. The majority of women with uncomplicated pregnancies deliver at health centres, while complicated cases are referred to the district hospital level or to the referral hospitals according to the severity of the pregnancy-related problem [25].
This study was conducted in two locations in Rwanda: the city of Kigali and the Northern Province. Kigali in-cludes urban, semi-urban, and rural areas with a total population of 1,135,428 and 1910 villages. The Northern Province includes mainly semi-urban and rural areas with a population of 1,729,927 and 2881 villages [26].
Methodology of the study and study participants Sampling
This study applied a cross-sectional study design. A sample size of 922 women was calculated based on the estimated prevalence of pregnancy-related hypertension (10 %) [8] with an absolute precision of 5 %, a 10 % pos-sibility of non-responses, and a design effect of 1.5. A sampling frame prepared by the National Institute of Statistics of Rwanda (NISR) for the Rwandan general population and household census conducted in 2012 was used. This sampling frame is a complete list of villages covering the Northern Province and Kigali. From this sampling frame, 48 villages (1 %) were randomly se-lected. Eligible participants were women who gave birth within 13 months before data collection and who were identified with the assistance of the ASM. The final sam-ple consisted of 921 as one contact did not participate, giving a response rate of 99.9 %.
Questionnaire
latest pregnancy, latest delivery, and postpartum situation. Sociodemographic background characteristics included age, marital status, and educational level. The majority of questions in the questionnaire were closed ended ques-tions with a fixed number of response alternatives and Likert-type scale questions. For five questions in this study, the respondents were also given the possibility to give additional written comments. The questionnaire in-cluded questions about previous pregnancies as well as more detailed questions related to health problems during latest pregnancy, latest delivery, and postpartum period. Participants were also asked to report their SRH at one day postpartum, one week postpartum, one month postpartum, and at the time of the interview. First written in English, the questionnaire was translated into Kinyarwanda. There-after, the questionnaire was tested in a pilot study. The pilot study included 36 women from a village neighbouring a selected village of the study. All 36 questionnaires were completed, and apart from adjustments of the wording of some questions, no major revision of the questionnaire was needed after the pilot study.
Data collection procedures
All data were collected by a group of 12 female experi-enced interviewers (nurses, midwives, and clinical psychologists) through individual structured interviews to secure completeness of data. Before conducting the interviews, the interviewers participated in a five-day training. The data collection was performed between July 2014 and August 2014. At the end of each day, during the first three days of data collection, at least one participant per village was re-interviewed in order to check the completeness of the questionnaires and the accuracy of data collected. After the primary data entry, the information from 100 questionnaires, each including the 117 variables used in this study, were re-registered to check the accuracy of the first data entry. In total, 30 errors were detected which corresponds to an error rate of 0.25 % (30/11700). The erroneous data were there-after corrected.
Dependent variables
The participants retrospectively reported their SRH four times postpartum: one day, one week, one month, and at the time of the interview. There were five available response options: very good, good, neither good nor poor, poor, and very poor. In a sub-part of analysis, the variable was dichotomised into two categories labelled good health status (good-SRH) for those who rated their health as very good or good, and poor health status (poor-SRH) for those who rated their health status as very poor or poor or neither good nor poor.
Independent variables
Sociodemographic and psychosocial variables were ana-lyzed as independent variables. Women’s agewas a con-tinuous numerical variable that was divided into five age categories: less than 25 years, 25–29 years, 30–34 years, 35–39 years, and more than 40 years. Marital status included married, cohabiting, separated or divorced, widowed, and unmarried or single.Age at marriagewas a continuous numerical variable that was categorized into less than 20 years, 21–30 years, and more than 30 years. Woman’s education was a combination of two primary variables: having attended school (yes or no) and educa-tional level. Educaeduca-tional level included primary level not complete, primary level completed, vocational training, secondary level senior 1–4, secondary school senior 5–6, tertiary level, and a do not know option. The two variables were grouped into four categories: no education, com-pleted primary level, comcom-pleted secondary school or voca-tional training, and tertiary university level. Woman’s occupation included student, unskilled worker, skilled worker, civil servant, not employed, and other employ-ment. Place of deliveryincluded delivery at home, on the way to the health facility, at health post/dispensary, at the health centre, at district/provincial hospital, at referral hospital, at a private clinic, at any other health facility, and at any other place.Mode of deliveryincluded delivered va-ginally without instruments, vava-ginally with forceps, vagi-nally with vacuum extraction, planned caesarean section, and emergency caesarean section. Health insurance in-cluded the categories no health insurance, community health-based health insurance, public health insurance, and private health insurance. A new variablehandicapping complicationwas created for women who reported either fistula, urinary incontinence, or fecal incontinence. First trimester was defined as the first three months of the pregnancy. Second trimester was defined as four to six months of pregnancy. Third trimester was defined as seven months or more. Variables about main health prob-lems during pregnancy and delivery were for each variable collected for the first, second, and the third trimesters. Thereafter, each variable – diabetes mellitus, anaemia, andinfections (composed essentially by urinary infection) during the first, the second, the third trimester – were combined to becomediabetes mellitus during pregnancy, anaemia during pregnancy, and infections during preg-nancy. Significant vaginal blood loss within 24 h after delivery and significant vaginal blood loss within the first weeks after delivery were combined intosignificant blood loss after delivery.Further categorization of variables are presented in first three tables.
Statistical analysis
Prevalence rates were calculated for description of different variables related to pregnancy, delivery, and postpartum.
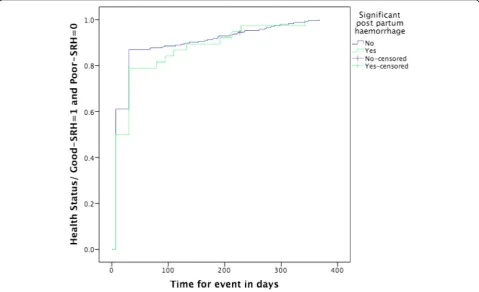
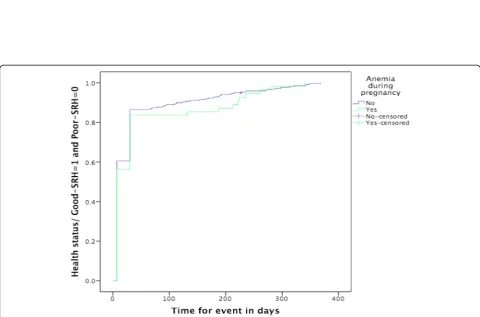
The study identified factors related to poor-SRH postpar-tum using univariable logistic regression analysis. Variables that were statistically significantly associated with poor-SRH status were considered for the final logistic regression model. Finally, a multivariable logistic regression model was built that calculated odds ratios (OR) and their 95 % confidence intervals (CI). In the multivariable model, for-ward stepwise regression was used. All statistically signifi-cant variables in univariable analyses were entered one by one to identify factors that had a relationship with poor-SRH at one day, one week, and one month postpartum and at time of the interview, keeping in the final model only fac-tors that were statistically significant (p< 0.05). All multi-variable models included number of births, women’s age, mode of delivery, and marital status for theoretical reasons. A Kaplan-Meier analysis using the curve“One minus sur-vival” with a log rank test was constructed to illustrate the time-dependent self-rated poor health status in relation to anaemia during pregnancy, women’s level of education, and significant postpartum haemorrhage. This analysis was done to illustrate improvement of health status in women who reported low level of education, anaemia during preg-nancy, or significant postpartum haemorrhage compared to those without these factors during the follow-up period. These analyses only included women rating their health as poor-SRH at one day postpartum. Thus, the Kaplan-Meier analyses included a sub-category of 296 participants. The time end point for each participant was the time of the interview. All analyses were performed in SPSS version 22.
Results
Sociodemographic and reproductive history characteristics
A total of 921 women aged 15 to 46 years with a mean age of 27.9 years were enrolled in this study. The average period between the date of the interview and the date of the latest delivery was 7.1 months (range: 1.4–14.3 months). The dis-tribution of proportions in relation to the postpartum follow-up time were 35.3 % for 1–5 months, 31.6 % for 5.1–9 months, and 33.1 % for 9.1–14.3 months. Frequen-cies and percentages of sociodemographic and reproductive history characteristics of participants are presented in Table 1. Married or cohabiting women constituted 84.1 % of participants, and single or unmarried women corre-sponded to 13.4 % of the sample. Primiparus mothers rep-resented 30.7 % of the participants and multiparous women with more than four births represented 24.2 % of the partic-ipants. A large majority of participants (87.6 %) reported a normal vaginal delivery at a health facility, and 5.1 % re-ported delivery at home or on the way to a health facility.
Health problems during pregnancy and delivery period Prevalence of self-reported, pregnancy-related health problems during first, second, and third trimesters of
pregnancy are presented in Table 2. Self-reported preva-lence of anaemia, hypertension, diabetes mellitus, and severe bleeding during pregnancy were 15.0, 4.9, 2.2, and 2.0 %, respectively, and 15.7 % reported being trans-ferred pre-delivery from a health center to a district hos-pital or to a referral hoshos-pital due to health problems. Abnormal foetal position was reported in 3.9 % of cases.
Health problems during postpartum period
A total of 8.5 % of participants reported significant postpar-tum haemorrhage immediately after delivery or within 24 h, and 4.7 % reported significant postpartum haemor-rhage during their first week postpartum. At the time of the interview, the prevalence of almost daily or weekly irritabil-ity, anxiety, and depression was 6.5 %, 22.6 %, and 14.8 %, respectively. A total of 2.0 % of the participants reported having developed vaginal fistula, 0.4 % reported fecal incon-tinence, 2.4 % reported urinary inconincon-tinence, and 3.3 % re-ported problems related to an episiotomy during most recent delivery. Generalized fatigue almost daily or weekly was reported by 17.3 %, severe headache by 21.7 %, and low back pain by 26.4 %.
Self-rated overall health status postpartum
The proportion of women who rated their overall health status as very poor or poor decreased during the study period (Fig. 1). Almost a third of participants (32.2 %) re-ported poor-SRH at one day, but only 11.7 % were still reporting poor-SRH at the time of the interview. The Kaplan-Meier curves illustrate that women with low level of education, women with anaemia during pregnancy, and women with significant postpartum haemorrhage reported poorer health status during the early part of the postpartum period, compared to women with none of these conditions. However, the log rank test revealed that for the entire follow-up period there was no statistically significant differ-ence between groups for self-rated overall health status in relation to level of education (p= 0.863), anaemia during pregnancy (p= 0.463), and significant postpartum haemor-rhage (p= 0.401). For those women who were followed-up to around one year postpartum, there was no significant difference in overall health status between women charac-terized by different categories of exposures (Figs. 2, 3, and 4). Thus, women had in general regained a good health status.
Background characteristics and pregnancy outcomes and their associations with self-rated overall health status at different time points postpartum
Table 1Socio-demographic and reproductive history background characteristics of participants
Variables Mean age (years) SDa
Women’s mean age 27.89 6.02
Women’s mean number of years of education 5.80 3.10
Husband’s mean age 32.55 7.74
Husband’s mean number of years of education mean
6.14 3.16
N %
Women’s age (years) 920 99.9
< 25 295 32.0
25–29 277 30.1
30–34 212 23.0
35–39 98 10.6
≥40 38 4.1
Marital status 920 99.9
Single or unmarried 123 13.4
Widow 13 1.4
Separated or divorced 10 1.1
Cohabiting 292 31.7
Married 482 52.4
Age at marriage (years) 804 87.3
< 20 339 36.8
21–30 447 48.5
> 30 18 2.0
Woman’s education 921 100
No education 97 10.5
Completed primary level 608 66.0
Secondary school and vocational training 178 19.3
Tertiary, university level 38 4.1
Woman’s occupation 920 99.9
Student 17 1.9
Non skilled worker 529 58.3
Skilled worker 41 4.5
Civil servant 61 6.7
Not employed 257 28.3
Other employment 3 0.3
Place of delivery 919 99.8
At home or on the way to the health facility 47 5.1
At public health facility 862 93.6
At private or any other health facility 10 1.1
Mode of delivery 913 99.1
Vaginal without instrumentsb
798 86.6
Vaginal with forceps 4 0.4
Vaginal with vacuum extraction 0 0
Planned caesarean section 33 3.6
Emergency caesarean section 78 8.5
Table 1Socio-demographic and reproductive history background characteristics of participants (Continued)
Number of births 889 96.5
1 273 30.7
2 32 3.6
3 221 24.9
4 148 16.6
> 4 215 24.2
Discharge time (days) 899 97.6
< 3 474 52.7
3 273 30.4
4–7 119 13.2
> 7 33 3.7
Health insurance 920 99.9
No insurance 188 20.4
Community health based insurance 686 74.5
Public insurance (RAMA, MMI, MIS/UR)c and other private
47 5.1
ANC visits 915 99.3
Yes 910 98.8
No 5 0.5
Number of ANC visits 915 99.3
1–3 497 54.3
≥4 418 45.7
Religion 919 99.8
Catholicism 428 46.6
Protestantism 334 36.3
Adventist 77 8.4
Islam 16 1.7
Other religion 58 6.3
No religion 6 0.7
Husband’s age group (years) 774 84.0
< 25 78 8.5
25–29 240 26.1
30–34 195 21.1
35–39 119 12.9
40–44 86 9.3
≥45 56 6.1
statistically significantly associated with poor-SRH at one day postpartum: caesarean section (reference group (ref.): vaginal delivery with or without instruments), hypertension during pregnancy and de-livery (ref.: no hypertension), and significant postpar-tum haemorrage (ref.: no significant postpartum haemorrage) (Table 4).
Self-rated overall health status at one week postpartum The univariable logistic regression analyses revealed sev-eral variables statistically significally associated with poor-SRH one week postpartum: anaemia during pregnancy (OR = 1.78, CI = 1.15–2.75; ref.: no anaemia), caesarean section as mode of delivery (OR = 2.63, CI = 1.68–4.11; ref.: vaginal delivery with or without instruments), hyper-tension during pregnancy and delivery (OR = 3.41, CI = 1.87–6.24; ref.: no hypertension), severe bleeding during pregnancy and labour (OR = 3.69, CI = 1.82–7.48; ref.: no severe bleeding), significant postpartum haemor-rage (OR = 2.60, CI = 1.61–4.21; ref.: no significant postpartum haemorrage), handicapping complication (i.e., postpartum fistula or fecal and urinary
Table 2Prevalence of self-reported pregnancy-related problems in 1st, 2nd, and 3rd trimestersaof pregnancy, and the cumulative
prevalenceb
Variable 1st trimester 2nd trimester 3rd trimester Cumulative prevalence
n % n % n % n %
Hypertension 28 3 14 1.4 17 1.8 45 4.9
Convulsions 18 2 3 0.3 5 0.5 22 2.4
Diabetes mellitus 11 1.2 10 1.1 3 0.3 20 2.2
Bad smelling and vaginal discharge 41 4.5 47 5.1 29 3.1 85 9.2
Anaemia 66 7.2 81 8.8 58 6.3 138 15.0
Severe vaginal bleeding 14 1.5 6 0.7 18 2.0
Severe or continuous headache 59 6.4 46 5.0 72 7.8
Dimness or blurring vision 99 10.9 62 6.7 119 12.9
Abdominal pain and severe bleeding 16 1.7 5 0.5 177 19.2
Vomiting 105 11.4 44 4.8 117 12.7
Fever 26 1.3 9 1.0 29 3.1
Leaking of fluid from vagina 54 5.9 61 6.6 82 8.9
Swollen extremities 55 6.0 135 14.7 157 17
Preterm premature rupture of membranes 4 0.4 12 1.3 16 1.7
Diarrhoea 18 2.0 7 0.8 25 2.7
Baby not moving normally 9 1.0 5 0.5 12 1.3
Abdominal pain 93 10.1 93 10.1 177 19.2
Regular and painful uterine contractions 14 1.5 18 2.0 29 3.1
Infection 12 1.3 11 1.2 19 2.1
Preterm labour 29 3.1 29 3.1
a
The first trimester represents the first three months of pregnancy, the second trimester represents four to six months of pregnancy, and the third trimester was defined as seven months or more
b
The third trimester does not include events or complications during delivery Table 1Socio-demographic and reproductive history background characteristics of participants(Continued)
Husband’s education 791 85.0
No education 100 10.9
Completed primary level 527 57.3
Secondary school and vocational training 117 12.7
Tertiary, university level 32 3.5
Don’t know 15 1.6
Household income per month 914 99.2
< 17,500 RwF 258 28.2
17,500–35,000 RwF 240 26.3
> 35,000 RwF 416 45.5
a
SD = Standard deviation
b
Vaginal without instruments = normal delivery without forceps nor vacuum extraction
c
incontinance) (OR = 3.34, CI = 1.67–6.70; ref.: no handicapping complication), woman’s age less than 25 year (OR = 1.61, CI = 1.10–2.35; ref.: age group 25 to 34 years of age), discharge time seven days post-partum (OR = 4.32, CI = 2.07–9.02; ref.: discharge time less than 3 days), and convulsions during pregnancy,
delivery, and up to one month postpartum (OR = 2.35, CI = 1.12–4.91; ref.: no convulsions).
In a multivariable logistic regression model (n= 858), the following reproductive factors were statistically significantly associated with poor-SRH one week post-partum: caesarean section (OR = 1.95, CI = 1.08–5.53), Fig. 1Self-rated health status postpartum at one day, one week, one month, and at time of interview. Different self-rated health status categories are presented with proportions (%)
Fig. 2Kaplan-Meier curve showing change in health status from poor-SRH to good-SRH by experience of significant post partum haemorrage during follow-up timea(
n= 296b).aTime of interview is time end point for follow-up of each woman.bOnly women reporting poor-SRH at day one are included in analysis
Fig. 3Kaplan-Meier curve showing change in health status from poor-SRH to good-SRH by educational level during follow-up timea(n= 296b). a
Time of interview is time end point for follow-up of each woman.bOnly women reporting poor-SRH at day one are included in analysis
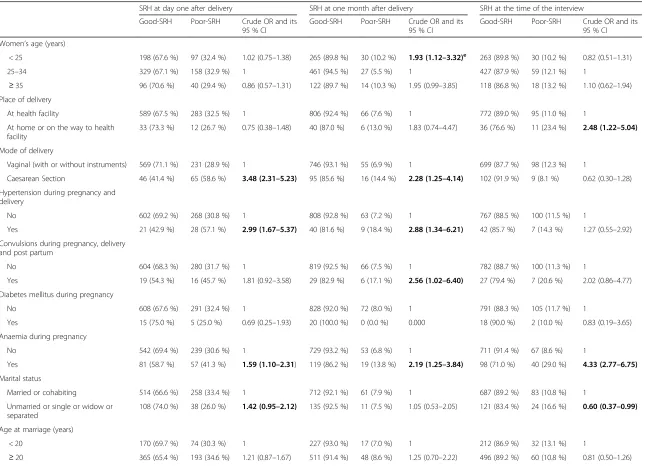
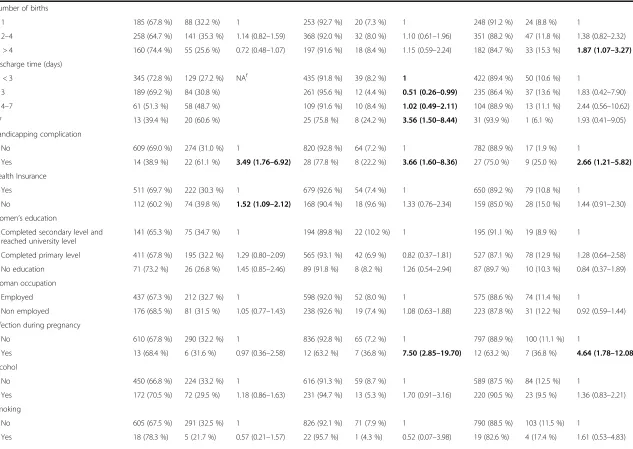
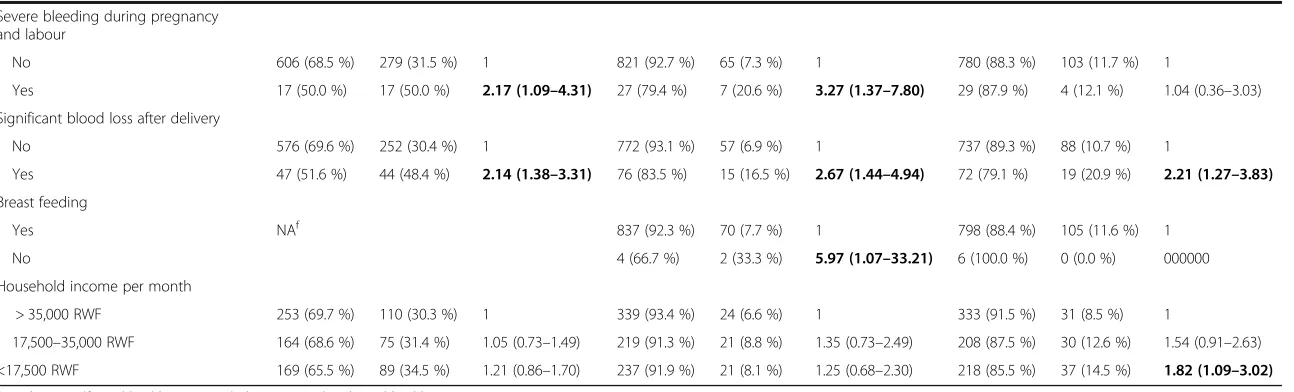
Table 3Good-SRHaand poor-SRHbin relation to background variables. Univariable logistic regression analysiscfor poor-SRH in relation to background variables at three timesd
SRH at day one after delivery SRH at one month after delivery SRH at the time of the interview
Good-SRH Poor-SRH Crude OR and its 95 % CI
Good-SRH Poor-SRH Crude OR and its 95 % CI
Good-SRH Poor-SRH Crude OR and its 95 % CI
Women’s age (years)
< 25 198 (67.6 %) 97 (32.4 %) 1.02 (0.75–1.38) 265 (89.8 %) 30 (10.2 %) 1.93 (1.12–3.32)e 263 (89.8 %) 30 (10.2 %) 0.82 (0.51–1.31)
25–34 329 (67.1 %) 158 (32.9 %) 1 461 (94.5 %) 27 (5.5 %) 1 427 (87.9 %) 59 (12.1 %) 1
≥35 96 (70.6 %) 40 (29.4 %) 0.86 (0.57–1.31) 122 (89.7 %) 14 (10.3 %) 1.95 (0.99–3.85) 118 (86.8 %) 18 (13.2 %) 1.10 (0.62–1.94) Place of delivery
At health facility 589 (67.5 %) 283 (32.5 %) 1 806 (92.4 %) 66 (7.6 %) 1 772 (89.0 %) 95 (11.0 %) 1
At home or on the way to health facility
33 (73.3 %) 12 (26.7 %) 0.75 (0.38–1.48) 40 (87.0 %) 6 (13.0 %) 1.83 (0.74–4.47) 36 (76.6 %) 11 (23.4 %) 2.48 (1.22–5.04)
Mode of delivery
Vaginal (with or without instruments) 569 (71.1 %) 231 (28.9 %) 1 746 (93.1 %) 55 (6.9 %) 1 699 (87.7 %) 98 (12.3 %) 1
Caesarean Section 46 (41.4 %) 65 (58.6 %) 3.48 (2.31–5.23) 95 (85.6 %) 16 (14.4 %) 2.28 (1.25–4.14) 102 (91.9 %) 9 (8.1 %) 0.62 (0.30–1.28)
Hypertension during pregnancy and delivery
No 602 (69.2 %) 268 (30.8 %) 1 808 (92.8 %) 63 (7.2 %) 1 767 (88.5 %) 100 (11.5 %) 1
Yes 21 (42.9 %) 28 (57.1 %) 2.99 (1.67–5.37) 40 (81.6 %) 9 (18.4 %) 2.88 (1.34–6.21) 42 (85.7 %) 7 (14.3 %) 1.27 (0.55–2.92)
Convulsions during pregnancy, delivery and post partum
No 604 (68.3 %) 280 (31.7 %) 1 819 (92.5 %) 66 (7.5 %) 1 782 (88.7 %) 100 (11.3 %) 1
Yes 19 (54.3 %) 16 (45.7 %) 1.81 (0.92–3.58) 29 (82.9 %) 6 (17.1 %) 2.56 (1.02–6.40) 27 (79.4 %) 7 (20.6 %) 2.02 (0.86–4.77)
Diabetes mellitus during pregnancy
No 608 (67.6 %) 291 (32.4 %) 1 828 (92.0 %) 72 (8.0 %) 1 791 (88.3 %) 105 (11.7 %) 1
Yes 15 (75.0 %) 5 (25.0 %) 0.69 (0.25–1.93) 20 (100.0 %) 0 (0.0 %) 0.000 18 (90.0 %) 2 (10.0 %) 0.83 (0.19–3.65)
Anaemia during pregnancy
No 542 (69.4 %) 239 (30.6 %) 1 729 (93.2 %) 53 (6.8 %) 1 711 (91.4 %) 67 (8.6 %) 1
Yes 81 (58.7 %) 57 (41.3 %) 1.59 (1.10–2.31) 119 (86.2 %) 19 (13.8 %) 2.19 (1.25–3.84) 98 (71.0 %) 40 (29.0 %) 4.33 (2.77–6.75)
Marital status
Married or cohabiting 514 (66.6 %) 258 (33.4 %) 1 712 (92.1 %) 61 (7.9 %) 1 687 (89.2 %) 83 (10.8 %) 1
Unmarried or single or widow or separated
108 (74.0 %) 38 (26.0 %) 1.42 (0.95–2.12) 135 (92.5 %) 11 (7.5 %) 1.05 (0.53–2.05) 121 (83.4 %) 24 (16.6 %) 0.60 (0.37–0.99)
Age at marriage (years)
< 20 170 (69.7 %) 74 (30.3 %) 1 227 (93.0 %) 17 (7.0 %) 1 212 (86.9 %) 32 (13.1 %) 1
≥20 365 (65.4 %) 193 (34.6 %) 1.21 (0.87–1.67) 511 (91.4 %) 48 (8.6 %) 1.25 (0.70–2.22) 496 (89.2 %) 60 (10.8 %) 0.81 (0.50–1.26)
Semasaka
et
al.
BMC
Pregnancy
and
Childbirth
(2016) 16:340
Page
9
of
1 185 (67.8 %) 88 (32.2 %) 1 253 (92.7 %) 20 (7.3 %) 1 248 (91.2 %) 24 (8.8 %) 1
2–4 258 (64.7 %) 141 (35.3 %) 1.14 (0.82–1.59) 368 (92.0 %) 32 (8.0 %) 1.10 (0.61–1.96) 351 (88.2 %) 47 (11.8 %) 1.38 (0.82–2.32)
> 4 160 (74.4 %) 55 (25.6 %) 0.72 (0.48–1.07) 197 (91.6 %) 18 (8.4 %) 1.15 (0.59–2.24) 182 (84.7 %) 33 (15.3 %) 1.87 (1.07–3.27)
Discharge time (days)
< 3 345 (72.8 %) 129 (27.2 %) NAf 435 (91.8 %) 39 (8.2 %) 1 422 (89.4 %) 50 (10.6 %) 1
3 189 (69.2 %) 84 (30.8 %) 261 (95.6 %) 12 (4.4 %) 0.51 (0.26–0.99) 235 (86.4 %) 37 (13.6 %) 1.83 (0.42–7.90)
4–7 61 (51.3 %) 58 (48.7 %) 109 (91.6 %) 10 (8.4 %) 1.02 (0.49–2.11) 104 (88.9 %) 13 (11.1 %) 2.44 (0.56–10.62)
>7 13 (39.4 %) 20 (60.6 %) 25 (75.8 %) 8 (24.2 %) 3.56 (1.50–8.44) 31 (93.9 %) 1 (6.1 %) 1.93 (0.41–9.05)
Handicapping complication
No 609 (69.0 %) 274 (31.0 %) 1 820 (92.8 %) 64 (7.2 %) 1 782 (88.9 %) 17 (1.9 %) 1
Yes 14 (38.9 %) 22 (61.1 %) 3.49 (1.76–6.92) 28 (77.8 %) 8 (22.2 %) 3.66 (1.60–8.36) 27 (75.0 %) 9 (25.0 %) 2.66 (1.21–5.82)
Health Insurance
Yes 511 (69.7 %) 222 (30.3 %) 1 679 (92.6 %) 54 (7.4 %) 1 650 (89.2 %) 79 (10.8 %) 1
No 112 (60.2 %) 74 (39.8 %) 1.52 (1.09–2.12) 168 (90.4 %) 18 (9.6 %) 1.33 (0.76–2.34) 159 (85.0 %) 28 (15.0 %) 1.44 (0.91–2.30)
Women’s education
Completed secondary level and reached university level
141 (65.3 %) 75 (34.7 %) 1 194 (89.8 %) 22 (10.2 %) 1 195 (91.1 %) 19 (8.9 %) 1
Completed primary level 411 (67.8 %) 195 (32.2 %) 1.29 (0.80–2.09) 565 (93.1 %) 42 (6.9 %) 0.82 (0.37–1.81) 527 (87.1 %) 78 (12.9 %) 1.28 (0.64–2.58)
No education 71 (73.2 %) 26 (26.8 %) 1.45 (0.85–2.46) 89 (91.8 %) 8 (8.2 %) 1.26 (0.54–2.94) 87 (89.7 %) 10 (10.3 %) 0.84 (0.37–1.89)
Woman occupation
Employed 437 (67.3 %) 212 (32.7 %) 1 598 (92.0 %) 52 (8.0 %) 1 575 (88.6 %) 74 (11.4 %) 1
Non employed 176 (68.5 %) 81 (31.5 %) 1.05 (0.77–1.43) 238 (92.6 %) 19 (7.4 %) 1.08 (0.63–1.88) 223 (87.8 %) 31 (12.2 %) 0.92 (0.59–1.44)
Infection during pregnancy
No 610 (67.8 %) 290 (32.2 %) 1 836 (92.8 %) 65 (7.2 %) 1 797 (88.9 %) 100 (11.1 %) 1
Yes 13 (68.4 %) 6 (31.6 %) 0.97 (0.36–2.58) 12 (63.2 %) 7 (36.8 %) 7.50 (2.85–19.70) 12 (63.2 %) 7 (36.8 %) 4.64 (1.78–12.08)
Alcohol
No 450 (66.8 %) 224 (33.2 %) 1 616 (91.3 %) 59 (8.7 %) 1 589 (87.5 %) 84 (12.5 %) 1
Yes 172 (70.5 %) 72 (29.5 %) 1.18 (0.86–1.63) 231 (94.7 %) 13 (5.3 %) 1.70 (0.91–3.16) 220 (90.5 %) 23 (9.5 %) 1.36 (0.83–2.21)
Smoking
No 605 (67.5 %) 291 (32.5 %) 1 826 (92.1 %) 71 (7.9 %) 1 790 (88.5 %) 103 (11.5 %) 1
Yes 18 (78.3 %) 5 (21.7 %) 0.57 (0.21–1.57) 22 (95.7 %) 1 (4.3 %) 0.52 (0.07–3.98) 19 (82.6 %) 4 (17.4 %) 1.61 (0.53–4.83)
al.
BMC
Pregnancy
and
Childbirth
(2016) 16:340
Page
10
of
Table 3Good-SRHaand poor-SRHbin relation to background variables. Univariable logistic regression analysiscfor poor-SRH in relation to background variables at three timesd (Continued)
Severe bleeding during pregnancy and labour
No 606 (68.5 %) 279 (31.5 %) 1 821 (92.7 %) 65 (7.3 %) 1 780 (88.3 %) 103 (11.7 %) 1
Yes 17 (50.0 %) 17 (50.0 %) 2.17 (1.09–4.31) 27 (79.4 %) 7 (20.6 %) 3.27 (1.37–7.80) 29 (87.9 %) 4 (12.1 %) 1.04 (0.36–3.03)
Significant blood loss after delivery
No 576 (69.6 %) 252 (30.4 %) 1 772 (93.1 %) 57 (6.9 %) 1 737 (89.3 %) 88 (10.7 %) 1
Yes 47 (51.6 %) 44 (48.4 %) 2.14 (1.38–3.31) 76 (83.5 %) 15 (16.5 %) 2.67 (1.44–4.94) 72 (79.1 %) 19 (20.9 %) 2.21 (1.27–3.83)
Breast feeding
Yes NAf 837 (92.3 %) 70 (7.7 %) 1 798 (88.4 %) 105 (11.6 %) 1
No 4 (66.7 %) 2 (33.3 %) 5.97 (1.07–33.21) 6 (100.0 %) 0 (0.0 %) 000000
Household income per month
> 35,000 RWF 253 (69.7 %) 110 (30.3 %) 1 339 (93.4 %) 24 (6.6 %) 1 333 (91.5 %) 31 (8.5 %) 1
17,500–35,000 RWF 164 (68.6 %) 75 (31.4 %) 1.05 (0.73–1.49) 219 (91.3 %) 21 (8.8 %) 1.35 (0.73–2.49) 208 (87.5 %) 30 (12.6 %) 1.54 (0.91–2.63)
<17,500 RWF 169 (65.5 %) 89 (34.5 %) 1.21 (0.86–1.70) 237 (91.9 %) 21 (8.1 %) 1.25 (0.68–2.30) 218 (85.5 %) 37 (14.5 %) 1.82 (1.09–3.02)
a
Good-SRH (Self-rated health status) includes very good and good health status categories
b
Poor-SRH (Self-rated health status) includes very poor and poor health status categories
c
Univariable logistic regression analysis with calculation of crude odds ratio (OR) and its 95 % confidence interval (CI)
d
Three times post partum: one day, one month after delivery, and at the time of the interview
e
Statistically significant odds ratios are in bold
f
NA: Not applicable
Semasaka
et
al.
BMC
Pregnancy
and
Childbirth
(2016) 16:340
Page
11
of
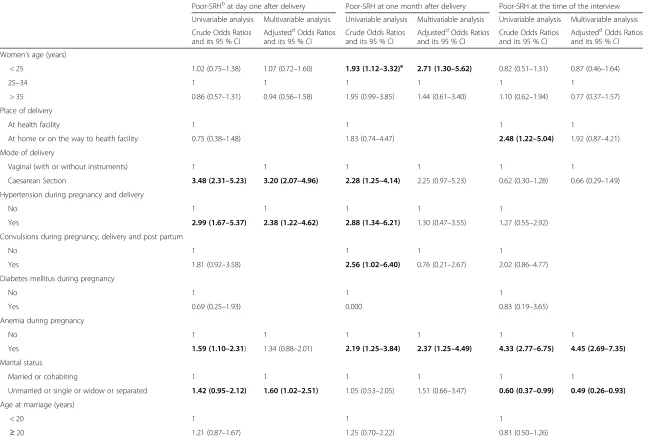
Crude Odds Ratios and its 95 % CI
AdjusteddOdds Ratios
and its 95 % CI
Crude Odds Ratios and its 95 % CI
AdjusteddOdds Ratios
and its 95 % CI
Crude Odds Ratios and its 95 % CI
AdjusteddOdds Ratios
and its 95 % CI
Women’s age (years)
< 25 1.02 (0.75–1.38) 1.07 (0.72–1.60) 1.93 (1.12–3.32)e 2.71 (1.30–5.62) 0.82 (0.51–1.31) 0.87 (0.46–1.64)
25–34 1 1 1 1 1 1
> 35 0.86 (0.57–1.31) 0.94 (0.56–1.58) 1.95 (0.99–3.85) 1.44 (0.61–3.40) 1.10 (0.62–1.94) 0.77 (0.37–1.57)
Place of delivery
At health facility 1 1 1 1
At home or on the way to health facility 0.75 (0.38–1.48) 1.83 (0.74–4.47) 2.48 (1.22–5.04) 1.92 (0.87–4.21)
Mode of delivery
Vaginal (with or without instruments) 1 1 1 1 1 1
Caesarean Section 3.48 (2.31–5.23) 3.20 (2.07–4.96) 2.28 (1.25–4.14) 2.25 (0.97–5.23) 0.62 (0.30–1.28) 0.66 (0.29–1.49)
Hypertension during pregnancy and delivery
No 1 1 1 1 1
Yes 2.99 (1.67–5.37) 2.38 (1.22–4.62) 2.88 (1.34–6.21) 1.30 (0.47–3.55) 1.27 (0.55–2.92)
Convulsions during pregnancy, delivery and post partum
No 1 1 1 1
Yes 1.81 (0.92–3.58) 2.56 (1.02–6.40) 0.76 (0.21–2.67) 2.02 (0.86–4.77)
Diabetes mellitus during pregnancy
No 1 1 1
Yes 0.69 (0.25–1.93) 0.000 0.83 (0.19–3.65)
Anemia during pregnancy
No 1 1 1 1 1 1
Yes 1.59 (1.10–2.31) 1.34 (0.88–2.01) 2.19 (1.25–3.84) 2.37 (1.25–4.49) 4.33 (2.77–6.75) 4.45 (2.69–7.35)
Marital status
Married or cohabiting 1 1 1 1 1 1
Unmarried or single or widow or separated 1.42 (0.95–2.12) 1.60 (1.02–2.51) 1.05 (0.53–2.05) 1.51 (0.66–3.47) 0.60 (0.37–0.99) 0.49 (0.26–0.93)
Age at marriage (years)
< 20 1 1 1
≥20 1.21 (0.87–1.67) 1.25 (0.70–2.22) 0.81 (0.50–1.26)
al.
BMC
Pregnancy
and
Childbirth
(2016) 16:340
Page
12
of
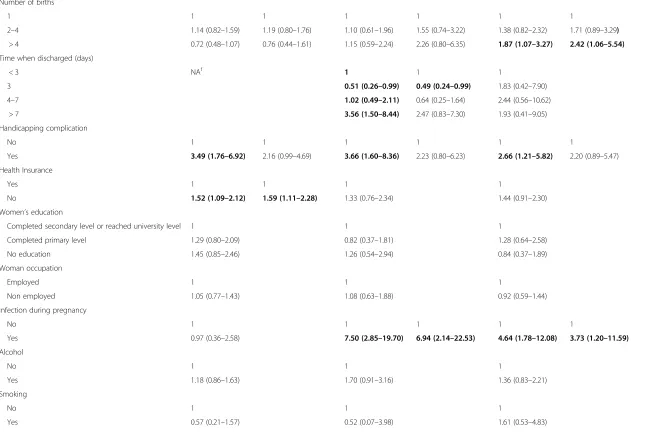
Table 4Univariable and multivariable and logistic regression analysisaof poor-SRHbat three times post partumc(Continued)
Number of births
1 1 1 1 1 1 1
2–4 1.14 (0.82–1.59) 1.19 (0.80–1.76) 1.10 (0.61–1.96) 1.55 (0.74–3.22) 1.38 (0.82–2.32) 1.71 (0.89–3.29)
> 4 0.72 (0.48–1.07) 0.76 (0.44–1.61) 1.15 (0.59–2.24) 2.26 (0.80–6.35) 1.87 (1.07–3.27) 2.42 (1.06–5.54)
Time when discharged (days)
< 3 NAf 1 1 1
3 0.51 (0.26–0.99) 0.49 (0.24–0.99) 1.83 (0.42–7.90)
4–7 1.02 (0.49–2.11) 0.64 (0.25–1.64) 2.44 (0.56–10.62)
> 7 3.56 (1.50–8.44) 2.47 (0.83–7.30) 1.93 (0.41–9.05)
Handicapping complication
No 1 1 1 1 1 1
Yes 3.49 (1.76–6.92) 2.16 (0.99–4.69) 3.66 (1.60–8.36) 2.23 (0.80–6.23) 2.66 (1.21–5.82) 2.20 (0.89–5.47)
Health Insurance
Yes 1 1 1 1
No 1.52 (1.09–2.12) 1.59 (1.11–2.28) 1.33 (0.76–2.34) 1.44 (0.91–2.30)
Women’s education
Completed secondary level or reached university level 1 1 1
Completed primary level 1.29 (0.80–2.09) 0.82 (0.37–1.81) 1.28 (0.64–2.58)
No education 1.45 (0.85–2.46) 1.26 (0.54–2.94) 0.84 (0.37–1.89)
Woman occupation
Employed 1 1 1
Non employed 1.05 (0.77–1.43) 1.08 (0.63–1.88) 0.92 (0.59–1.44)
Infection during pregnancy
No 1 1 1 1 1
Yes 0.97 (0.36–2.58) 7.50 (2.85–19.70) 6.94 (2.14–22.53) 4.64 (1.78–12.08) 3.73 (1.20–11.59)
Alcohol
No 1 1 1
Yes 1.18 (0.86–1.63) 1.70 (0.91–3.16) 1.36 (0.83–2.21)
Smoking
No 1 1 1
Yes 0.57 (0.21–1.57) 0.52 (0.07–3.98) 1.61 (0.53–4.83)
Semasaka
et
al.
BMC
Pregnancy
and
Childbirth
(2016) 16:340
Page
13
of
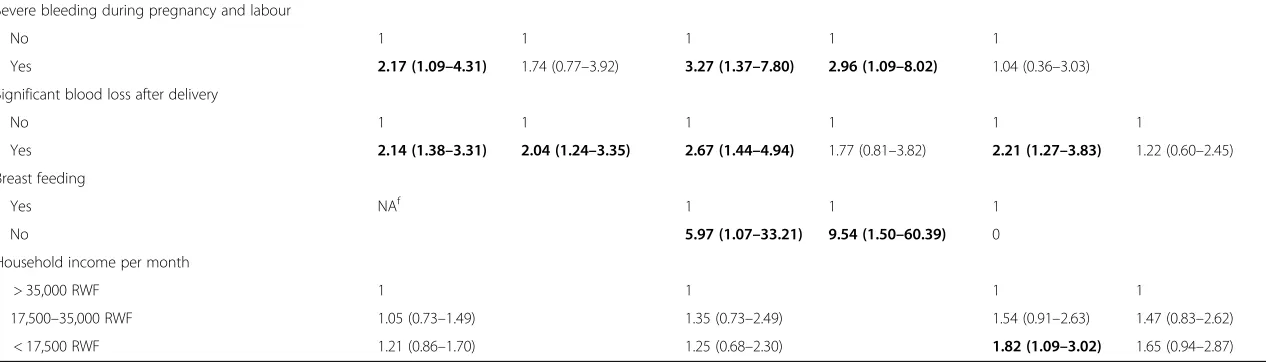
Yes 2.17 (1.09–4.31) 1.74 (0.77–3.92) 3.27 (1.37–7.80) 2.96 (1.09–8.02) 1.04 (0.36–3.03)
Significant blood loss after delivery
No 1 1 1 1 1 1
Yes 2.14 (1.38–3.31) 2.04 (1.24–3.35) 2.67 (1.44–4.94) 1.77 (0.81–3.82) 2.21 (1.27–3.83) 1.22 (0.60–2.45)
Breast feeding
Yes NAf 1 1 1
No 5.97 (1.07–33.21) 9.54 (1.50–60.39) 0
Household income per month
> 35,000 RWF 1 1 1 1
17,500–35,000 RWF 1.05 (0.73–1.49) 1.35 (0.73–2.49) 1.54 (0.91–2.63) 1.47 (0.83–2.62)
< 17,500 RWF 1.21 (0.86–1.70) 1.25 (0.68–2.30) 1.82 (1.09–3.02) 1.65 (0.94–2.87)
a
Univariable logistic regression analysis with calculation of crude odds ratio (OR) and its 95 % confidence interval (CI)
b
Poor-SRH (Poor self-rated health status) includes very poor and poor health status categories and Good-SRH (Good self-rated health status) includes very good and good health status categories
c
Three post partum times: one day, one month after delivery, and at the time of the interview
d
Adjusted Odds Ratios for women’s age, number of births, mode of delivery, and marital status
e
Statistically significant odds ratios are in bold
f
NA: Not applicable
al.
BMC
Pregnancy
and
Childbirth
(2016) 16:340
Page
14
of
severe bleeding during pregnancy and labour (OR = 3.60, CI = 1.56–8.31), hypertension during pregnancy and de-livery (OR = 2.21, CI = 1.06–4.60), significant postpartum haemorrage (OR = 2.01, CI = 1.12–3.58), woman’s age less than 25 years (OR = 1.71, CI = 1.05–2.80), and discharge time more than seven days postpartum (OR = 2.81, CI = 1.18–6.66).
Self-rated overall health status at one month postpartum In the univariable logistic regression, anaemia and in-fection during pregnancy, caesarean section, severe bleeding during pregnancy and labour, significant postpartum haemorrage, and handicapping complica-tion (i.e., postpartum fistula or fecal and urinary incontinance) were associated with poor-SRH at one month postpartum (Table 3). In the multivariable logis-tic regression model, anaemia and infection during pregnancy, breastfeeding, severe bleeding during preg-nancy and labour, and age less than 25 years were sig-nificantly associated with poor-SRH. Being discharged at third day postpartum was protective for reporting poor health at one month postpartum (OR = 0.49, CI = 0.24–0.99; ref.: discharge time before three days post-partum) (Table 4).
Self-rated overall health status at time of interview
For SRH at time of interview, the univariable logistic re-gression revealed an association with poor-SRH and place of delivery (i.e., at home or on the way to the health facility), anaemia and infection during pregnancy, handicapping complication (i.e., postpartum fistula or fecal and urinary incontinence), multiparity, and marital status (Table 3). In the multivariable analysis, multiparity was associated with poor-SRH at the time of interview (Table 4).
Poor self-rated overall health at several times
For SRH at one day and one week postpartum, the multi-variable logistic regression model revealed an association with poor-SRH and caesarean section, hypertension during pregnancy and delivery, and significant postpartum hae-morrage. Severe bleeding during pregnancy and labour was associated with poor-SRH at one week and one month postpartum. Infection and anaemia during pregnancy were associated with poor-SRH at one month postpartum (OR = 7.15, CI = 2.17–23.50 and OR = 2.32, CI = 1.22–4.38, respectively) and at the time of the interview (OR = 3.36, CI = 1.17–11.56) and OR = 4.48, CI = 2.78–7.21, respect-ively) (Table 4).
Discussion
This study found that approximately one-third of de-livered women reported poor-SRH at one day post-partum. Participants’ overall health status generally
improved during the following year postpartum. Back-ground factors such as marital status, age at marriage, education, occupation, smoking, and use of alcohol were not determinants of poor-SRH during the whole postpartum period. This study estimated the preva-lence of poor-SRH to be 32.2 % at one day, 7.8 % at one month, and 11.2 % at the time of the interview. The most plausible explanation of the increase of poor-SRH from one month postpartum to the time of interview is that women may have developed new health problems during their postpartum year. It is difficult to compare findings of this study with previ-ous studies that have estimated poor health status at different times postpartum, as they have reported prevalences in the range of 4 % to 15 % between one and two years postpartum [18, 27, 28]. Nevertheless, we consider our poor-SRH prevalence at one day as comparatively high in the light of these previous studies.
Hypertension during pregnancy and delivery and significant postpartum haemorrhage were associated with poor-SRH at one day and one week postpartum, and severe bleeding during pregnancy and delivery were associated with poor-SRH at one week and one month postpartum. These findings are consistent with the lit-erature that have identified these factors to be important determinants of poor-SRH during the early postpartum period [27, 29, 30].
There are differing results on the impact of caesarian section on poor health status postpartum; in some stud-ies poor health status at early postpartum is associated with caesarean section, [10, 31], whereas others have not found any association [27, 32]. Our study showed caesar-ean section to be associated with poor-SRH at one day and one week after the operation.
The only sociodemographic factor that was associated with poor-SRH at one week and one month postpartum was age less than 25 years in relation to age 25 to 34 years. Similar results have also been shown in other studies [5, 33]; these results might be explained by the fact that young mothers are often more emotionally and physically vulnerable [5]. Low level of education was not found to be associated with poor-SRH in our study although other studies report it as a predictor of poor health status postpartum [5, 10]. In Rwanda, utilization rate of maternal services before and during delivery is very high [23]. Both women with low and high levels of education have the same access to maternal health services including CHWs’ support in the community, thus pregnant women’s access is the same irrespective of educational levels [24, 34].
In this study, multiparity was associated with poor-SRH at the time of the interview, a finding consistent with other studies that report multiparity to be
associated with postpartum poor health status [15, 17]. Multiparity constitutes the potential risks of pregnancy and postpartum adverse outcomes [15].
Rwandan women who have experienced an uncompli-cated delivery at a health facility are commonly dis-charged one to three days postpartum [23]. In our study, discharge on the third day postpartum in relation to dis-charge before three days was found to be protective of poor-SRH at one month postpartum. These results are coherent with the WHO recommendations to discharge women three days after giving birth [35]. Facility-based health care provided during the early postpartum period may have a positive effect on women’s overall health status during the whole postpartum period.
Previous studies performed in low and middle income countries have found pregnancy-related factors such as anaemia and infection during pregnancy associated with health problems several months postpartum [27, 29]. In our study, the main determinants of postpartum poor-SRH after one month were anaemia and infection during pregnancy.
Methodological considerations
One strength of this study is that almost all households and women selected were reached and consented to participate in the study. We consider the sample to be representative of the population under study. Another strength of this study was that female nurses, midwives, and clinical psychologists were used as interviewers in order to make female participants confident enough to respond. The representativity of this study undertaken in the Northern Province and Kigali is also supported by the fact that the data obtained for prevalence rates of ANC use, delivery at health facility, caesarean section, and postpartum care attendance were very similar to data available on maternal services delivery and use in Rwanda in the latest published Demographic Health Survey (DHS) 2014–15 results [23]. Recall bias may have been an issue since data were collected retrospectively, although previous studies have shown that recall bias is not a major issue when women are recalling their repro-ductive history [36, 37]. Another issue is that there may be underreporting or overreporting of some health con-ditions. In this study, the average time between the date of the interview and the date of the latest delivery was 7.1 months with a range of 1.4-14.3 months. This means that the time of interview for all participants corre-sponds to a wide time interval. Therefore, the results are influenced by the fact that some participants were inter-viewed at an early time point during the postpartum period when the health problems were still prevalent, whereas other participants were interviewed at a later time point when their health problems could have been resolved.
Conclusions
This study reports a high prevalence of poor SRH among Rwandan women in the early postpartum period. Infection, anaemia, hypertension, and severe bleeding during pregnancy and significant postpartum haemor-rhage were the main determinants of poor-SRH during postpartum. Discharge time at third day postpartum in relation to discharge before three days postpartum de-creased the risk of reporting poor-SRH at a later time. These incriminated determinants of poor-SRH are preg-nancy and delivery-related factors, factors that may be prevented or reduced by more frequent and particular attention during pregnancy. Timely measures should be undertaken to deal with complications during delivery and early postpartum. The simple SRH status measure-ment can be used to identify determinants of poor health status. Further research is warranted to determine whether SRH inquiry may be used during antenatal care and postnatal care visits to screen for health problems and pregnancy complications related to poor health status postpartum.
Acknowledgements
Our sincere thanks go to the participating Rwandan women. We also thank Anni-Maria Pulkki-Brännström and Anna Dencker for their helpful contribution to this study. We also thank the Swedish International Development Agency (SIDA) for funding, the University of Rwanda for logistic support, and Umeå University for overall support.
Funding
This study was conducted as part of first author’s PhD studies which was sponsored by the Swedish International Development Agency (SIDA). SIDA didn’t play any role in the study design, data collection, data analysis and interpretation of data or in the writing of the manuscript.
Availability of data and materials
The datasets used and analyzed during the current study will be available from the corresponding author upon receiving a reasonable request.
Authors’contributions
All authors participated in the design of the study and the construction of the study tools. All authors contributed to the drafting of the manuscript. JPSS participated in data collection in the field in collaboration with MN and CM. JPSS performed the data analysis under supervision of IM. JPSS wrote the manuscript under supervision of IM and in collaboration with all other authors. All authors read and approved the final version of the manuscript.
Competing of interests
The authors declare that they have no competing interests.
Consent for publication Not applicable.
Ethics approval and consent to participate
Author details
1Department of Clinical Sciences, Obstetrics and Gynecology, Umeå
University, Umeå, Sweden.2University of Rwanda College of Medicine and
Health Sciences School of Public Health, Kigali, Rwanda.3Department of Community Medicine and Public Health, Sahlgrenska Academy, University of Gothenburg, Gothenburg, Sweden.4Judith Lumley Centre, La Trobe
University, Melbourne, Australia.
Received: 18 February 2016 Accepted: 30 October 2016
References
1. Fayers PM, Sprangers MA. Understanding self-rated health. Lancet. 2002; 359(9302):187–18.
2. Chandola T, Jenkinson C. Validating self-rated health in different ethnic groups. Ethn Health. 2000;5(2):151–9.
3. Idler E, Angel R. Self-rated health and mortality in the NHANES-1 epidemiologic follow-up. Am J Public Health. 1998;80(4):446–52. 4. Miilunpalo S, Vuori I, Oja P, Pasanen M, Urponen H. Self-rated health status
as health measure: the predictive valua of self-reported health status on the use of physician services and on mortality in the working-age population. J Clin Epidemiol. 1997;50(5):517–28.
5. Schytt E, Waldenstrom U. Risk factors for poor self-rated health in women at 2 months and 1 year after childbirth. J Womens Health. 2007;16(3):390–405. 6. Fottrell E, Kanhonou L, Goufodji S, Behague DP, Marshall T, Patel V, Filippi V.
Risk of psychological distress following severe obstetric complications in Benin: the role of economics, physical health and spousal abuse. Br J Psychiatry. 2010; 196(1):18–25.
7. Sedgh G, Singh S, Hussain R. Intended and unintended pregnancies worldwide in 2012 and recent trends. Stud Fam Plann. 2014;45(3):301–14. 8. Khan KS, Wojdyla D, Say L, Gulmezoglu AM, Van Look PF. WHO analysis of
causes of maternal death: a systematic review. Lancet. 2006;367(9516):1066–74. 9. Albers LL. Health problems after childbirth. J Midwifery Womens Health.
2000;45(1):55–7.
10. Schytt E, Hildingsson I. Physical and emotional self-rated health among Swedish women and men during pregnancy and the first year of parenthood. Sex Reprod Healthc. 2011;2:57–64.
11. Gjerdinen D, Froberg D, Chaloner K, McGovern P. Changes in women’s physical health during the first postpartum year. Arch Fam Med. 1993;2(3):277–83.
12. Waterstone M, Wolfe C, Hooper R, Bewley S. Postnatal morbidity after childbirth and severe obstetric morbidity. BJOG. 2003;110(2):128–33. 13. Saurel-Cubizolles MJ, Romito P, Lelong N, Ancel PY. Women’s health after
childbirth: a longitudinal study in France and Italy. Br J Obstet Gynaecol. 2000;107:1202–9.
14. Mohan D, Gupta S, Lefevre A, Bazant E, Killewo J, Baqui HA. Determinants of postnatal care use at health facilities in rural Tanzania: multilevel analysis of a household survey. BMC Pregnancy Childbirth. 2015;15:282.
15. Alsammani AM, Ahmed SR. Grand multiparity: risk factors and outcome in a tertiary hospital: a comparative study. Mater Sociomed. 2015;27(4):244–7. 16. Webb D, Bloch J, Coyne J, Chung E, Bennet I, Culhane J: Postpartum
Physical Symptoms in New Mothers: Their Relationship to Functional Limitations and Emotional Well-being. Birth 2008;35(3). doi:10.1111/j.1523-536X.2008.00238.x.
17. Henderson J, Redshaw M: Who is Well After Childbirth? Factors Related to Positive Outcome. BIRTH 2013, 40(1):1-9.
18. Morgan KJ, Eastwood JG: Social determinants of maternal self-rated health in South Western Sydney, Australia. BMC Research. 2014;7(51). doi:10.1186/ 1756-0500-7-51.
19. WHO. Rwanda maternal and perinatal country profile. 2014;40(1):1-9. 20. Health RMo. Rwanda annual health statistics booklet 2014. 2015. 21. Condo J, Mugeni C, Naughton B, Hall K, Tuazon MA, Omwega A, Nwaigwe
F, Drobac P, Hyder Z, Ngabo F, et al. Rwanda’s evolving community health worker system: a qualitative assessment of client and provider perspectives. Hum Resour Health. 2014;12:71.
22. (NISR) NIoSoR, (MOH) RMoH, International I. Rwanda demographic and health survey 2010. 2012.
23. Rwanda NIoSo, (MOH) RMoH, International I. Rwanda demographic and health survey 2015. 2015.
24. Health RMo. National community health policy 2008. 2008.
25. Nathan LM, Shi Q, Zhang C, Nsabimana D, Skalr M, Mutimura E, Merkatz IR, Einstein MH, Anastos K. Decentralizing maternal services to increase skilled attendance at birth and antenatal care utilization in rural rwanda: a prospective cohort study. Matern Child Health J. 2015; 19:1945–55.
26. National Institute of Statistics of Rwanda (NISR) MoFaEPMR. Fourth rwanda population and housing census. 2012.
27. Kabakian-Khasholian T, Shayboub R, Ataya A. Health after childbirth: patterns of reported postpartum morbidity from Lebanon. Women Birth. 2014;27(1):15–20.
28. Molarius A, Berglund K, Eriksson C, Lambe M, Nordstrom E, Eriksson HG, Feldman I. Socioeconomic conditions, lifestyle factors, and self-rated health among men and women in Sweden. Eur J Public Health. 2007; 17(2):125–33.
29. Brown S, Lumley J. Maternal health after childbirth: results of an Australian population based survey. Br J Obstet Gynaecol. 1998;105(2):156–61. 30. Seck SM, Diop-Dia A, Dia DG, Gueye L. Prevalence of hypertension and
assessment of its impact on self-rated health in rural populations: a cross-sectional study in northern Senegal. Med Sante Trop. 2015;25(2):160–4. 31. Rowlands IJ, Redshaw M. Mode of birth and women’s psychological
and physical wellbeing in the postnatal period. BMC Pregnancy Childbirth. 2012;12:138.
32. Borders N. After the afterbirth: a critical review of postpartum health relative to method of delivery. J Midwifery Womens Health. 2006;51(4):242–8. 33. Moum T. Self-assessed health among Norwegian adults. Soc Sci Med. 1992;
35(7):935–47.
34. Manzi A, Munyaneza F, Mujawase F, Banamwana L, Sayinzoga F, Thomson DR, Ntaganira J, Hedt-Gauthier BL. Assessing predictors of delayed antenatal care visits in Rwanda: a secondary analysis of Rwanda demographic and health survey 2010. BMC Pregnancy Childbirth. 2014;14:290.
35. WHO. Who technical consultation on postpartum and postnatal care. 2010. 36. Radin RG, Rothman KJ, Hatch EE, Mikkelsen EM, Sorensen HT, Riis AH, Fox
MP, Wise LA. Maternal recall error in retrospectively reported time-to-pregnancy: an assessment and bias analysis. Paediatr Perinat Epidemiol. 2015;29(6):576–88.
37. Casey VA, Dwyer JT, Coleman KA, Krall EA, Gardner J, Valadian I. Accuracy of recall by middle-aged participants in a longitudinal study of their body size and indices of maturation earlier in life. Ann Hum Biol. 1991;18(2):155–66.
38. WHO. Putting women first: ethical and safety. Recommendations for research on domestic violence against women. Geneva: Global program on evidence for health policy; 1999.
• We accept pre-submission inquiries
• Our selector tool helps you to find the most relevant journal
• We provide round the clock customer support
• Convenient online submission
• Thorough peer review
• Inclusion in PubMed and all major indexing services • Maximum visibility for your research
Submit your manuscript at www.biomedcentral.com/submit