Difference in the initial slopes of the
P
-wave envelope waveforms of the main
shock M7.4 and foreshock M7.1 of the 2004 off the Kii peninsula earthquakes
Toshikazu Odaka, Hiromitsu Nakamura, and Kimitoshi Ashiya
Disaster Prevention Technology Division, Railway Technical Research Institute, Hikari-cho 2-8-38, Kokubunji-shi, Tokyo 185-8540, Japan
(Received November 29, 2004; Revised February 17, 2005; Accepted April 6, 2005)
We made a close investigation about the initial rising slopes of the envelope waveforms of theP-wave ground motion by using data for recent earthquakes. We have found that the P-wave initial slopes decrease almost linearly with increasing epicentral distance over the wide range of distance. This linear relation looks to be independent of the earthquake magnitudes and focal depths though the dispersion of data is somewhat large. We have found that the P-wave initial slopes of the foreshock M7.1 of the 2004 off the Kii peninsula earthquakes are very sharp. To the contrary, the slope of the main shock M7.4 is quite gentle. The main shock was preceded by a small event that occurred about 6.7 seconds before the main shock. This pre-event was generated near the initiation point of the main fracture. We are speculating that the difference in the initial slope between the foreshock and main shock may reflect the difference in the time variation of the stress drop at the early stage of the fracture and that the small pre-shock may be responsible for the slow rising of the initialP-wave motion of the main shock.
Key words: P-wave initial slope, envelope waveform, logarithmic waveform, off the Kii peninsula earthquake, pre-event.
1.
Introduction
We found that the initial rising slopes of the P-wave en-velope waveform of vertical ground acceleration were in-versely proportional to the epicentral distances of earth-quakes (Odaka et al., 2003; Tsukada et al., 2004). This linear relation was confirmed for the seismic wave data of different earthquake catalogs and we found that the rela-tion held true regardless of the earthquake magnitudes and depths though the scatter of plotted data was somewhat large. By using this relation, we can roughly estimate an epicentral distance nearly immediately after theP-wave ar-rival. The magnitude estimation is possible from the maxi-mum amplitude observed within a given short time interval after theP-wave arrival. We have developed a new type of earthquake early detection and warning system on the basis of this principle (Odakaet al., 2004).
The decrease in the initialP-wave slope with increasing traveling distance may be caused by the attenuation, scatter-ing and geometrical spreadscatter-ing of waves durscatter-ing propagation. Tsukadaet al.(2004) showed the importance of the effect of wave scattering by means of numerical experiment. The stress drop on the occasion of the fault generation may be another important factor that affects the initial slope (rate of the increase in amplitude) of P waves. Theoretically, indeed, the P-wave amplitude (waveform) varies depend-ing upon the time history of the stress drop durdepend-ing the fault generation.
We make a close investigation about the P-wave initial
Copy right cThe Society of Geomagnetism and Earth, Planetary and Space Sci-ences (SGEPSS); The Seismological Society of Japan; The Volcanological Society of Japan; The Geodetic Society of Japan; The Japanese Society for Planetary Sci-ences; TERRAPUB.
slope by using the wave data for recent earthquakes in order to establish decisively the relationship between the slope and the epicentral distance. In addition, we make a detailed research of the latest large earthquake, the 2004 off the Kii peninsula earthquake M7.4, and its foreshock and af-tershocks because theP-wave initial slopes of these earth-quakes vary much depending upon respective earthearth-quakes. This suggests that the fracture may be initiated in the differ-ent manner for each earthquake.
2.
Calculation of
P-wave Initial Slope
We evaluate theP-wave initial slope (the rate of increase in amplitude of P-wave in its very beginning) as follows. First, we make a non-negative waveformy(t)by taking ab-solute values of original waveformx(t). Next we construct the envelope waveformz(t)ofy(t). The envelopez(t)is, in the present study, simply constructed by retaining the pre-vious maximum amplitude (that is, z(t) = max of y(s), where 0<s≤t) at every sampling timet. Then we try to fit the following function f(t)to the envelopez(t).
f(t)=Bt·exp(−At). (1)
The origin of timet is taken at P-wave arrival time. The unknown parameters Aand B are determined in terms of the least-squares method by taking the logarithm of Eq. (1). To avoid minus infinity (log 0) in the computation, we add a small value to the zero acceleration. The parameterB de-fines the slope of the initial part of theP-wave envelope and the parameter Arepresents a long-period amplitude varia-tion with time. WhenAis positive,B/(Ae)gives the max-imum amplitude whereemeans the base of natural loga-rithm. This case is typical of small earthquakes,
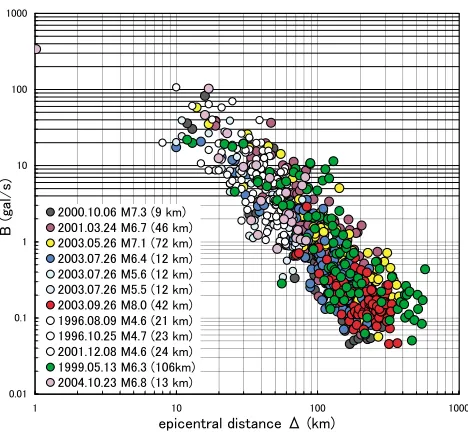
Fig. 1. Relationship between the coefficientB(gal/sec) and the epicentral distance(km).
ing that the initial amplitude increases sharply and decays quickly soon after theP-wave arrival. When Ais negative, the amplitude increases exponentially with time. This is a characteristic of large earthquakes.
This paper aims to establish the linear relation between the initial rising slopes of the P-wave envelope waveform and the epicentral distances of earthquakes that was found by Odakaet al.(2003). We add new earthquake data includ-ing the magnitude 8 earthquake and we make more careful analysis over the wider range of epicentral distance than in the previous investigation. In Odakaet al.(2003), the arrival of P waves was mechanically identified at a point where the wave amplitude exceeded some level assigned by the preceding noise level. This was because we intended to apply this method to developing new earthquake early detection and warning systems and we had to execute auto-matic data processing in real systems. The autoauto-matic read-ing of the P-wave arrival induced an error for estimating the initial slope of P waves especially for farther stations of which amplitude became smaller. In the present study, we read the arrival ofPwaves by eye. In order to make the reading of theP-wave arrival reliable, we use the wave data of which noise level is roughly lower than 0.05 gal except-ing the waves with quite sharp initial risexcept-ing.
We have used the strong-motion (Kyoshin) network (K-NET) data that are made open to the public by the National Research Institute for Earth Science and Disaster Preven-tion (NIED) (Kinoshita, 1998). The net covers all over Japan and the observation stations are densely distributed. All the calculation was made for the vertical (UD) compo-nent accelerograms. The time window width of the calcu-lation is 3 seconds from the P-wave arrival. Odaka et al. (2003) recommend to use 2- or 3-seconds window for the analysis of earthquakes with magnitudes roughly equal to or larger than M5 from the result of their numerical experi-ment.
Figure 1 shows the parameter B (P-wave initial slope)
plotted against the epicentral distance. Calculation was made for large earthquakes that occurred recently in Japan. They are the 2000 Western Tottori earthquake M7.3 (depth 9 km), the 2001 Geiyo earthquake M6.7 (46 km), the 2003 Off Miyagi Prefecture earthquake M7.1 (72 km), the 2003 Northern Miyagi Prefecture earthquake M6.4 (12 km) and the 2003 Off Tokachi earthquake M8.0 (42 km). In addi-tion, for reference sake, we add some relatively small and deep earthquakes. They are the 1996–2001 Yamanashi-Kanagawa Border earthquakes M4.6 (depth 21 km), M4.7 (24 km) and M4.6 (24 km), the 1999 Kushiro earthquake M6.3 (106 km) and the foreshock and aftershock of the 2003 Northern Miyagi Prefecture earthquake, M5.6 (12 km) and M5.5 (12 km). Further, we add the latest large earth-quake, the 2004 Niigata Chuetsu earthquake M6.8 (depth 13 km). Our plot for the latest earthquake is limited to some stations not far away from the epicenter. The number of the data that are plotted are 820 in total. The magnitudes and depths are those determined by the Japan Meteorological Agency (JMA). The data for epicentral distances are taken from the K-NET web site of the NIED.
It is clear that B values decrease almost linearly with increasing epicentral distance over the wide range of dis-tance. They look to be independent of the magnitude and focal depth. We can obtain a regression line for the rela-tionship between logBand logfrom this data set by the least-squares method. We may call this linear relation as the standard B-relation. Once we evaluate a value ofB from observed wave motion, we can immediately estimate an epicentral distance via thisB-relation. Judging from the scatter of the data in the figure, we can expect that an es-timated distance may roughly lie in the range between half and twice the correct distance. This accuracy may be ac-ceptable when we consider that the estimation is performed within a quite short time, say, 3 seconds, after theP-wave arrival. The vertical spread of the distribution ofB values may become large in the B- plot as the data plotted in-crease. Even so, the above B-relation may not change so much because the data plotted near the central zone may also increase.
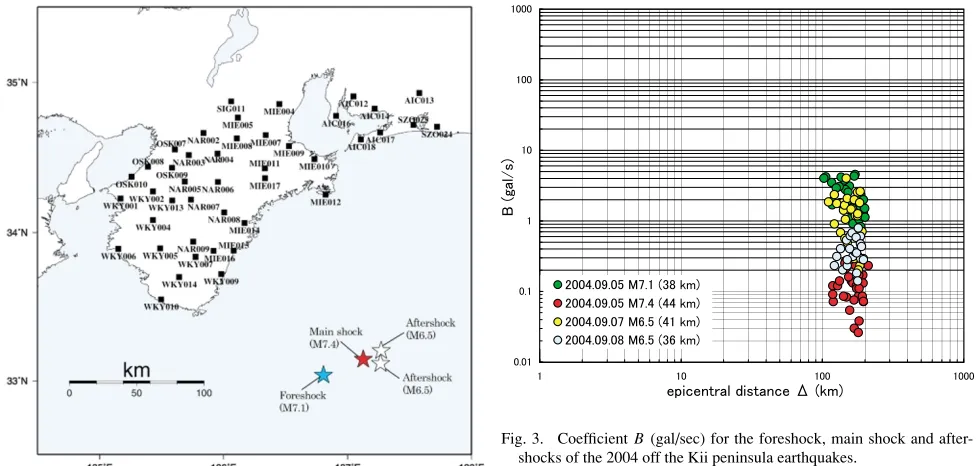
Fig. 2. Map showing epicenters of the 2004 off the Kii peninsula earth-quakes and the K-NET sites used for the analysis.
3.
2004 Off the Kii Peninsula Earthquake
We have analyzed the P-wave initial slopes of the verti-cal envelope waveforms observed at the K-NET stations in association with the foreshock M7.1 (depth 38 km), main shock M7.4 (44 km) and two aftershocks, M6.5 (41 km) and M6.5 (36 km), of the 2004 off the Kii peninsula earth-quakes. The magnitudes and depths are those determined by the JMA. Figure 2 shows the location map of the sites and earthquakes that we used for the analysis. The sites are located roughly between 100 km and 200 km in epicentral distance. In order to make the reading of the P-wave ar-rival reliable, we use the wave data of which noise level is roughly lower than 0.05 gal excepting the data with quite sharp initial rising. The P-wave arrival is read by eye and the time window width (data length) is 3 seconds from the P-wave arrival.
Figure 3 shows the coefficient Bplotted against the epi-central distance. From Fig. 3 and Fig. 1, we find that theB values associated with the foreshock M7.1 are fairly large compared with those of other earthquakes. To the contrary, the B values of the main shock are quite small compared especially with those of the foreshock. The foreshock oc-curred 4 hours and 50 minutes prior to the main shock. The Bvalues of the two aftershocks are distributed in between. The clustering of respective B values is clear. It may be difficult to explain this difference by the change of the ef-fect of scattering (change of the scattering property in the medium) with time because the observation sites are widely distributed. As we mention in the previous section, it may be more plausible that the difference of the overallBvalues is caused by the difference in the source process, that is, the difference of the time variation of the stress drop at the ini-tial stage of the fracture. The main shock may be initiated with quite low stress drop. Figure 3 suggests that the stress drop of the main shock may be an order of magnitude lower
Fig. 3. CoefficientB(gal/sec) for the foreshock, main shock and after-shocks of the 2004 off the Kii peninsula earthquakes.
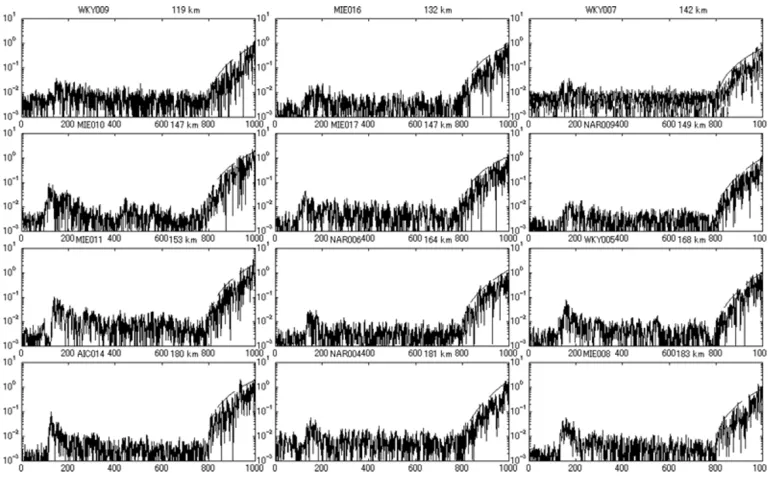
than that of the foreshock at the initial stage of the fracture. In Fig. 4, we compare the UD (vertical component) wave-forms of theP-wave initial part for the foreshock (lower 6 graphs) and the main shock (upper 6 graphs). The figure displays the noise portion 0.5 second (50 samplings) and the P-wave initial portion 1.5 seconds (150 samplings) in logarithmic scale. The P-wave arrival is set att = 50 (in units of 0.01 second). The dashed (superimposed) curves indicate the fitting curves obtained by Eq. (1) for respective logarithmic waveforms. We can recognize that the fitting curves well represent the respective envelope waveforms. The observation sites are the same for both earthquakes and the epicentral distance is shown at each graph. It is clear that the initial rising slopes of thePwaves of the both earth-quakes are entirely different. The slopes of the foreshock are quite sharp. On the other hand, the main shock begins with quite gentle rising-slope. This difference may indicate that the two events start in different ways. We believe that the overall difference in the initial slope of the Pwaves re-flects the difference in the time history of the stress drop at the early stage of the fracture.
Fig. 4. Comparison of the logarithmic waveforms of the foreshock M7.1 and main shock M7.4. The unit of the ordinate is gal (=cm/sec2) and that of the abscissa is 0.01 second respectively. TheP-wave arrival is set att=50.
Fig. 5. Logarithmic waveforms that include the main shock and the small pre-shock that occurred about 7 seconds prior to the main shock. The unit of the ordinate is gal and that of the abscissa is 0.01 second respectively. TheP-wave arrival is set att=800.
between the pre-event and the main shock is 6.71, 6.71, 6.89 and 6.68 seconds respectively for 4 stations. These values agree within a difference of 0.21 seconds. Considering from this result and the source-station geometry in Fig. 2, we may say that the small fracture had been initiated at the point only a little (maybe an order of 1 km) westward from the hypocenter of the main shock about 6.7 seconds before the
main fracture started. We think that this small fracture may have caused the initiation of the main fracture and it may be responsible for the slow rising of the initialP-wave motion of the main shock.
amplitude of the UD component of the Pwaves is roughly 0.5 to 2.5 gals at the stations = 120 to 190 km. On the other hand, the amplitude of the above small pre-event is 0.02 to 0.1 gals as read from Fig. 5 and this amplitude is one or two order of magnitude smaller than that of the M4.6 event. Hence, we can roughly estimate the magnitude of the pre-event to be 2.5 to 3.5. This pre-event, however, does not seem to be captured by the routine seismic observation network in Japan. For reference, we estimate the coefficient B for the small pre-event with the same manner as for the main shock and foreshock. It is estimated to be 0.36, 0.1, 0.3 and 0.19 (in units of gal/s) respectively for the above four stations. Referring to Fig. 3, we find that these values are almost similar to those of the main event. However, as Odakaet al. (2003) mentioned in their paper, the time window width of 3 seconds is too long for a M4 or smaller class of earthquakes because the duration of the P-pulses of these class earthquakes may be far shorter than that. The above B values may be underestimated by the averaging effect (the effect of the coefficient A). When we evaluate the coefficient B by using the window width 0.5 second, then we have 1.21, 0.25, 0.49 and 0.48 (gal/s) respectively for four stations.
4.
Summary and Discussion
We have found that the rising slope of the initial part of the P-wave envelope waveform decreases almost linearly with increasing epicentral distance over the wide range of distance and that this linear relation looks to be indepen-dent of the earthquake magnitude and focal depth. There is a lot of work that has been done on the initiation of earth-quakes or the initial rising slopes of P waves (e.g., Iio, 1992; Ellsworth and Beroza, 1995; Mori and Kanamori, 1996). Our approach to the P-wave initial slope is entirely different from them and the vertical spread of the data is somewhat large. Our result seems to be consistent with the result of Mori and Kanamori (1996), although the magni-tude range and the wave type they investigated were differ-ent from ours. They mdiffer-ention that the shape of the initiation of the velocity waveforms is independent of the magnitude of the earthquake. However, our analysis is based on the acceleration seismograms characterized by relatively high noise level and thus we are presumably looking at the sud-den increase in the P-wave amplitude after the slow initial phase (Iio, 1992) or the seismic nucleation phase (Ellsworth and Beroza, 1995).
The P-wave initial slope of the foreshock M7.1 of the 2004 off the Kii peninsula earthquakes is very sharp. To the contrary, the main shock M7.4 began with quite slow initial rising. The main shock was preceded by a small event that had occurred about 6.7 seconds prior to it at the point very close to the hypocenter of the main shock. We think that this small fracture may have caused the initiation of the main fracture and it may be responsible for the slow rising of the initial P-wave motion of the main shock. The stress drop
on the occasion of the fault generation may be an important factor that affects theP-wave initial slope.
As demonstrated in Figs. 3 and 4, there are earthquakes whose rising slopes of the initialPwaves are systematically different from others. In some earthquakes, the distribution ofBvalues deviates much from our standardB-relation. We expect the origin of the anomalous deviation may pri-marily lie in the unusual source process. At present, we do not have any idea about why the foreshock of the 2004 off the Kii peninsula earthquakes has quite sharp initial rising. The Bvalues of the foreshock M5.6 of the 2003 Northern Miyagi Prefecture earthquake M6.4 are rather small (exhib-ited in Fig. 1). We know only a small number of earth-quakes that really show anomalousB-value distribution. At present, we cannot answer the question “what factors (type of earthquakes, source depth, physical condition at a source, etc) characterize the anomalous initialP-wave rising”. The focal depth may, more or less, affect it. However, this is not the case for the 2004 off the Kii peninsula earthquakes. This problem is left for the future.
Park and Mori (2005) examined the spatial and tempo-ral relationships of the sequence of the 2004 off the Kii peninsula earthquakes. They regarded the event initiated at 14:57:17 as the Mw6.1 earthquake and the event that occurred 14 seconds later as the largest event (the Mw7.5 earthquake). However, following the Bulletin published by JMA, we regard the initiation of their Mw6.1 event as the initiation of the main shock.
Acknowledgments. The comments by Dr. G. C. Beroza and an anonymous referee are quite helpful for improving the manuscript. We are grateful to them. We thank the National Research Insti-tute for Earth Science and Disaster Prevention for the use of the Kyoshin (strong-motion) Net (K-NET) data.
References
Ellsworth, W. L. and G. C. Beroza, Seismic evidence for an earthquake nucleation phase,Science,268, 851–855, 1995.
Iio, Y., Slow initial phase of the P-wave velocity pulse generated by microearthquakes,Geophys. Res. Lett.,19, 477–480, 1992.
Kinoshita, S., Kyoshin net (K-NET),Seismological Res. Letter,69, 309– 332, 1998.
Mori, J. and H. Kanamori, Initial rupture of earthquakes in the 1995 Ridge-crest, California sequence,Geophys. Res. Lett.,23, 2437–2440, 1996. Odaka, T., K. Ashiya, S. Tsukada, S. Sato, K. Ohtake, and D. Nozaka, A
new method of quickly estimating epicentral distance and magnitude from a single seismic record,Bull. Seism. Soc. Am.,93, 526–532, 2003. Odaka, T., K. Ashiya, and S. Tsukada, New stand-alone-type and advanced-type earthquake early warning systems for protecting rail-ways,Journ. Transp. Res. Board, 2004 (submitted).
Park, S-C. and J. Mori, The 2004 sequence of triggered earthquakes off the Kii peninsula, Japan, Japan,Earth Planets Space,57, this issue, 315– 320, 2005.
Tsukada, S., T. Odaka, K. Ashiya, K. Ohtake, and D. Nozaka, Analysis of the envelop waveform of the initial part ofP-waves and its application to quickly estimating the epicentral distance and magnitude,Zisin 2,56, 351–361, 2004 (in Japanese with English abstract and figure legends).