Open Access
Proceedings
The genetics of gene expression: comparison of linkage scans using
two phenotype normalization methods
Mariza de Andrade*
1, Elizabeth J Atkinson
1, Brooke L Fridley
1,
Ellen L Goode
2, Shannon McDonnell
1, Wen Liu-Mares
2, Kari G Rabe
1,
Zhifu Sun
2and Susan L Slager
1Address: 1Division of Biostatistics, Mayo Clinic College of Medicine, 200 First Street Southwest, Harwick 7, Rochester, Minnesota 55905, USA and 2Division of Epidemiology, Mayo Clinic College of Medicine, 200 First Street Southwest, Harwick 7, Rochester, Minnesota 55905, USA
Email: Mariza de Andrade* - [email protected]; Elizabeth J Atkinson - [email protected]; Brooke L Fridley - [email protected]; Ellen L Goode - [email protected]; Shannon McDonnell - [email protected]; Wen Liu-Mares - [email protected];
Kari G Rabe - [email protected]; Zhifu Sun - [email protected]; Susan L Slager - [email protected] * Corresponding author
Abstract
The goal of this paper is to investigate the effects of normalization procedures for expression data on linkage results. We selected the two most commonly used expression data extraction and normalization methods, Affymetrix global scaling and dChip invariant. After applying these two methods in 3554 expression phenotypes, we identified 45 phenotypes that were more likely to be genetic for either normalization procedure. A genome-wide linkage scan was performed on these expression values (45 phenotypes × 2 normalizations) using 2272 SNPs. Our results showed that: 1) the dChip normalization might inflate the LOD scores because the dChip normalization yielded LOD scores > 3.0 30% more frequently than the Affy normalization, and 2) the difference in LODs between the normalizations were not correlated with their heritabilities. In summary, we conclude, as have other published reports, that normalization methods play an important role in the linkage results, and that some significant linkage signals might be due to a specific normalization method.
Introduction
There is great interest in understanding genetic factors related to variable expression of genes. Recently, several studies have shown the first evidence of heritability of mRNA between individuals [1-4]. By treating the expres-sion phenotypes for each transcript (or probe) as a quan-titative phenotype, a variance-components linkage analysis could be used [1-4]. The expectation is to detect
linkage signals between the gene expression values and genomic regions. As pointed out by Chesler et al. [4], sev-eral issues plague these studies, including the choice of an appropriate normalization method and the selection of informative expression values. For the current analysis, we applied two data extraction and normalization methods, Affymetrix Microarray Suite with global scaling (Affy) and DNA chip analyzer's model-based expression indexes
from Genetic Analysis Workshop 15
St. Pete Beach, Florida, USA. 11–15 November 2006
Published: 18 December 2007
BMC Proceedings 2007, 1(Suppl 1):S151
<supplement> <title> <p>Genetic Analysis Workshop 15: Gene Expression Analysis and Approaches to Detecting Multiple Functional Loci</p> </title> <editor>Heather J Cordell, Mariza de Andrade, Marie-Claude Babron, Christopher W Bartlett, Joseph Beyene, Heike Bickeböller, Robert Culverhouse, Adrienne Cupples, E Warwick Daw, Josée Dupuis, Catherine T Falk, Saurabh Ghosh, Katrina A Goddard, Ellen L Goode, Elizabeth R Hauser, Lisa J Martin, Maria Martinez, Kari E North, Nancy L Saccone, Silke Schmidt, William Tapper, Duncan Thomas, David Tritchler, Veronica J Vieland, Ellen M Wijsman, Marsha A Wilcox, John S Witte, Qiong Yang, Andreas Ziegler, Laura Almasy and Jean W MacCluer</editor> <note>Proceedings</note> <url>http://www.biomedcentral.com/content/pdf/1753-6561-1-S1-info.pdf</url> </supplement>
This article is available from: http://www.biomedcentral.com/1753-6561/1/S1/S151
© 2007 de Andrade et al; licensee BioMed Central Ltd.
with invariant normalization (dChip), because they sum-marized probe-level signals using different approaches. The Affy method takes weighted average of a paired per-fect and mismatch difference for a probe set, and the dChip method uses a model-based estimation at the probe level and accounts for probe-specific effects and outliers to derive a probe set expression. Thus, our pri-mary goal was to investigate these two methods by study-ing their similarity in linkage signals, and our secondary goal was to investigate the similarity between our variance components-based linkage findings and those of Morley et al. [2], which were calculated using sib-pair regression based methodology and nuclear families only.
Methods
Data
The Genetic Analysis Workshop 15 (GAW15) Problem 1 Centre d'Etude du Polymorphisme Humain data con-sisted of 196 participants from 14 three-generation pedi-grees with 14 individuals per family, 4 grandparents, 2 parents, and 8 offspring. Two hundred and seventy-six arrays, including data on 3554 probe sets on Affymetrix Human Focus Arrays, were provided by GAW15. These probe sets had been selected as those with greatest inter-individual variability from a total of 8500 probe sets [2].
Feature-extraction and normalization methods
To assess the impact of data pre-processing on linkage analysis, we selected two feature-extraction and normali-zation methods, Affy and dChip. The data processed by the Affy method was provided by GAW15 and is the data set used by Morley et al. to identify significant linkage sig-nals for genome-wide variation of gene expression [2]. These data were normalized by global scaling using Affymetrix Microarray Suite 5 with a target value of 500 [2]. The second feature extraction and normalization was conducted using dChip, a common approach found in microarray analytical packages that is described in detail by Li and Wong [5]. Briefly, we first normalized 276 arrays from each individual against an array with the median probe intensity using the invariant set algorithm. We then calculated the model-based expression indexes (MBEI) based on the perfect match probes (PM-only model) [5]. For both normalizations, the gene expression values for individuals with technical duplicates were averaged, and all expressions were log2-transformed.
Selection of phenotype subsets
To increase the number of informative phenotypes, we excluded genes that had little variation in expression (standard deviation ≤ 0.3) and low call rates (absent calls > 90%) across samples; 3306 phenotypes (probe sets) remained. We further reduced the number by identifying those that were most likely to be genetic by calculating the heritability (H2) estimate (using the Splus/R library multic
[6]) assuming a polygenic model for both the dChip and Affy normalizations. To reduce the number of pheno-types, we used a cutpoint of H2 > 0.60 or when H2 was
sig-nificantly different from zero at α = 0.0001 for either normalization. This resulted in the inclusion of 45 pheno-types for linkage analysis.
Genetic data
For a subset of subjects, including founders, we observed a large number of missing genotypes. Because of the increase of false positives due to tight linked markers [7], we reduced the extent of linkage disequilibrium between SNPs by removing SNPs with r2 > 0.30 using ldSelect [8].
We then removed 2205 with Mendelian inconsistencies (0.5% of matings/genotypes). Thus, 2272 SNPs from a total of 2882 were used in the linkage analysis. Multipoint identity-by-descent (MIBD) sharing among pairs of rela-tives was calculated using the SIMWALK2 program [9].
Quantitative trait linkage analysis
The 90 phenotypes (45 expression phenotype × 2 normal-izations) were normally transformed using the van der Waerden rank transformation [10]. Variance-components linkage analyses were performed using the S-Plus library
multic [6]. Sex was used as a covariate, consistent with Morley et al. [2]. We assessed evidence for linkage of the 90 phenotypes and considered "strong" linkage evidence for LOD score > 3.0, which assumes a genome-wide signif-icance of 0.05.
Results
The correlation of the coefficients of variation (CV) for 3554 phenotypes from the two data pre-processing meth-ods was 0.64, indicating a reasonable agreement between the two procedures. In general, the Affy-normalized data had higher variation. There was high correlation between the two normalization methods (r = 0.97) for the 45 phe-notypes selected for linkage analyses based on heritability (data not shown).
We compared the total number of LOD scores greater than 3.0 across the genome for each normalization method and found that: 1) the data from the dChip method led to twice as many positions with "strong" link-age evidence compared to the data from Affy, and 2) of the strong linkage findings, 49% were identified by both methods. The remaining findings between the two meth-ods were discordant. For example, analysis of the activat-ing transcription factor phenotype (205446_s_at) yielded 14 strong linkage signals (LOD > 3.0) across multiple chromosomes using the dChip method, but none were found using the Affy normalized method.
phe-notypes had LOD score differences < 3.0 across the entire genome (Fig. 1A shows 2 of those 25), and 20 expression phenotypes had LOD differences > 3.0 in about 25% of the entire genome (Fig. 1B shows 2 of those 20). Three of these 20 (208151_s_at, 320_at, 65588_at) had most of the LOD difference > 3.0 on one chromosome (chromo-somes 22, 6, 20, respectively), and 17 of the 20 had LOD difference > 3.0 distributed over multiple chromosomes. We observed no correlation between the difference in the LOD scores between the two normalization methods and their polygenic heritabilities (data not shown).
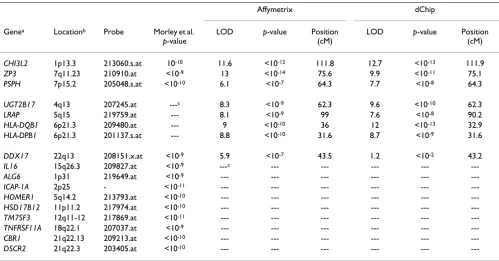
Table 1 shows the results between the two normalization methods we used and Morley's using a criterion of p < 10 -8 for significance with either normalization approach.
Morley et al. used the Affy normalization method and
their multipoint genome-wide linkage analysis was done using SIBPAL in S.A.G.E. [2] in which they used a sib-pair-based regression approach rather than variance-compo-nents methodology. Three of our seven strongest linkage signals matched those found by Morley et al.; four did not. For the remaining eight phenotypes identified by Morley et al., we were unable to compare the results because the specific expression phenotypes were not part of our final 45 selected phenotypes. Finally, we showed agreement in linkage signals between the Affy and dChip normalizations with seven expression phenotypes, and one disagreement (208151.x.at).
Discussion
As reported recently by Chesler et al., normalization plays an important part in linkage analysis [4]. Our results indi-Genome scans comparing the two normalization approaches
Figure 1
cate that the dChip normalization might inflate the LOD scores because here it yielded greater LOD scores than the Affy, and produced, on average, more evidence of linkage than the Affy despite the fact that the data from two nor-malizations were highly correlated. We also found that the difference in LOD scores between the normalizations was not correlated with their heritabilities. We also inves-tigated the similarity between our linkage results and Mor-ley et al. [2], and found agreement with three out of seven expression phenotypes that we considered.
Conclusion
It remains unclear which pre-processing method for microarray data is the most appropriate to use for linkage analysis. The two procedures we assessed (Affy and dChip) were similar in most respects; however, in 16 of the 45 phenotypes, we observed a large difference between the two methods for at least one chromosome. Thus, further work is needed to examine the influence of data preparation and phenotype normalization methods on results of linkage analyses.
Competing interests
The author(s) declare that they have no competing inter-ests.
Acknowledgements
This research was partially funded by NIH grants R01HL71917 and CA94919.
This article has been published as part of BMC Proceedings Volume 1 Sup-plement 1, 2007: Genetic Analysis Workshop 15: Gene Expression Analysis and Approaches to Detecting Multiple Functional Loci. The full contents of the supplement are available online at http://www.biomedcentral.com/ 1753-6561/1?issue=S1.
References
1. Schadt EE, Monks SA, Drake TA, Lusis AJ, Che N, Colinayo V, Ruff TG, Milligan SB, Lamb JR, Cavet G, Linsley PS, Mao M, Stoughton RB, Friend SH: Genetics of gene expression surveyed in maize, mouse and man. Nature 2003, 422:297-302.
2. Morley M, Molony CM, Weber TM, Devlin JL, Ewens KG, Spielman RS, Cheung VG: Genetic analysis of genome-wide variation in human gene expression. Nature 2004, 430:743-747.
3. Cheung VG, Spielman RS, Ewens KG, Weber TM, Morley M, Burdick JT: Mapping determinants of human gene expression by regional and genome-wide association. Nature 2005, 437:1365-1369.
4. Chesler EJ, Lu L, Shou S, Qu Y, Gu J, Wang J, Hsu HC, Mountz JD, Baldwin NE, Langston MA, Threadgill DW, Manly KF, Williams RW: Complex trait analysis of gene expression uncovers poly-genic and pleiotropic networks that modulate nervous sys-tem function. Nat Genet 2005, 37:233-242.
5. Li C, Wong WH: Model-based analysis of oligonucleotide arrays: expression index computation and outlier detection.
Proc Natl Acad Sci USA 2001, 98:31-36.
6. de Andrade M, Atkinson EJ, Lunde EM, Amos CI, Chen J: Estimating Genetic Components of Variance in Family Studies Using the Multic Rou-tines. Technical Report No 78Rochester, Minnesota: Department of Health Science Research, Mayo Clinic; 2006.
Table 1: Expression phenotypes with the strongest agreement and evidence of linkage for the two normalization procedures
Affymetrix dChip
Genea Locationb Probe Morley et al.
p-value
LOD p-value Position
(cM)
LOD p-value Position
(cM)
CHI3L2 1p13.3 213060.s.at 10-10 11.6 <10-12 111.8 12.7 <10-13 111.9
ZP3 7q11.23 210910.at <10-9 13 <10-14 75.6 9.9 <10-11 75.1
PSPH 7p15.2 205048.s.at <10-10 6.1 <10-7 64.3 7.7 <10-8 64.3
UGT2B17 4q13 207245.at ---c 8.3 <10-9 62.3 9.6 <10-10 62.3
LRAP 5q15 219759.at --- 8.1 <10-9 99 7.6 <10-8 90.2
HLA-DQB1 6p21.3 209480.at --- 9 <10-10 36 12 <10-13 32.9 HLA-DPB1 6p21.3 201137.s.at --- 8.8 <10-10 31.6 8.7 <10-9 31.6
DDX17 22q13 208151.x.at <10-9 5.9 <10-7 43.5 1.2 <10-2 43.2
IL16 15q26.3 209827.at <10-9 ---c --- --- --- ---
---a The first group of genes shows agreement between Morley et al. [2] and our findings. The second group represents our significant findings at the
level of significance 10-8 or less but not in Morley's. The third group represents significance in Morley's findings and not ours. The fourth group
shows findings in Morley that we did not examine (H2 < 0.6). The LOD represents the maximum LOD scores in the chromosome where the genes
are located with its respective p-values and positions in cM.
b Location was determined by the file HG-Focus_annot.csv.
Publish with BioMed Central and every scientist can read your work free of charge "BioMed Central will be the most significant development for disseminating the results of biomedical researc h in our lifetime."
Sir Paul Nurse, Cancer Research UK
Your research papers will be:
available free of charge to the entire biomedical community
peer reviewed and published immediately upon acceptance
cited in PubMed and archived on PubMed Central
yours — you keep the copyright
Submit your manuscript here:
http://www.biomedcentral.com/info/publishing_adv.asp
BioMedcentral 7. Huang Q, Sanja S, Amos CI: Ignoring linkage
disequilibriuma-mong tightly linked markers induces false-positive evidence oflinkage for affected sib pair analysis. Am J Hum Genet 2004, 75:1106-1112.
8. Carlson CS, Eberle MA, Rieder MJ, Yi Q, Kruglyak L, Nickerson DA: Selecting a maximally informative set of single-nucleotide polymorphisms for association analyses using linkage dise-quilibrium. Am J Hum Genet 2004, 74:106-120.
9. Sobel E, Sengul H, Weeks DE: Multipoint estimation of identity-by-descent probabilities at arbitrary positions among marker loci on general pedigrees. Hum Hered 2001, 52:121-131. 10. Lehman EL: Nonparametrics: Statistical Methods Based On RanksSan