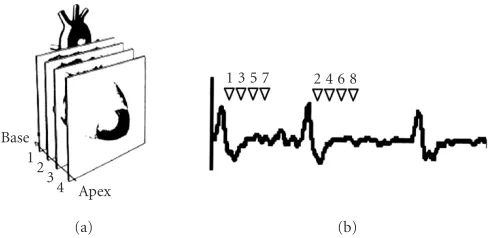
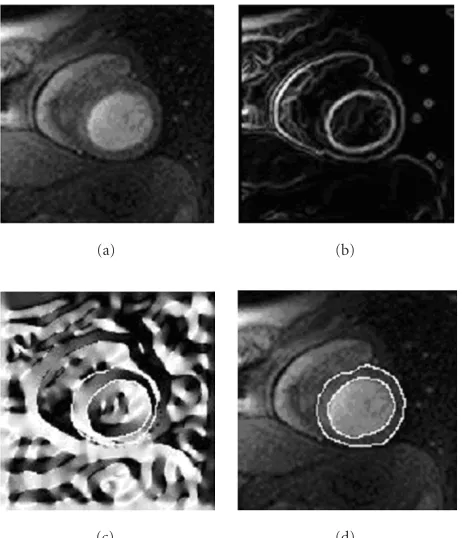
Automatic Characterization of Myocardial Perfusion in Contrast Enhanced MRI
Full text
Figure
Related documents
If the subsystem ERPs cannot recover from an error, the unit check status bit (status bit 6) is sent to the controlling computer. The unit check status bit can be sent
Binary weighted encoder Error Comparison.
Figure 4-7: TEM images of superparamagnetic magnetite particles within an organic matrix from above MTL in C139, single-domain stochiometric magnetite particles from surface
Buenzli and Schmid (2009) explored the dependence of observable polarization signals on single scattering albedo, optical depth of the scattering layer, and albedo of an
The present study combined latency and mapping approaches in an attempt to map the latencies of the conditioned responses within the brain stem. This method
INBOUND SIGNALS TO
[r]
Therefore, we sought to determine the prevalences of dementia and AD in a population of nursing home residents and senior center attendees of Durango City, Mexico, and to
