Western University Western University
Scholarship@Western
Scholarship@Western
Electronic Thesis and Dissertation Repository
9-16-2014 12:00 AM
Development of Novel Nanomaterials Based on Silicon and
Development of Novel Nanomaterials Based on Silicon and
Graphene for Lithium Ion Battery Applications
Graphene for Lithium Ion Battery Applications
Yuhai Hu
The University of Western Ontario
Supervisor
Prof. Xueliang (Andy) Sun
The University of Western Ontario
Graduate Program in Mechanical and Materials Engineering
A thesis submitted in partial fulfillment of the requirements for the degree in Doctor of Philosophy
© Yuhai Hu 2014
Follow this and additional works at: https://ir.lib.uwo.ca/etd
Part of the Materials Science and Engineering Commons
Recommended Citation Recommended Citation
Hu, Yuhai, "Development of Novel Nanomaterials Based on Silicon and Graphene for Lithium Ion Battery Applications" (2014). Electronic Thesis and Dissertation Repository. 2499.
https://ir.lib.uwo.ca/etd/2499
This Dissertation/Thesis is brought to you for free and open access by Scholarship@Western. It has been accepted for inclusion in Electronic Thesis and Dissertation Repository by an authorized administrator of
DEVELOPMENT OF NOVEL NANOMATERIALS BASED ON
SILICON AND GRAPHENE FOR LITHIUM ION BATTERY
APPLICATIONS
(Thesis format: Integrated-Article)
by
Yuhai Hu
Graduate Program in Mechanical and Materials Engineering
A thesis submitted in partial fulfillment of the requirements for the degree of
Doctor of Philosophy
The School of Graduate and Postdoctoral Studies The University of Western Ontario
London, Ontario, Canada
ABSTRACT
Electrochemical energy storage is one of the important strategies to address the
strong demand for clean energy. Rechargeable lithium ion batteries (LIBs) are one of the
typical electrochemical devices and have been used in a great number of areas. Now, the
challenge for the LIB research is to make the batteries carry higher energy density so as
to fulfill the demand of the emerging markets, particularly, electric vehicles and portable
smart electronics. In this regard, the present commercial anode material can not meet
this requirement. Much effort is being made toward either exploring new morphologies
of carbon materials or searching for new materials that possess high theoretical lithium
ion storage capacities. Among these, graphene and silicon have been receiving rapidly
increasing interest.
As such, this Ph D research focused on two topics: (1) developing
graphene-based free-standing materials used as anodes for LIBs, which will find potential
applications in flexible LIBs; (2) developing cost-effective processes for mass
production of low-dimensional nanostructured silicon with controlled morphologies
from low-cost materials.
The free-standing anodes include graphene papers, graphene-carbon nanotubes
papers, graphene-MoS2 papers and graphene-Si nanowires papers. They exhibited very
high mechanical strength. Their battery performances were highly dependent on the
composites of the papers and the ratios of graphene to the guest component (e.g., Si),
and graphene-Si nanowires papers exhibited the highest lithium-storage capacities of
>1000 mA h g-1. The materials have high potential for use as freestanding anodes for LIBs. The related results are organized in Chapter 3-6 in this thesis.
A catalyst-free etching process was developed to produce 1D silicon nanostructures
(nanobelts and nanowires) from low-cost and metallurgical ferrosilicon alloys with
relatively high yields. When used as an anode material, the 1D nanostructured silicon
a method that is highly potential for low cost, mass production of 1D nanostructured
silicon. The related results are organized in Chapter 7 in this thesis.
Challenges and future research opportunities in the two areas were suggested.
Keywords: Nanoscience and nanotechnolgy, Electrochemical energy storage,
Nanomaterials, Lithium ion batteries, Flexible lithium ion batteries, anode, graphene,
CO-AUTHORSHIP
1. Title: Influence of paper thickness on the electrochemical performances of graphene
papers as an anode for lithium ion batteries
Authors: Yuhai Hu, Xifei Li, Dongsheng Geng, Ruying Li, Mei Cai, and Xueliang Sun
All the experimental and theoretical work was carried out by Yuhai Hu under the
guidance of Dr. Sun. The initial draft and the following modification of this manuscript
were conducted by Yuhai Hu under the supervision of Dr. Sun. The other coauthors
contributed to the formation of the final version with discussion and related
characterization. The final version of this manuscript has been published in
Electrochimica Acta, 2013, 91, 227-233.
2. Title: Free standing graphene-carbon nanotube hybrid papers used as current
collector and binder free anodes for lithium ion batteries
Authors: Yuhai Hu, Xifei Li, Jiajun Wang, Ruying Li, and Xueliang Sun
All the experimental and theoretical work was carried out by Yuhai Hu under the
guidance of Dr. Sun. The initial draft and the following modification of this manuscript
were conducted by Yuhai Hu under the supervision of Dr. Sun. The other coauthors
contributed to the formation of the final version with discussion and related
characterization. The final version of this manuscript has been published in Journal of
Power Sources, 2013, 237, 41-46.
3. Title: Fabrication of MoS2-graphene nanocomposites by layer-by-layer manipulation
for high-performance lithium ion battery anodes
Authors: Yuhai Hu, Xifei Li, Andrew Lushington, Mei Cai, Dongsheng Geng,
Mohammad Norouzi Banis, Ruying Li, Xueliang Sun
All the experimental and theoretical work was carried out by Yuhai Hu under the
were conducted by Yuhai Hu under the supervision of Dr. Sun. The other coauthors
contributed to the formation of the final version with discussion and related
characterization. The final version of this manuscript has been published in ECS
Journal of Solid Sate Science and Technology, 2013, 2, M3034-M3039.
4. Title: Flexible rechargeable lithium ion batteries: advances and challenges in
materials and process technologies
Authors: Yuhai Hu, Xueliang Sun
All the literature survey was carried out by Yuhai Hu under the guidance of Dr. Sun.
The initial draft and the following modification of this manuscript were conducted by
Yuhai Hu under the supervision of Dr. Sun. The final version of this manuscript has
been published in Journal of Materials Chemistry A 2(2014) 10712-10738.
5. Title: Chemically functionalized graphenes and their applications in electrochemical
energy conversion and storage
Authors: Yuhai Hu, Xueliang Sun
All the literature survey was carried out by Yuhai Hu under the guidance of Dr. Sun.
The initial draft and the following modification of this manuscript were conducted by
Yuhai Hu under the supervision of Dr. Sun. The final version of this manuscript has
been published as a chapter in the book of "Advances in Graphene Science", ISBN
980-953-307-981-8. InTech-open science, open minds. Website: http://www.intechopen.com-
ACKNOWLEDGMENTS
This Ph D thesis work was accomplished in Dr. Sun's Nanomaterials and Clean
Energy Lab at Western University, Canada. Throughout the years, I've got quite a list of
people who had made contribution to this thesis in some way, for which I would like to
express thanks.
First and foremost, I would like to express my profound gratitude to my supervisor,
Dr. Xueliang Sun, a professor and a Canada Research Chair (Tire 1) in Nanomaterials
for Clean Energy in the Department of Mechanical & Materials Engineering at The
University of Western Ontario, for offering me the opportunity to study under his
guidance. I am very indebted to him for his patience, encouragement, insightful advice,
and strong support in various ways. Without his extensive and comprehensive help, this
thesis could not have been possible. His solid knowledge, rigorous attitude and
enthusiasm in research impressed me greatly.
I am very grateful to Mrs. Ruying (Kathy) Li, a research engineer in the group. She
has been making a great effort to maintain a wonderful workplace in the labs. Besides
teaching me a lot of skills on characterizing nanomaterials and experiments, Mrs. Li
gave her kindness and generosity to my life as well. She was the first person I want to
see upon a problem comes to visit.
I would like to sincerely thank my advisory committee members Dr. Robert Classen,
Dr. Samuel F. Asokanthan, and Dr. Liying Jiang, three professors in MME at Western
for their valuable advice on my studies at every stage. I would also like to thank the
examiners of my thesis defense: Dr. Jiujun Zhang (a senior research officer at NRC), Dr.
Clara Wren (a professor in Chemistry at UWO), Dr. Jeff T. Wood (a professor in MME
of UWO), and Dr. Jun Yang (a professor in MME of UWO) for their careful
examination, insightful suggestions, comments, and discussions.
I deeply appreciate the strong supports I received from industry. Dr. Harris Yang,
President of Springpower International Inc. (SPI), and Dr. Mei Cai, Project manager and
I am deeply grateful to all current and former members in Dr. Sun’s Nanomaterials
and Energy Group at UWO. I am so proud of being part of such a strong research group.
Especially, I would like to thank Dr. Xifei Li, Dr. Dongsheng Geng, Dr. Mihnea I.
Ionescu, Dr. Jian Liu, and Dr. Mohammad N. Banis for their training and help. I also
would like to extend my appreciation to my colleages, Dr. Yong (Bryan) Zhang, Mr.
Chianan Shi, Dr. Xiangbo (Henry) Meng, Dr. Yongji Tang, Dr. Jingli Yang, Dr.
Yongliang Li, Mr. Biwei Xiao, Dr. Dongniu Wang, Dr. Yu Zhong, Dr. Shuhui Sun, Dr.
Gaixia Zhang, Dr. Jiajun Wang, Dr. Yougui (Alex) Chen, Dr. Liang Li, Dr. Dawei
Wang, Dr. Kun Chang, Mr. Hamid N. Banis, Dr. Niancai Cheng, Dr. Karthikeyan
Kaliyappan, Mr. Andrew Lushington, Ms. Xia Li, Ms. Biqiong Wang, Mr. Hossein
Yadegari, Mr. Yulong Liu, Mr. Wei Xiao, Dr. Qian Sun, Dr. Jianshe Wang, Mr. Stephen
Lowes, Mr. Craig Langford, Mr. Adam Riese, etc.
Specially, I would like to express my sincere gratitude towards my parents-in-law and
my parents, for their understanding, support and encouragement. My heartiest thanks go
to my wife and my two kids for their love and support throughout the challenging 4
years.
Finally, I would like to thank everybody who was important to the successful
realization of my thesis, as well as expressing my apology that I could not mention
personally one by one.
Yuhai Hu
London, ON, Canada
TABLE OF CONTENTS
ABSTRACT……….…...………...ii
COAUTHORSHIP.……...……….………...iv
ACKNOWLEDGEMENTS……...………...vi
TABLE OF CONTENTS..……....………..……...…...viii
LIST OF TABLES……….………...xiv
LIST OF FIGURES …………..….………...…………..………...xv
LIST OF APPENDICE...xxxvi
Chapter 1 Introduction…………..……….………...1
1.1 Lithium ion batteries...………...………...1
1.1.1 Fundamentals of lithium ion batteries...………...…………...1
1.1.2 Perspective and challenges for lithium ion batteries……...……...3
1.2 The solutions with nanomaterials………...7
1.3 Introduction to graphene in electrochemical energy conversion and storage...9
1.4 Introduction to flexible lithium ion batteries...38
1.5 Introduction to nanostructured Si as anodes for lithium ion batteries...88
1.6 Thesis objectives…...……….………....………...136
1.7 Thesis organization……...………...140
Chapter 2 Experimental and characterization techniques…...……….…...165
2.1 Materials synthesis and fabrication...………..…...……...165
2.1.1 Synthesis of graphene………...165
2.1.2 Fabrication of Si NWs...165
2.1.3 Fabrication of MoS2 nanosheets...166
2.1.4 Fabrication of graphene papers….………….……...…...166
2.1.5 Fabrication graphene-CNT hybrid papers...167
2.1.6 Fabrication of graphene-Si NWs hybrid papers...……...167
2.1.7 Fabrication of graphene-MoS2 nanowires hybrid papers...168
2. 1.8 Atomic layer deposition of metal oxide on graphene-based hybrid papers....168
2.2 Instruments……….…...168
2.2.1 Atomic layer deposition...168
2.2.2 Physical characterization...…...169
2.2.3 Electrochemical characterization…...………...…...173
References……….……...………...175
Chapter 3 Influence of paper thickness on the electrochemical performances of graphene papers as an anode for lithium ion batteries...176
3.1 Introduction………...….…….…..177
3.2 Experimental………..………...….…….……..178
3.2.2 Characterization of graphene papers...179
3.3 Results and discussion...180
3.3.1 Morphologies of GNS and graphene papers...180
3.3.2 Electrochemical characterization of the graphene papers...181
3.3.3 Characterization of graphene papers after battery test...183
3.4 Conclusions………..………..…...…..…...187
Acknowledgements…...………...………...…..…...187
References………...………...………...….…….…...187
Supporting Information………...……..……….……....…..190
Chapter 4 Freestanding graphene-carbon nanotube hybrid papers used as current collector and binder free anodes for lithium ion batteries...192
4.1 Introduction……….……...……...……193
4.2 Experimental………..………...…...……194
4.2.1 Fabrication of GNS and CNT dispersion...194
4.2.2 Characterization...195
4.3 Results and discussion...…...………..…...……..196
4.3.1 Characterization of the hybrid papers...196
4.3.2 Electrochemical characterization of the hybrid papers...198
4.3.3 Characterization of the tested papers...200
Acknowledgements………...………....…..…..202
References………...………...………....….…...….…...203
Supporting Information……….…………...….…203
Chapter 5 Significant improvement in the lithium ion battery performances of the silicon-graphene flexible nanocomposites followed by Al2O3 coating by atomic layer deposition process...………...…207
5.1 Introduction………...……...……208
5.2 Experimental………..………....…...……..…..….…211
5.2.1 Fabrication of GNS and Si NWs...211
5.2.2 Fabrication of SiNW-GN papers...211
5.2.3 Characterization...212
5.3 Results and discussion...………..…...…....…212
5.3.1 Morphologies of the Si NWs and the papers...212
5.3.2 Electrochemical characterization...214
5.3.3 Characterization of the samples after test...219
5.4 Conclusions………..………...…...…..…….220
Acknowledgements……….……...……….……...…..…....222
References………...………...…...….…...….222
Supporting Information………...……..………...…..….…..226
6.1 Introduction……...………...……….…..…233
6.2 Experimental………...………….…...…235
6.2.1 Materials fabrication...235
6.2.2 Materials characterization...236
6.3 Results and discussion……….……….…237
6.3.1 Characterization of the MoS2 nanosheets and the MoS2-graphene nanocomposites ………..……….237
6.3.2 Electrochemical properties of the MoS2-graphene nanocomposites...242
6.3.3 Characterization of the samples after test...246
6.4 Conclusions………..…...……...247
Acknowledgements………...………...……...249
References………...………...….……..…...249
Supporting Information………...……….………...251
Chapter 7 A catalyst-free chemical etching process for mass production of one-dimensional nanostructured silicon with controlled morphologies from commercial ferrosilicon alloys...…...…...255
7.1 Introduction………...….……...…...256
7.2 Production of nanoribbons.………..…………...……….…...…...259
7.3 Mechanism of nanoribbons formation…...………….……...260
7.4 Control over the morphology and size of the 1D nano Si..…………..…...262
7.6 Electrochemical characterization...265
7.7 Conclusions………..………...…...…..…...266
References………...………...….……...…...266
Supporting information……...………...……..……….………...269
Chapter 8 Conclusions and future perspectives ...………...……...279
8.1 Conclusions...……..………...………...…….…….………...279
8.2 Future perspectives…...………...……….…...…282
8.2.1 Flexible lithium ion batteries………...……….282
LIST OF TABLES
Chapter 1
Table 1-1 Comparison of various anode materials (all the capacity numbers are based on
materials in the delithiated state except lithium metal) ...7
Table 1-2 A summary of the chemical routes for functionalization of graphene by
heterogeneous atoms doping...12
Table 1-3 A summary of the chemical functionalization of graphene with organic
groups……….27
Table 1-4 A summary of the functionalized graphene applied to electrochemical energy
conversion and storage………...37
Chapter 5
Table S5-1 Si/C and Al/C ratio for the Si1660GN paper following various cycles of
Al2O3 coating, estimated by EDX analysis...226
Table S5-2 Specific capacities of SiNW-GN paper calculated in different ways...226
Chapter 6
Table 6-1 The contents of the elements in the MoS2-GN samples, estimated on the base
of the EDX quantification...…..…...239
Table 6-2 The intensity ratios of the MoS2 peak (404 cm-1) to the graphene peak (1596
cm-1) for the MoS2-GN samples...…………..…...242
Chapter 7
Table S7-1 Results of etching ferrosilicon alloys with other strong acids or
LIST OF FIGURES
……….….…….…….…...Chapter 1...…………...….………...
Figure 1-1 A schematic diagram of the structure of a traditional LIB...2
Figure 1-2 A schematic diagram of the structure of LiFePO4..…...2
Figure 1-3 A typical charge-discharge profile of a graphene based anode material...4
Figure 1-4 Comparison of the different battery technologies in terms of volumetric and
gravimetric energy density...4
Figure 1-5 Voltage versus capacity for positive- and negative-electrode materials
presently used or under serious considerations for the next generation of
rechargeable...5
Figure 1-6 Schematic diagrams of graphene and graphene-based 0D, 1D and 3D
structured
carbon...10
Figure 1-7 Schematic diagram of the three types of doped N atoms in
N-graphene...15
Figure 1-8 TEM images of N-doped graphene on copper foils: Left, with a single
graphitic N dopant; right, with 14 graphitic N dopants and strong intervalley
scattering tails...16
Figure 1-9 A schematic diagram of the direct electrochemical reduction of single-layer
graphene oxide (GO) and subsequent functionalization with glucose
oxidase………...21
Figure 1-10 Schematic diagram of the functionalization of graphene using diazonium
Figure 1-11 Schematic diagram of the functionalization of graphene using silanization
reaction...24
Figure 1-12 Chemical functionalization of graphene using amidation reaction...26
Figure 1-13 Chemical functionalization of graphene using cycloaddition reaction...26
Figure 1-14 TEM image of nitrogen doped graphene and its electrochemical
performance as a metal-free catalyst for ORR...32
Figure 1-15 Electrochemical performances of nitrogen doped graphene as anode for
LIBs...36
Figure 1-16 Electrochemical performances of nitrogen doped graphene as cathode for
lithium oxygen batteries...36
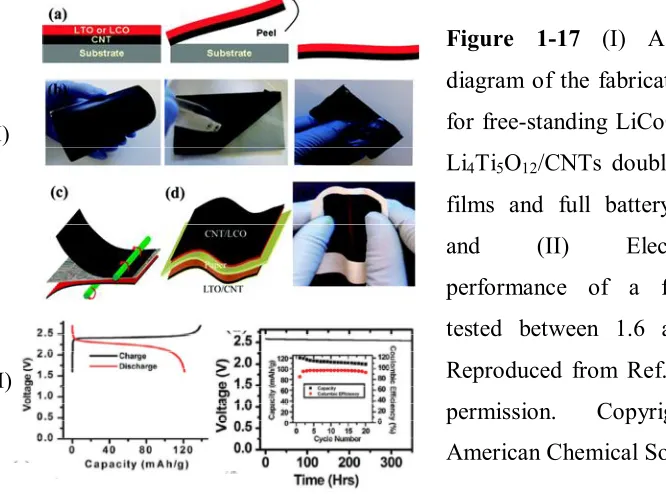
Figure 1-17 (I) A schematic diagram of the fabrication process for free-standing
LiCoO2/CNTs or Li4Ti5O12/CNTs double layer thin films and full battery
assembly; and (II) Electrochemical performance of a full battery tested
between 1.6 and 2.6 V...46
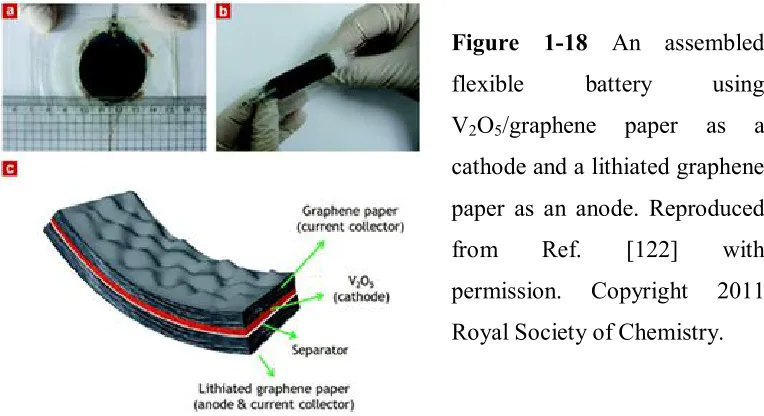
Figure 1-18 An assembled flexible battery using V2O5/graphene paper as a cathode and
a lithiated graphene paper as an anode...49
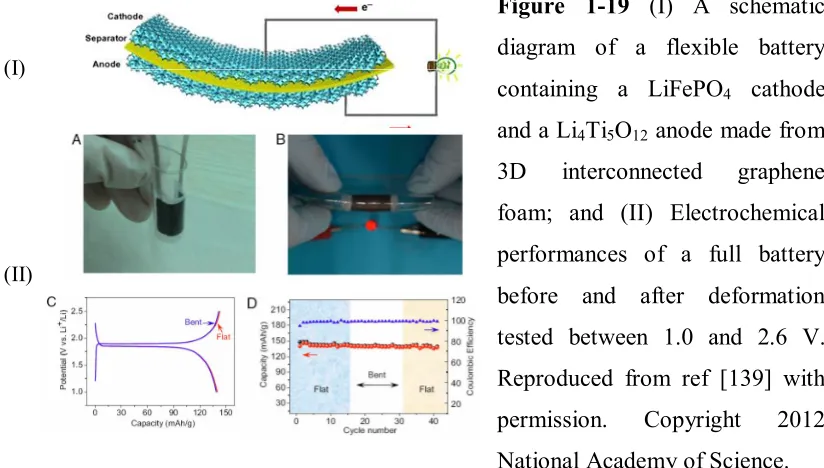
Figure 1-19 (I)A schematic diagram of a flexible battery containing a LiFePO4 cathode
and a Li4Ti5O12 anode made from 3D interconnected graphene foam; and (II)
Electrochemical performances of a full battery before and after deformation
tested between 1.0 and 2.6 V...50
Figure 1-20 A schematic diagram of the process for fabricating cable battery...52
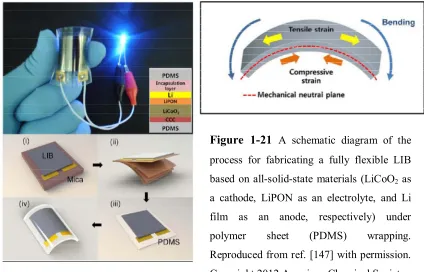
Figure 1-21 A schematic diagram of the process for fabricating a fully flexible LIB
based on all-solid-state materials (LiCoO2 as a cathode, LiPON as an
electrolyte, and Li film as an anode, respectively) under polymer sheet
Figure 1-22 A schematic diagram of the process for fabricating the devices with arrays
of small-scale LIBs (with LiCoO2 and Li4Ti5O12 as cathode and anode
materials, respectively) that are connected by conducting
frameworks... ...55
Figure 1-23 (a) A full flexible Li-ion battery composed of Si NWs-carbon textiles
anode, commercial LiCoO2 cathode, Celgard 2400 separator, and LiPF6
-based electrolyte, (b) and (c) cyclic stability and rate capability...56
Figure 1-24 A schematic diagram of the process for a full flexible LIB with hierarchical
ZnCo2O4 nanowire arrays/carbon cloth as an anode and LiCoO2 as a
cathode...58
Figure 1-25 A schematic diagram of folding paper-based LIBs consisting of Li4Ti5O12
and LiCoO2 powders deposited onto the CNTs coated papers and the
performances of folded and unfolded cell...60
Figure 1-26 A schematic diagram and SEM images of the roll-up nanowire battery from
silicon chips...62
Figure 1-27 A schematic diagram of a full flexible LIB with paper-like free-standing
V2O5-polypyrrole as a cathode and a lithium foil as an anode...64
Figure 1-28 Schematic diagrams and SEM images of the free-standing papers made
from CNTs (a and b), graphene and their hybridization...67
Figure 1-29 A schematic diagram illustrating the UV-curing process and photographs
depicting the physical appearance of solid state electrolytes...76
Figure 1-30 A schematic diagram illustrating the process for making paintable
batteries...85
Figure 1-31 (I) A schematic diagram illustrating 3D printing of interdigitated Li-Ion
of a Li4Ti5O12 anode and a LiFePO4 cathode tested between 1.0 and 2.5
V...87
Figure 1-32 An overview of the challenges in the materials and process technologies for
future flexible lithium ion battery research...87
Figure 1-33 SEM images of some typical nanostructuredSi ...89
Figure 1-34 Si NT Si-H model and self-assembled growth schematic of the Si NTs. (a)
The formation of the initial Si NT under supercritically hydrothermal
conditions; (b) Abundant Si atoms enter the initial Si NT resulting in the
growth of the Si NT and the formation of silica outer layers retarding
non-one-dimensional growth of the Si NT; (c) The formation of a closed cap of
the Si NT...97
Figure 1-35 SEM images of the patterned Si films after test and the charge-discharge
capacities of the patterned films tested under various
conditions...102
Figure 1-36 Battery performances of various porous Si thin films and the morphologies
of the films after cycling...102
Figure 1-37 SEM images of the Si NWs before and after test and the charge-discharge
capacities of the NWs tested under various conditions...103
Figure 1-38 SEM images of the Si NTs before test and the charge-discharge capacities
of the NWs tested under various conditions...104
Figure 1-39 SEM images of the porous Si and the charge-discharge capacities of the
porous Si tested under various conditions...106
Figure 1-40 TEM images of the carbon coated Si NPs and the charge-discharge
Figure 1-41 TEM images of the carbon coated Si NWs and the charge-discharge
capacities of the composites tested under various conditions...110
Figure 1-42 SEM images of the carbon coated porous Si and the charge-discharge
capacities of the composites tested under various conditions...112
Figure 1-43 A photography of the free-standing CNT-Si NPs nanocomposites and its
charge-discharge capacities tested under various conditions...114
Figure 1-44 SEM images of the free-standing graphene-Si NWs composites and the
charge-discharge capacities tested under various conditions...115
Figure 1-45 TEM images of Fe/Si electrode before and after tests and the
charge-discharge capacities tested under various conditions...118
Figure 1-46 The charge-discharge capacities of Mg2Si tested under various conditions....
...121
Figure 1-47 TEM images of various alloys andthe battery performances...122
Figure 1-48 SEM image of the thin films before test andthe charge-discharge capacities
of thin films tested under various conditions...124
Figure 1-49 SEM image of the Si powder before test and the charge-discharge
capacities of Si anodes tested under various conditions...125
Figure 1-50 SEM image of the Si NWs and SEI layer at different potential...129
Figure 1-51 Plot of data collected for the first discharge and charge of the in situ XRD
cell showing ~a) potential vs. time and ~b) selected XRD scans...133
Figure 1-52 The effect of nanopillar size and reaction rate on the fracture ratio for h111i
axially oriented nanopillars. The “fracture ratio” was determined by
examining a large number of nanopillars and dividing the number of
Figure 1-53 (a)Single-crystalline (111) silicon wafer with an array of 10 μ m wide bars
spaced 10 μm apart galvanostatically charged at current densities of b) 36.8
μA cm−2; c) 73.9 μA cm−2, d) 147 μA cm−2; e) 289 μA cm−2 for up to 10 hours. f) Within 10 hours of galvanostatic charging at current densities
greater than 73.9 μA cm−2, the threshold value for volumetric expansion which limits lithium intercalation is reached, g) Modulating the spacing
between the structures alters the maximum obtainable strain-limited charge
capacity...135
Figure 1-54 A schematic diagram describing the issues of using graphene papers as anodes for LIBs and possible solutions………...…137
……….….…….…….…...Chapter 2...………....……… Figure 2-1 A picture of Savannah 100 ALD system...169
Figure 2-2 A picture of Hitachi S-4800 high-resolution scanning electron microscope...169
Figure 2-3 Apicture of Hitachi H-7000 transmission electron microscope...170
Figure 2-4 A picture of Bruker D8 Advance XRD system...171
Figure 2-5 A picture of HORIBA Scientific LabRAM research Raman spectroscopy... ………...…..171
Figure 2-6 A picture of SDT Q600 thermal analysis system…...172
Figure 2-7 A picture of VMP3 Potentiostat/Galvanostat/EIS system...173
Figure 2-8 A picture of Arbin Battery Testing system...174
Figure 2-9 A picture of an opened coin cell employed for electrochemical characterization of materials...174
Figure 3-1 Schematic diagram of the fabrication of graphene paper through vacuum
assisted filtration of GNS dispersion and a photograph of as-prepared graphene
paper...179
Figure 3-2 SEM and TEM of reduced GNS before paper fabrication...180
Figure 3-3 SEM images of graphene papers: (a)-(c) cross sections of GP-I, GP-II and
GP-III, respectively; (d) top view of GP-III...182
Figure 3-4 Cyclic voltammetry curves of graphene papers...183
Figure 3-5 Charge-discharge profiles of GP-I and GP-II...184
Figure 3-6 Electrochemical characterization of graphene papers as anode: (a)
charge-discharge cycles of GP-II tested at various current rates; (b) charge-charge-discharge
cycles of different graphene papers tested at 100 mA g-1...184
Figure 3-7 SEM images and Raman spectra of GP-II after 100 charge-discharge cycles
at different current rates: (a) and (b) top views of the paper tested at 100 and
500 mA.g-1, respectively; (c) cross section of the paper tested at 100mA.g-1; (d) Raman spectra...185
Figure S3-1 HRTEM image of graphene nanosheets...190
Figure S3-2 A piece of graphene paper that can be bent to any angle...190
Figure S3-3 Raman mapping of GP-II after test at 100 mA g-1: (a) spectra before normalization and (b) spectra after normalization...191
Figure S3-4 Intensity ratios of D band to G band in the Raman spectra collected at
different position of the paper...191
……….….…….…….…...Chapter 4...……….….…….…
Figure 4-1 Schematic diagram of fabrication of the CNT-GN papers by vacuum assisted
Figure 4-2 SEM images of the CNT-GN papers: (a) and (b) top views of the
6.5CNT-20GN and 20CNT-10GN papers, respectively; (c) and (d) cross sections of the
20CNT-20GN and 20CNT-10GN papers, respectively...197
Figure 4-3 Raman spectra of the CNT-GN papers...199
Figure 4-4 Cyclic voltammetry curves of the 6.5CNT-20GN (a) and the 20CNT-10GN
(b) papers...199
Figure 4-5 Electrochemical characterization of the CNT-GN papers as anode tested at a
current rate of 100 mA g-1: (a) 20CNT-10GN; (b) 20CNT-20GN; (c) graphene paper; (d) 6.5CNT-10GN...200
Figure 4-6 SEM images of the CNT-GN papers after tests: (a) the 6.5CNT-20GN paper,
(b) the 20CNT-10GN paper...201
Figure 4-7 Raman spectra of the CNT-GN papers after test. ...202
Figure S4-1 A piece of graphene-CNT paper that can be bent to any angle...205
Figure S4-2 SEM image of graphene paper following NH3 treatment...206
Figure S4-3 Battery performances of CNTs…...206
……….….…………...Chapter 5...……….….………
Figure 5-1 A schematic diagram for the procedure of fabricating flexible SiNW-GN
hybrid nanocomposites with Al2O3 coating...210
Figure 5-2 Morphology and crystallinity of the Si NWs and the SiNW-GN papers: TEM
(a) and HRTEM (b) images of the NWs; (c) a photograph of the bent
Si1660GN paper; (d) and (e) SEM images of the Si1660GN paper; (f) SEM
image of the Si1660GN paper with 10 cycles of Al2O3
Figure 5-3 (a) Raman spectra of various SiNW-GN papers; (b)-(d) CV curves of the
Si375GN paper, the Si1660GN paper and the Si1660GN paper with 10 cycles
of Al2O3 coating, respectively...218
Figure 5-4 Battery performances of various SiNW-GN papers: (a) charge-discharge
cycles of the non-Al2O3 papers with different Si/C ratios tested at 100 mA g-1;
(b) rate capability of the non-Al2O3 papers; (c) charge-discharge cycles of the
Si1660GN paper following various cycles of Al2O3 coating tested at 100 mA g -1
; (d) rate capability of the Si1660GN paper following 10 cycles of Al2O3
coating...219
Figure 5-5 Characterization of the Si1660GN paper after test: (a)-(c) SEM images of the
non-Al2O3 Si1660GN paper; (d)-(e) SEM images of the 10C-Al2O3 Si1660GN
paper... ...221
Figure S5-1 A HRTEM image of graphene nanosheet from ultrasonicating graphite
oxide in water...227
Figure S5-2 SEM image of the Si NWs from Ag-assisted chemical etching of Si(100)
wafer... ...227
Figure S5-3 EDX mapping of the Si1660GN paper following 10 cycles of Al2O3...228
Figure S5-4 CV curves of a graphene paper (no Si NWs are present)...229
Figure S5-5 Charge-discharge cycles of the non-Al2O3 SiNW-GN papers with the same
Si/C ratio (0.3) but different mass tested at 100 mA g-1...230
Figure S5-6 Charge-discharge cycles of Si based materials tested at various
conditions………....230
Figure S5-7 The charge-discharge capacities of the non-Al2O3 Si1660GN and the
10C-Al2O3 Si1660GN paper normalized to Si NWs...231
……….….…….…….…...Chapter 6...……….…...
Figure 6-1 Schematic diagram for assembling the MoS2-graphene nanocomposites by
the vacuum-assisted filtration of MoS2 and graphene nanosheets………….235
Figure6-2 (a) XRD patterns of the commercial MoS2 powder and the 100MoS2-20GN
composite; (b) Raman spectra of the MoS2 nanosheets and the commercial
MoS2 powder...238
Figure 6-3 Electronic microscope images of the MoS2 nanosheets and the 60MoS2
-80GN nanocomposites: (a) SEM image of the MoS2 nanosheets; (b) TEM
image of MoS2 nanosheets; (c) HRTEM image of surface of the MoS2
nanosheets; (d) HRTEM image showing the thickness of the nanosheets; (e)
lower magnification of the 60MoS2-80GN nanocomposite; (f) higher
magnification of the 60MoS2-80GN nanocomposite...240
Figure6-4 Raman spectra of the MoS2-graphene nanocomposites...241
Figure 6-5 CV curves of the MoS2-containing samples: (a) the MoS2nanosheets; (b) the
60MoS2-80GN nanocomposites...244
Figure6-6 Electrochemical performances of the MoS2-containing samples...244
Figure 6-7 SEM images of the MoS2 nanosheets pasted on current collector before (a)
and after (b) test; the 60MoS2-80GN nanocomposites pasted on current
collector before (c) and after (b) test...248
Figure S6-1 Electronic microscope images of the graphene nanosheets (a) and the
60MoS2-80GN nanocomposite (b)...252
Figure S6-2 EDX mapping the 60MoS2-80GN nanocomposite: (a) SEM image; (b)-(d)
C, S, and Mo signals, respectively...252
Figure S6-3 SEM image of the 60MoS2-80GN nanocomposite after grind...253
Figure S6-5 Low-magnificence SEM image of the 60MoS2-80GN nanocomposite
electrode after test...254
……….….…….…….…...Chapter 7...……….……...
Figure 7-1 SEM images of the 1D silicon nanostructures obtained by etching -FeSi2
phase ferrosilicon alloy particles: (a) and (b) low-magnification images of the
products; (c) and (d) high-magnification images of the nano belts………...260
Figure 7-2 (a) Raman spectra of various silicon based samples; (b) EDX quantitative
analysis of the products; (c) and (d) SEM image and EDX mapping of the
nanobelts, respectively; (e) and (f) SEM image and EDX mapping of the
nanobelts bundles, respectively...261
Figure 7-3 The microstructures observed following etching the -FeSi2-phase
ferrosilicon alloy particles for different duration: (a)-(c) for 0 min, 0.5 min, 3
min, respectively; (d) and (e) 10 min; and (f) 3 h...262
Figure 7-4 The microstructures of the -FeSi2-phase ferrosilicon alloy particles that
were annealed at various temperatures for 20 h followed by etching for 5 min:
(a) 600 C, (b) 650 C, (c) 700 C, and (d) 800 C, respectively...264
Figure 7-5 SEM images of the products of the metallurgical grade ferrosilicon alloy that
was pre-annealed at various temperatures for 20 h: (a) and (b) 600 C, (c) and
(d) 700 C...264
Figure 7-6 Electrochemical performances of the 1D nano Si product: (a) CV curves, (b)
Charge/discharge profile within a voltage window of 0.01-1.5 V vs Li+/Li for the 1st, 10th and 20th cycles at 840 mA g-1, (c) rate capabilities, and (d) charge-discharge cycles...265
Figure S7-1 Phase diagram of the Fe-Si binary system (copied from J. Non-Crystal
Figure S7-2 XRD patterns of various ferrosilicon alloys with silicon contents higher
than stoichiometric value, i.e., >2...272
Figure S7-3 EDX mapping of NBs and NBs bundles from etching β-FeSi2 phase
ferrosilicon alloy particles...273
Figure S7-4 Typical SEM images of the products from etching various ferrosilicon
alloys by 11.5 wt% HF at RT for 3 h: (a) Fe55Si45; (b) -FeSi2 phase; and (c)
MG-Fe14Si86...273
Figure S7-5 SEM images of the products from etching commercial metal silicides by
11.5 wt% HF solution at RT for 5 h: (a) CaSi2; (b) WSi2; (c) CrSi2; and (d)
TiSi2... ...……….…………..……..274
Figure S7-6 (a) The -FeSi2 phase ferrosilicon alloy particles glued together by resin;
(b) the polished particles; and (c) a lower magnificent SEM image of the
polished surface after etching for 10 min... 275
Figure S7-7 SEM images of the surface of the glued -FeSi2 phase ferrosilicon alloy
particles (with no heat treatment) that were etched for different durations: (a)
before etching; (b) etched for 1 min; (c) and (d) etched for 5 min…...276
Figure S7-8 SEM images of the reaction products from of the -FeSi2 phase ferrosilicon
particles that were pre-annealed at various temperatures for 20 h: (a) 550 C,
(b) 600 C, (c) 650 C, (d) 700 C, (e) 800 C, and (f) 850 C,
respectively...277
List of
Appendice
Copy right permission...286
Chapter 1 Introduction
This chapter systematically introduces (a) the fundamentals of lithium ion batteries
(LIBs), their perspective and challenges; (b) the chemical routes for functionalizing
graphene and advances in the applications of the functionalized graphene in
electrochemical energy conversion and storage, including fuel cells, LIBs, and
supercapacitors; (c) the advances in flexible LIBs research, with focus on the
development of flexible electrodes; and (d) the recent research and development in
nanostructured Si anode materials. Besides these, the research objectives and the thesis
organization are also clearly highlighted.
1-1 Lithium ion batteries
1.1.1 Fundamentals of lithium ion batteries
Rechargeable lithium ion batteries (LIBs) are one of the typical electrochemical
energy storage devices, which convert chemical energy into electric energy and store it.
The first commercial LIBs were released by Sony in the second year of 1990s. The three
major electrochemically active components of a LIB are anode, electrolyte and cathode.
A schematic diagram of LIB is shown in Figure 1-1 [1]. The anode and cathode are
separated with a non-conductive polymer membrane which only allows Li ions to flow
across. The battery works with Li ions transferring between anode and cathode through
the electrolyte and with electrons flowing in the external circuit. For example, when
discharging, the Li ions stored in anode (e.g., LixC) will transfer across the separator to
be intercalated into cathode (e.g., LiCoO2). The equations (1) and (2) express the
reactions taking place on the electrodes of LIBs with carbon as an anode and LiCoO2 as
Anode: nLi++ne-1+CLiyC (2)
Intrinsically, the interactions of Li ions with electrode materials are intercalation in
the commercial LIBs. Both anode (mainly graphite) and cathode (LiCoO2,
LiNi1/3Mn1/3Co1/3O2 and LiFePO4) are materials with layered structures. Shown in
Figure 1-1 A schematic diagram of the structure of a traditional LIB (J. Mater. Chem.
A, 2014, 2, 9433).
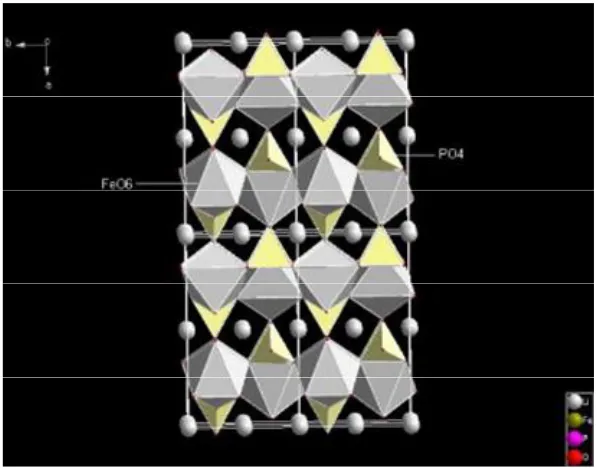
Figure 1-2 is the structure of LiFePO4 [2]. In the LiFePO4 framework, there are FeO6
-octahedra and PO4-tetrahedra. The FeO6-octahedra and PO4-tetrahedra are attached to
each other by sharing oxygen vertices in b-c plane. The FeO6-octahedra also shares an
edge with another PO4-tetrahedra. All the PO4-tetrahedra are separated from each other,
i.e., no atoms sharing. The FeO6-octahedra and PO4-tetrahedra form layered structure
and between the layers, lithium atoms are situated in the interstitial voids of the
framework, forming infinite chains along the c-axis in an alternate a-c plane.
The lithium storage capacity (expressed as The Maximum Theoretical Specific
Capacity (MTSE) of an electrode material is calculated by the equation (3) [3].
For an electrode reaction xA+R=AxR MTSE= (xE/Wt)F (3)
Here x is in equivalent per mole, E is in volts, Wt is in g mol-1 and F is Faraday constant,
i.e., 96500 Coulombs per equivalent, respectively. Experimentally, the capacity of an
electrode material is measured at a constant current, i.e., current (A) multiplying the
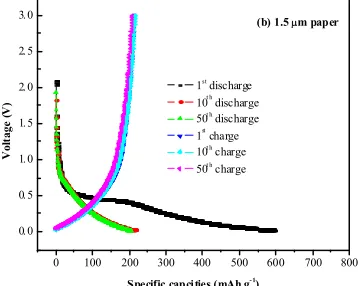
elapse time of charge (or discharge) gives rise to charge (or) discharge capacity. Figure
1-3 shows a typical charge-discharge profile for a graphene based anode material.
In addition to the lithium in storage capacity, another important parameter for
evaluating a battery system is the operating voltage. This can also be expressed in term
of open voltage. Depending on the output voltage, LIBs can be classified as [3]:
High quality energy (3.5-5.5 V)
Medium quality energy (1.5-3.5 V)
Low quality energy (0-1.5 V)
1.1.2 Perspective and challenges for lithium ion batteries
Electrochemical energy conversion and storage has been considered one of the most
important strategies to address the strong demand for clean energy supply. Being a
typical electrochemical device, LIBs have drawn extensive research interest. Figure 1-4
three major rechargeable battery systems [4]: lead acid, Ni-MH and Li-ion batteries.
Obviously, LIBs possess the highest energy density. After 20 years of extensive research
and development, many types of advanced LIBs are commercially available and are
being used in a wide spectrum of fields. The future global market for rechargeable is
huge; however, the challenges for the future research are also very big.
0 100 200 300 400 500 600 700 800 0. 0 0. 5 1. 0 1. 5 2. 0 2. 5 3. 0 V o lt a g e ( V )
Specific capci ties (mAh g- 1
)
1st discharge 10t h discharge 50t h
discharge 1st charge 10t h
charge 50t h
charge
(b) 1.5 m paper
1) The first challenge is to improve the energy capacities of LIBs so as to fulfill the
demand of the emerging markets, particularly, electric vehicles, large-scale
stationary electric energy storage and portable smart electronics, etc. So far, the
widely used electrode materials for LIBs are graphite (anode) and LiCoO2,
LiNiMnCoO2 and LiFePO4 (cathode). Their theoretical lithium storage capacities
are 372, 272 (140 when cycled between 3 and 4.2 V), 150 (3.5-5V) and 170 mA h g
-1
(2.5-4.2V), respectively [4], which are too low to meet the energy capacity
requirement of the new market. Therefore, it is highly necessary to seek alternative
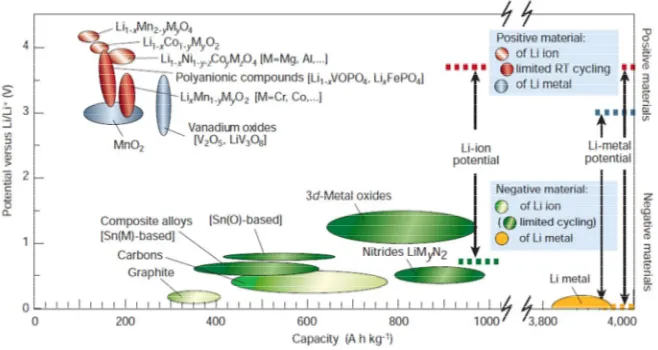
materials that possess higher theoretical capacities. Figure 1-5 also lists the
theoretical specific capacities of various electrode materials. It can be seen that the
cathode materials only offer limited capacities, i.e., <200 mA h g-1; while Sn, Si and Si-C composites can offer specific capacities higher than 1000 mAh g-1. Evidently, Figure 1-3 a typical charge-discharge
profile for a graphene based anode
material
Figure 1-4 Comparison of the
different battery technologies in terms
of volumetric and gravimetric energy
they possess the high potential to be used in the future LIBs. Of course, for cathode
materials, it is still attractive to increase the electrode potential so as to improve the
energy quality, as explained in section 1.1.1.
2) The second big challenge is to increase the life of the LIBs to at least 10 years. The
truth is that a LIB starts dying upon it leaves the factory. Even though the actual
lifespan of an unused LIB can vary based on its internal charge as well as the
external temperature, it is inevitable that the battery irreversibly loses 20% of its
charge capacity a year from its original date of manufacture. The solution to this
problem is strongly dependent on development of materials, optimizing battery
design and good control of the electrochemistry taking place in the battery.
3) Reducing the cost for electrode materials production is also a challenge. With the
advance in research and development, the cost for fabricating LIBs is declining
steadily. Today, the international LIB coat is $680 per kWh, which is still 4 times
the cost of Lead Acid battery [5].This greatly diminishes the competence of LIBs in
some markets.
Figure 1-5 Voltage versus capacity for positive- and negative-electrode materials
presently used or under serious considerations for the next generation of
4) Reduce cobalt and nickel material use, as both metals are highly costly and toxic to
the environment.
On the other hand, these challenges offer some opportunities for future LIBs research,
which in turn, will bring some breakthroughs toward the development of LIBs. As
compared to other types of rechargeable batteries, LIBs technologies are still younger,
and there are a lot of unknown. Future research should focus on the following aspects:
I) Understand the battery chemistry and optimize the cell engineering. For example,
one of the most difficult problems with utilizing the high-voltage cathodes (high
energy quality) is the instability of the organic electrolytes and the consequent side
reactions. With the selective use of the existing and new materials as anode, cathode
and electrolyte, special effort should be made to optimize the combination of
anode-electrolyte-cathode so as to minimize detrimental reactions associated with the
electrode-electrolyte interface, resulting in improved energy capacities and
increased lifespan.
II) Understand and improve the performances of the potential high-capacity electrode
materials, and put them into practical applications. Being different from the
Li-graphite interaction (intercalation), the interactions between the potential materials
(Si and Sn) and Li are mainly an alloying process, i.e., forming Li based alloys. This
reaction allows to store more than one Li ion per single transition metal atom (e.g.,
Li4.4Si), a new strategy for anodes with a high capacity. In practice, incorporating
these materials into commercial electrodes is yet realized. First, the huge volume
change of the metal/metal oxides occurs during the charge/discharge process,
leading electrode materials to be separated from each other and consequently the
loss of electrical connectivity among particles. The cycle life is poor. Table 1-1
tabulates some properties of the potential anode materials including volume change
[6,7]. It can be seen that the volume changes for Sn and Si are 260% and 320%,
respectively. Second, insulating Li2O (for SnO2) generated during the conversion
reaction steadily forms a barrier for electron transfer. This is a severe problem for
the electrode composed of µm-sized materials (Li can not diffuse into the bulk. The
that are delivered are low). Moreover, unlike the intercalation reaction, in which the
host structure is maintained, the conversion reaction requires complete structural
reorganization of lattices during electrochemical reaction. This causes large
polarization and can seriously affect the rate capability. This problem is expected to
be mitigated or solved by reducing the size of the materials so that the volume
change becomes relatively smaller and is easier to be accommodated by a suitable
substrate. In this regard, nanosized materials are considered one of the feasible
solutions.
III) Explore advanced materials characterization tools and methodologies and couple
them with computational modeling and simulation. LIBs are a complicated system
and all the battery processes are covered from our eyes, making it difficult to study
using the conventional characterization tools. In situ technologies are highly needed
for this research. Recently, computational modeling and simulation also exhibits its
power in anticipating some chemical processes that are not able to track using the
experimental approaches [8].
Table 1-1 Comparison of various anode materials (all the capacity numbers are based on
materials in the delithiated state except lithium metal, ref. 7).
1-2 The solutions with nanomaterials
Nanomaterial research is one of the fastest growing areas in materials science and
engineering. Ever since the concept of nano was introduced in the beginning of 1990s,
nanomaterials and nanotechnology have been penetrating almost every single field of
science and technology, particularly in the development of energy storage devices.
Nanomaterials are the structures with at least one dimension in the range of 1-100 nm.
(0D) (nanoparticles, quantum dots and fullerene), one-dimensional (1D) (nanotubes,
nanowires, nanorod, nanofibers and nanobelts) and two-dimensional (2D) (nanofilms,
nanowalls and graphene). Nanomaterials exhibit distinctly different physical and
chemical properties from those of a single atom (molecule) and bulk materials with the
same chemical composition.
For LIBs applications, the nanomaterials offer many evident advantages, as
summarized by Jean-Marie Tarascon [1], including:
1) In the nanometer scale, some electrode reactions, which cannot take place to the
materials with particle sizes beyond micrometers, will proceed effectively. But, it
should be mentioned that not all the reactions are positive.
2) The nanosized electrode materials provide shorter paths for lithium ion transport
within them and hence, significantly increase the rate of lithium intercalation and
decalation. This improves the rate capability of the battery.
3) The nanometer-sized particles also facilitate electron transportation within the
particles, improving the rate capability of the battery.
4) The nanosized materials usually possess relatively higher surface areas, enabling
an most effective electrolyte-electrode contact and hence, a high lithium-ion flux
across the interface. But, it should be mentioned that this may also induce some
negative side reactions.
5) For nanosized particles, the chemical potentials for lithium ions and electrons
may be modified, resulting in a change in electrode potential.
6) The nanoparticles allow formation of extensive range of solid state compositions,
and the strain associated with lithium ion intercalation is often better
accommodated.
As such, nanomaterials for LIBs are one of the hottest topics in electrochemical
1-3 Introduction to graphene in electrochemical energy conversion and
storage (EECS)*
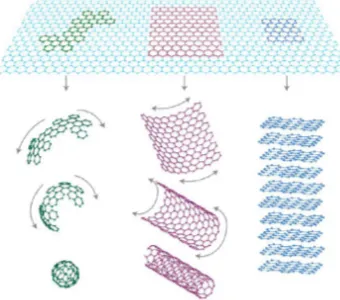
Graphene is a one-atom-thick planar sheet consisting of sp2 carbon atoms that are densely packed in a honeycomb crystal lattice [9], as shown in Figure 1-6. Graphene has
many unique properties such as high surface area, high electronic conductivity, high
Young’s modulus, highthermal conductivity and high optical transmittance [10,11].
Thus, graphene is considered a versatile building material for fabrication of
electrochemical devices. Ever since the mechanical exfoliation of single-layer graphene
from graphite succeeded in 2004, graphene has been receiving extensive research
interest in EECS. The introduction of graphene brings some innovative properties to the
electrochemical devices. Many review papers have focused on this topic [10,12,13].
Pristine graphene, which is composed of only sp2 atoms, is a zero-gap semiconductor, and its Fermi level exactly crosses the Dirac point. For practical
application, an energy gap is essential and thus, it is necessary and crucial to develop
new methods to precisely control the carrier type and concentration in graphene for
further development of graphene-based devices. Normally, graphene has two oxidation
states: graphene oxide (GO) and reduced graphene oxide (RGO). GO is water soluble
with low electronic conductivity, while RGO reveals good conductivity but poor
solubility in water. The excellent solubility of GO in aqueous solution is primarily due to
its rich oxygen-containing and hydrophilic groups, such as hydroxyl, epoxide, carboxyl
and carboxylic. Upon reduction, most of the oxygen-containing groups, in particular the
hydroxyl, epoxide and carboxyl, will be completely removed. Thus, GO will then be
converted to -conjugation-rich graphene, i.e., RGO. The -conjugation in graphene
sheets (GNS) can restore the conductivity of graphene but reduces its solubility in water
and other organic solvents. The decline in solubility may inevitably reduce
processability of graphene and therefore limit its applications. All these render
functionalization of graphene highly desirable.
* This part was pusblished as a book chapter in the book of "Advances in Graphene
Functionalization of graphene is one of the key topics in graphene research. Generally,
there are two main categories of functionalization: chemical and nonchemical. Chemical
functionalization is realized through the formation of new covalent bonds between the
atoms native to RGO/GO and the guest functional groups; in contrast, nonchemical
functionalization is mainly based on interaction between guest molecules and
RGO/GO, i.e., mainly a physical interaction. Both types of functionalization can induce
some property changes for graphene, but the chemical routes are more effective. So far,
various chemical routes have proposed, which successfully incorporate a large number
of different atoms/organic group into graphene, including heterogeneous atoms doping,
diazonium coupling, amidation, silanization, esterization, substitution, cycloaddition,
etc. Research results also demonstrated that the size of graphene (particularly the
thickness of the ribbons) strongly affects the reactivity of graphene and the application
of the functionalized graphene [14,15]. The thinner, the more reactive the sheets are.
Moreover, it is also confirmed that carbon atoms on the ribbon edge are more reactive
than those in the middle of the ribbon [14,15]. The chemical functionalization greatly
alters the electric conductivity of graphene and introduces some defect sites,
significantly affecting the application of the functionalized graphene in EECS
applications. So far, heterogeneous atoms doping evidently improves the electric
conductivity of graphene and hence, the resulting functionalized graphene is widely
investigated [16,17]; on the other hand, incorporation of organic groups into graphene
reduces the electric conductivity, preventing its electrochemical applications.
Figure 1-6 Schematic diagrams of
graphene and graphene-based 0D, 1D
and 3D structured carbon (Nature
In this part, the chemical routes for functionalizing graphene and the advances in the
applications of the functionalized graphene in EECS, including FCs, LIBs and
supercapacitors are summarized. Noticeably, chemical functionalization of graphene is a
big field that involves organic chemistry/polymer chemistry, and various kinds of
organic molecules have been chemically anchored onto graphene. This part addresses
this in term of what kind of typical organic reaction is adopted for the functionalization.
The organic reactions are easy to understand and follow. For each reaction, the most
original and representative studies are introduced. Moreover, a large number of
references are involved in this topic, which can not be listed totally due to the page limit.
Hence, only the references that are strictly about functionalized graphene and their
applications are provided here. Finally, research in this field is advancing quickly, thus, I
just introduce some original studies and some new results might not be addressed.
1-3-1 Chemical functionalization of graphene
Generally, the functionalization is realized in two ways. The first is to dope
heterogeneous atoms onto the basal plane (form covalent bond directly with C atoms of
graphene), mainly tuning the electronic structure and introducing defect sites; the second
is to establish covalent bond between the functional group native to GO and the guest
functional group. Various kinds of functional groups have been chemically anchored
onto graphene, giving rise to a diversity of graphene based nanocomposites that were
widely investigated in various applications. In this part, I will provide a comprehensive
picture for this subject in term of how the covalent bonds are formed.
1.3.1.1 Characterization of the functionalized graphene
Chemical functionalization is a chemical (or electrochemical) process that proceeds
at an atomic/molecular level. Raman, Infra red spectroscopy (IR), X-ray photoemission
spectrometry (XPS), High resolution transmission electric microscopy (HRTEM),
Atomic force microscopy (AFM), and Cyclic voltammetry (CV) are the typical
instruments that are widely employed for understanding the properties resulting from the
functionalization. Raman and IR are sensitive to the formation and change of chemical
they also allow semi-quantity analysis. XPS is the powerful instrument for
functionalized graphene characterization in terms of both qualification and quantization.
For example, XPS can provide decisive information on how many N atoms are doped
into graphene and the types of the doped N atoms. HRTEM can tell how the morphology
and structure changes following chemical functionalization. AFM can show the
thickness and the morphology of graphene. CV measurement is a direct electrochemical
method for understanding the electrochemical properties resulting from the
functionalization, a topic of the focus in this chapter.
Table 1-2 A summary of the chemical routes for functionalization of graphene by
heterogeneous atoms doping
Guest functional
group
Chemical process References
CVD [21-24]
N-plasma or N+-ion irradiation [25,26]
Arc discharge [27,28]
Electrothermal reactions [30]
N atoms
Chemical synthesis [31-33]
B atoms CVD [28,34]
Chemical synthesis [35]
S atoms
Pyrolysis [36,75]
F atoms Arc discharge [37]
Heterogeneous-atom doping is one of the most important approaches to chemically
functionalize graphene, and such an approach mainly alters the electric properties of
graphene. Understanding the electric properties of the doped graphene is a hot topic in
physics and semiconductors, for which the studies usually take a combination of
experimental measurement and computer simulation. As a typical example, Novoselov
and Geim, the two Nobel Prize laureates in 2010 because of graphene, did some pioneer
research on this topic. In 2008, they chose the NO2 system providing both open-shell
single molecules and closed-shell dimers N2O4 to study the doping due to adsorbates by
combining ab initio theory with transport measurements [18]. A general relation
between the doping strength and whether adsorbates are open- or closed-shell systems is
demonstrated with the NO2 system: The single, open shell NO2 molecule is a strong
acceptor (attracts electrons from graphene), whereas its closed shell dimer N2O4 causes
only weak doping. This effect is pronounced by graphene's peculiar density of states
(DOS), which provides an ideal situation for model studies of doping effects in
semiconductors.
Strictly speaking, GO, which contains a variety of heterogeneous atoms or groups
such as -O, -COOH, and -OH, is a typical functionalized graphene. But due to the low
electronic conductivity, their application in EECS is limited and hence, there are few
studies focusing on GO in this field. Nevertheless, these functional groups play
important roles in the chemical functionalization of gaphene. Considering these, I take
GO as graphene. Doping atoms, such as N, B, P and S and chlorides, into graphene is
highly desired because the doping effectively converts graphene from gapless structure
to semiconductor. The resultant functionalized graphenes are either p-type or n-type,
depending on the electronic structure of the guest atoms. Moreover, the doping also
induced more defect sites that facilitate deposition of other electrochemically functional
components (e.g., growth of Pt on graphene) and stabilize them. Theoretically, all these
atoms can be covalently bonded to graphene. However, in practice, doping N is much
easier than doping other elements, and has received more extensive attention. Success in
B, S and F doping is reported recently. To make this part more understandable, Table
N-doped graphene
N doping gives rise to n-type (negative) graphene. The well-bonded nitrogen atoms
improve the electronic conductivity and offer more active sites (defects). Nitrogen
doping has proved to be an effective method to improve both the microstructure and the
electrochemical properties of graphene. So far, many chemical routes have been
developed for synthesis of N-doped graphene (N-graphene), including chemical vapour
deposition (CVD), N-plasma treatment, arc discharge, electrothermal reaction,
eletrochemical reaction, chemical synthesis, etc. Now, CVD and chemical synthesis are
more widely adopted for relatively larger-scale production.
I CVD method
Chemical incorporation of nitrogen atoms into graphite by CVD method was first
reported by Johansson, et al., in 1990s. Now, CVD has become one of the important
methods for synthesizing carbon based nanomaterials including the graphene and
N-graphene. A typical CVD process involves three key components, i.e., catalyst, reactants
and high temperature. The mechanism can be expressed as following [19-21]: (I) at high
temperature (e.g., >800 C) the catalyst (transition metals) is liquidized, acting as the
catalytic sites for absorption and dissociation of the gas reactants including N-containing
reactant (mainly NH3), (II) the catalyst becomes saturated with the atoms/fragments
from the dissociation of the reactants and hence; (III) solid graphitic carbon (graphene
layers) grows from the saturated catalyst by means of precipitation, with the adsorbed N
atoms precipitating into the graphitic lattice, giving rise to N-doped carbon. The CVD
synthesis of N-graphene succeeded in 2009 [21]. In principle, a Cu film grown on a Si
substrate was employed as the catalyst. The substrate was placed in a quartz tube with a
flow of hydrogen and argon. When the center of the furnace reached 800 °C, CH4 and
NH3 were introduced into the flow as the carbon source and nitrogen source
respectively, and then the substrate was rapidly moved to the high temperature region.
After 10 min of growth, the sample was cooled to room temperature under H2 ambient.
Most of the products are few-layer graphene, and single-layer graphene can be