P a g e | 395
Power Quality Improvement in Distribution
System Using D-Statcom
JANARDHAN REDDY MIDDALA
Abstract — This paper presents the enhancement of voltage sags, harmonic distortion and low power factor using Distribution Static Compensator (D-STATCOM) with LCL Passive Filter in distribution system. The model is based on the Voltage Source Converter (VSC) principle. The D-STATCOM injects a current into the system to mitigate the voltage sags .LCL Passive Filter was then added to D-STATCOM to improve harmonic distortion and low power factor. The simulations were performed using MATLAB SIMULINK version R2007b.
Keywords- D-STATCOM, Voltage Sags, Voltage Source Converter (VSC), LCL Passive Filter, Total harmonics Distortion (THD)
I. INTRODUCTION
An increasing demand for high quality, reliable electrical power and increasing number of distorting loads may leads to an increased awareness of power quality both by customers and utilities. The most common power quality problems today are voltage sags, harmonic distortion and low power factor. Voltage sags is a short time (10 ms to 1 minute) event during which a reduction in r.m.s voltage magnitude occurs [4]. It is often set only by two parameters, depth/magnitude and duration. The voltage sags magnitude is ranged from 10% to 90% of nominal voltage and with duration from half a cycle to 1 min.
Voltage sags is caused by a fault in the utility system, a fault within the customer’s facility or a large increase of the load current, like starting a motor or transformer energizing [2, 3].Voltage sags are one of the most occurring power quality problems. For an industry voltage sags occur more often and cause severe problems and economical losses. Utilities often focus on disturbances from end-user equipment as the main power quality problems [5].
Harmonic currents in distribution system can cause harmonic distortion, low power factor and additional losses as well as heating in the electrical equipment. It also can cause vibration and noise in machines and malfunction of the sensitive equipment.
The development of power electronics devices such as Flexible AC Transmission System(FACTS) and customs power devices have introduced and
emerging branch of technology providing the power system with versatile new control capabilities [1].There are different ways to enhance
Power quality problems in transmission and distribution systems. Among these, the D-STATCOM is one of the most effective devices. A new PWM-based control scheme has been implemented to control the electronic valves in the DSTATCOM. The D-STATCOM has additional capability to sustain reactive current at low voltage, and can be developed as a voltage and frequency support by replacing capacitors with batteries as energy storage. [6, 7]
In this paper, the configuration and design of the DSTATCOM with LCL Passive Filter are analyzed. It is connected in shunt or parallel to the 11 kV test distribution system. It also is design to enhance the power quality such as voltage sags, harmonic distortion and low power factor in distribution system.
II. DISTRIBUTION STATIC COMPENSATOR (D-STATCOM)
P a g e | 396
Referring to the equation 2.2, output current,
I
out will correct the voltage sags by adjusting the voltage drop across the system impedance, (Z
th=R+jX). It may be mention that the effectiveness of D-STATCOM in correcting voltage sags depends on:a) The value of Impedance,
Zth
= R+jX
b) The fault level of the load busFigure2.1. Schematic diagram of a D-STATCOM
A. Voltage Source Converter (VSC)
A voltage-source converter is a power electronic device that connected in shunt or parallel to the system. It can generate a sinusoidal voltage with any required magnitude, frequency and phase angle. The VSC used to either completely replace the voltage or to inject the ‘missing voltage’. The ‘missing voltage’ is the difference between the nominal voltage and the actual. It also converts the DC voltage across storage devices into a set of three phase AC output voltages [8, 9].
In addition, D-STATCOM is also capable to generate or absorbs reactive power. If the output voltage of the VSC is greater than AC bus terminal voltages, D-STATCOM is said to be in capacitive mode. So, it will compensate the reactive power through AC system and regulates missing voltages. These voltages are in phase and coupled with the AC system through the reactance of coupling transformers.
Suitable adjustment of the phase and magnitude of the DSTATCOM output voltages allows effectives control of active and reactive power exchanges between D-STATCOM and AC system. In addition, the converter is normally based on some kind of energy storage, which will supply the converter with a DC voltage [10].
B. Controller
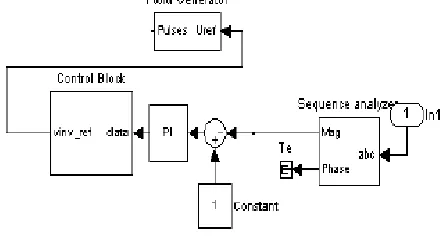
Figure 2.2 shows the block diagram of Controller system. The controller system is partially part of distribution system.
Figure 2.2.Block Diagram of Controller System
Proportional-integral controller (PI Controller) is a feedback controller which drives the system to be controlled with a weighted sum of the error signal (difference between the output and desired set point) and the integral of that value.
In this case, PI controller will process the error signal to zero. The load r.m.s voltage is brought back to the reference voltage by comparing the reference voltage with the r.m.s voltages that had been measured at the load point. It also is used to control the flow of reactive power from the DC capacitor storage circuit.
PWM generator is the device that generates the Sinusoidal PWM waveform or signal. To operate PWM generator, the angle is summed with the phase angle of the balance supply voltages equally at 120 degrees. Therefore, it can produce the desired synchronizing signal that required. PWM generator also received the error signal angle from PI controller. The modulated signal is compared against a triangle signal in order to generate the switching signals for VSC valves.
C. Energy Storage Circuit
Figure 2.3: circuit diagram of DC storage
P a g e | 397
converter and it is the main reactive energy storage element. This DC capacitor could be charged by a
battery source or could be recharged by the converter itself.
D. LCL Passive Filter
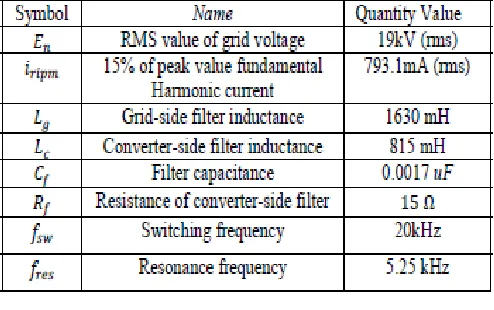
LCL Passive filter is more effective on reducing harmonic distortion. To design it, equation (2.3), 2.4) and (2.5) are used.
To design an efficient LCL Passive filters make sure that,
Figure 2.4.circuit diagram for single phase LCL Passive Filter
TABLE2.1. LIST AND VALUE OF PARAMETERS USE IN SIMULATION
Figure 2.5 shows the input current harmonic spectrum with respect to the IEEE STD 519-1992 harmonic limits.
Figure2.5.IEEE STD 519-1992 of current Harmonic spectrum.
III. METHODOLOGY
P a g e | 398
Figure3.1.Flowchart for the methodology
A. Test System
Figure3.2.Single line diagram of the test system
The test system shown in figure 3.2 comprises a 230kV, 50Hz transmission system, represented by a The venin equivalent, feeding into the primary side of a 3-winding transformer connected in Y/Y/Y, 230/11/11 kV. A varying load is connected to the 11 kV, secondary side of the transformer. A two-level D-STATCOM is connected to the 11 kV tertiary winding to provide instantaneous voltage support at the load point. A 750 μF capacitor on the dc side provides the D-STATCOM energy storage capabilities. Breaker 1 is
used to control the period of operation of the D-STATCOM and breaker 2 is used to control the connection of load 1 to thesystem.
B. Simulink Model for the test system
The test system was design using MATLAB Simulink is shown in figure 3.3 below.
Figure3.3.Diagram of the test system
IV. RESULTS AND DISCUSSION
To create distortion in the distribution system, different types of fault such as Three Phase to Ground (TPG), Double Line to Ground (DLG), Line to Line (LL), and Single Line to Ground (SLG) are injected.
A. Without insertion of D-STATCOM
P a g e | 399
Table 4.1 shows the overall results of voltage sags in p.u for different types of fault. From the table, it can be observed that when the value of fault resistance is increase, the voltage sags will also increase for different types of fault.
Figure4.1(a).voltage at load point is 0.6600 p.u
Figure4.1(b).voltage at load point is 0.7070 p.u
Figure4.1(c).voltage at load point is 0.7487 p.u
Figure4.1(d).voltage at load point is 0.8259 p.u
Figure 4.1(a) to 4.1(d) show the simulation results of the test system for different types of fault. The fault occur during (500-700ms) when the fault resistance,
R
f =0.66 Ω.B. With insertion of D-STATCOM
TABLE4.2. RESULTS OF VOLTAGE SAGS FOR DIFFERENT TYPES OF FAULT.
Table 4.2 shows the overall results of voltage sags in p.u with different types of fault. From the table, it can be observed that voltage sags improved with insertion of D-STATCOM. The value of voltage sags is between (0.9 to 1.02 p.u.)
Figure4.2(a).voltage at load point is 0.9367 p.u
Figure4.2(b).voltage at load point is 0.9800 p.u
P a g e | 400
occurs during (500-700ms) when the fault resistance is 0.66 Ω.
TABLE4.3. RESULTS FOR DIFFERENT TYPES OF FAULT BEFORE AND AFTER INSERT D-STATCOM WHEN
R
f = 0.66ΩFrom table 4.3 it can be seen that with D-STATCOM the voltage sags has improved close to 1.0 p.u.
C. D-STATCOM without LCL Passive Filter
TABLE4.4. RESULTS OF CURRENT HARMONIC FOR DIFFERENT TYPES OF FAULT WITHOUT LCL PASSIVE
FILTER
Table 4.4, shows the current harmonic for different types of fault. The percentage of THD shows that it is not within the IEEE STD 519-1992. The percentage of power factor is low in the range of 74.79 to 91.34 lagging.
Figure4.3.waveform of distortion output current without LCL Passive Filter
Figure 4.3, shows the waveform of distortion output current and figure 4.4 shows the spectrum of distortion output current.
Figure4.4.harmonic spectrum of distortion output current without LCL Passive Filter
D. D-STATCOM witht LCL Passive Filter
TABLE4.5. RESULTS OF CURRENT HARMONIC FOR DIFFERENT TYPES OF FAULT WITHOUT LCL PASSIVE
FILTER
Table 4.5, shows that with LCL Passive filter, the Percentage of THD has reduced. Now the THD is within the IEEE STD 519-1992. The power factor increases close to unity.
Figure4.5.waveform of output current with LCL Passive Filter
P a g e | 401
the DSTATCOM. Figure 4.6 shows the spectrum of output current.
Figure4.6.harmonic spectrum of output current with LCL Passive Filter
V. CONCLUSION
The simulation results show that the voltage sags can be mitigate by inserting D-STATCOM to the distribution system. By adding LCL Passive filter to D-STATCOM, the THD reduced within the IEEE STD 519-1992. The power factors also increase close to unity. Thus, it can be concluded that by adding D-STATCOM with LCL filter the power quality is improved.
VI. REFFERENCES
[1] A.E. Hammad, Comparing the Voltage source capability of Present and future Var Compensation Techniques in Transmission System, IEEE Trans, on Power Delivery . volume 1. No.1 Jan 1995.
[2] G.Yalienkaya, M.H.J Bollen, P.A. Crossley, “Characterization of Voltage Sags in Industrial Distribution System”, IEEE transactions on industry applications, volume 34, No. 4, July/August, PP.682-688, 1999
[3] Haque, M.H., “Compensation Of Distribution Systems Voltage sags by DVR and D-STATCOM”, Power Tech Proceedings, 2001 IEEE Porto, Volume 1, PP.10-13, September 2001.
[4] Anaya-Lara O, Acha E., “Modeling and Analysis Of Custom Power Systems by PSCAD/EMTDC”, IEEE Transactions on Power Delivery, Volume 17, Issue: 2002, Pages: 266-272.
[5] Bollen, M.H.J.,”Voltage sags in Three Phase Systems”, Power Engineering Review, IEEE, Volume 21, Issue :9, September 2001, PP: 11-15.
[6] M.Madrigal, E.Acha., “Modelling OF Custom Power Equipment Using Harmonics Domain Twchniques”,IEEE 2000
[7] R.Meinski, R.Pawelek and I.Wasiak, “Shunt Compensation For Power Quality Improvement Using a STATCOM controller Modelling and Simulation”, IEEE Proce, Volume 151, No. 2, March 2004.
[8] J.Nastran, R. Cajhen, M. Seliger, and P.Jereb,”Active Power Filters for Nonlinear AC loads, IEEE Trans.on Power Electronics Volume 9, No.1, PP: 92-96, Jan 2004.
[9] L.A.Moran, J.W. Dixon, and R.Wallace, A Three Phase Active Power Filter with fixed Switching Frequency For Reactive Power and Current Harmonics Compensation, IEEE Trans. On Industrial Electronics. Volume 42, PP:402-8, August 1995.
[10] L.T. Moran, P.D Ziogas, and G.Joos , Analysis and Design Of Three Phase Current source solid State Var Compensator, IEEE Trans, on Indutry Applications. Volume 25, No.2, 1989, PP:356-65