Copyright 0 1990 by the Genetics Society of America
The Passover Locus in Drosophila melanogaster:
Complex Complementation and Different Effects
on the
Giant Fiber Neural Pathway
Douglas H. Baird,’ Abraham P. Schalet and Robert J. Wyman
Department of Biology, Yale University, New Haven, Connecticut 0651 1
Manuscript received January 3, 1990 Accepted for publication September 5, 1990
ABSTRACT
Drosophila melanogaster bearing the Passover mutation fail to jump in response to a light-off stimulus. Pas also disrupts some of the synapses between the neurons of the giant fiber system which mediate this escape behavior. We have mapped Pas to the 19E subdivision of the polytene X chromosome. Our genetic analyses reveal that deletions of either of two nonoverlapping regions fail to fully complement Pas. Heterozygotes of Pas with chromosomal deletions in the vicinity of polytene band
19E3 exhibit the full set of neuronal defects shown by Pas homozygotes. Alleles of the R-9-29 complementation group, which maps to band 19E3, exhibit a complex pattern of complementation with Pas. Heterozygotes combining the lethal R-9-29 alleles with Pas are all viable, some complement the neuronal defects of Pas, but most exhibit these defects. The viable shaking-B2 mutation also fails to complement Pas, the R-9-29 alleles or the 19E3 deficiencies. The R-9-29 locus may contain two functional domains, one required for viability the other for normal neuronal phenotype. trans- Heterozygotes bearing mutant alleles or a deficiency of the first region (19E3) together with deficiencies of the second region (19E5-6) also exhibit some of the neuronal defects shown by the Passover mutant. Deficiencies which delete the entire 19E3 to 19E6 interval do not produce this phenotype when heterozygous with a normal X chromosome. Th us normal function requires a cis-
interaction between the two regions. These findings raise the possibility that the gene mutated by Pas is split or separated from a cis-activator by at least one other gene.
W
HEN startled by a light-off stimulus, wild-typeflies jump into the air and fly away. This escape response is mediated by the giant fiber system (GFS),
a small group of neurons that channel visual input from the head to some of the muscles of the thorax
(KING and WYMAN 1980; TANOUYE and WYMAN
1980; KING and TANOUYE 1983; TANOUYE and KING
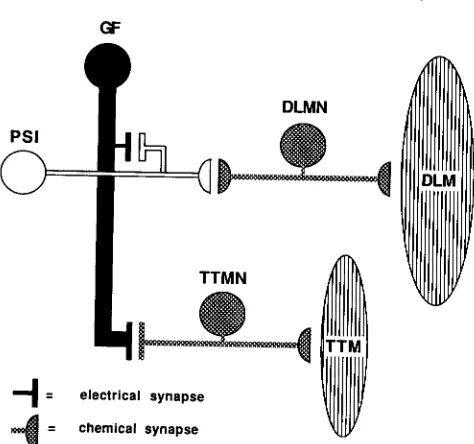
1983). A schematic representation of the giant fiber
(GF) is shown in Figure 1. The GFs are the axons of a bilaterally symmetrical pair of interneurons with their cell bodies in the posterior, lower protocerebrum
of the brain (KOTO et al. 1981). Each GF descends from the brain and enters the mesothoracic neurom- ere of the thoracic ganglion, where it synapses with two identified neurons. One of these cells, named the
peripherally synapsing interneuron (PSI), has an axon
which exits the ganglion and connects, in the periph-
eral nerve, with the motor neurons of the dorsal
longitudinal muscles (DLMs). T h e dorsal longitudinal muscles are the wing depressor muscles that power flight along with the wing elevating dorsal ventral
muscles. The GF also synapses directly with the motor
neuron of the tergotrochanteral muscle (TTM) which extends the mesothoracic leg during jumping.
and ’ Surgeons of Columbia University, 630 West 168th Street, New York, Present address: Department of Pathology, The College of Physicians New York 10032.
Genetics 1 2 6 1045-1059 (December, 1990)
A fixed pattern of spikes in the motor neurons and muscles (Figure 2A) is seen during a light-off induced
escape response (THOMAS and WYMAN 1984; WYMAN
et al. 1984, 1985). Intracellular or extracellular elec- trical stimulation of the GF in the brain of wild-type flies activates the circuit described above and produces the same sequence. This set of spikes is termed the “GF response.” In wild-type flies the circuit functions with extreme rapidity and reliability.
Mutations which disrupt synaptic connections in the GFS have been isolated in
D.
melanogaster by screening for flies lacking the escape response (THOMAS andWYMAN 1982, 1984). These mutants fail to jump in response to a light-off stimulus and correspondingly
the TTM and DLM respond abnormally to GF stim-
ulation. T h e Passover mutation disrupts the pathway to the dorsal longitudinal muscles, as well as the path-
way to the tergotrochanteral muscles (THOMAS and
WYMAN 1984). T h e Passover mutation was originally denoted non-jumping ( n j ) 156 (THOMAS 1980) and
then passover (THOMAS and WYMAN 1984). We capi-
talize the name due to the dominant behavioral effects described in this paper. In homozygous Pas flies brain
stimulation elicits no response from the DLMs and
1046
GF
D. H. Baird, A.P. Schalet and R. J. Wyman
= chemical synapse
FIGURE 1.-Schematic representation of the neurons and mus- cles of the GFS. GF = giant fiber, PSI = peripherally synapsing
interneuron, D L M N = dorsal longitudinal motor neuron, T T M N
= tergotrochanteral motor neuron, DLM = dorsal longitudinal
muscle (an indirect flight muscle), TTM = tergotrochanteral muscle
(or "jump" muscle).
sponses of the muscles to electrical stimulation of the dorsal longitudinal motor neurons (DLMNs) and the tergotrochanteral motor neuron ( T T M N ) are normal. These results indicate that there are abnormalities in the synapses between the GF and the neurons it acti- vates (THOMAS and WYMAN 1984). T h e anatomical nature of the defects are currently under investigation
(EGGER et al. 1989; SWAIN, WYMAN and EGCER 1990).
THOMAS and WYMAN (1 984) originally mapped Pas proximal to forked by recombination and then estab- lished that the Pas mutation is located at the base of the X chromosome in the region deleted by deficiency 16-3-22. This deficiency removes approximately 18 polytene bands extending from the maroonlike locus in subdivision 19D through the extra organs locus in subdivision 20A (SCHALET and LEFEVRE 1976). T h e proximal X chromosome has been the focus of inten- sive cytogenetic analysis (LIFSCHYTZ and FALK 1968,
1969; SCHALET and LEFEVRE 1973, 1976; LIFSCHYTZ and YAKOBOVITZ 1978; KRAMERS et al. 1983; PARADI, VOGEL and SZILAGYI 1983; EEKEN et al. 1985; ZUS-
MAN, COULTER and GERGEN 1985; LEFEVRE and WAT-
KINS 1986; SCHALET 1986; GREEN, YAMAMOTO and
MIKLOS 1987; MIKLOS et a l . 1987, 1988; YAMAMOTO and MIKLOS 1987). These studies provide an extensive base of genetic data with which to define and analyze the Passover locus.
That Passover lies in a region with abundant genetic variants and affects an easily assayed circuit of identi- fied neurons affords unique experimental advantages in linking genetic and neuronal defects. T h e combi- nation of high genetic and neuronal resolution have allowed us to demonstrate complex complementation
and selective disruption of different parts of the GFS
by different genetic lesions.
MATERIALS AND METHODS
Stocks: Drosophila melanogaster stocks were maintained at 22-26' on standard food medium consisting of 82.5% water, 6.5% corn meal, 0.74% agar, 1.6% yeast, 8.7% molasses. Either 0.56% propionic acid, or 0.87% Tegosept was added to prevent the growth of mold. Control and experimental genotypes were constructed using crossing procedures similar to those of MIKLOS et a l . (1987). Some of the deficiency-bearing chromosomes as well as the lethal and visible alleles of the genetic complementation groups in subdivision 19E have been previously described (LIFSCHYTZ
and FALK 1968, 1969; SCHALET and LEFEVRE 1973, 1976;
MIKLOS et al. 1987). Many others are from the unpublished collections of GEORGE LEFEVRE and ABRAHAM SCHALET and have been extensively tested both intra and inter se in genetic complementation tests. Balancer X chromosomes, such as
FM6 (LINDSLEY and ZIMM 1990), as well as Y chromosomes bearing translocated portions of the base of the X (y+Yma1'06)
have been described earlier (SCHALET and LEFEVRE 1976). Behavioral test of the escape response: THOMAS and WYMAN (1984) found that flies with phenotypically white eyes respond more often than flies with wild-type eye color; of the combinations of mutations that cause white eyes, the
brown; scarlet double homozygote responded most reliably. Therefore, all testing was performed on flies homozygous for the autosomal mutations brown and scarlet, along with the X chromosome mutation(s) under study. A modified version of the testing methods of THOMAS and WYMAN (1 984) were used to assess the escape response to a light-off stimulus. Flies were placed individually under transparent plastic Petri dishes in a box made of white poster board. The top of the box was removed to admit light, and one side of the box was removed to view the fly's response. A sudden change in the fly's position within the dish after a brief light-off stimulus was taken to indicate a response. If the fly was walking or jumping immediately before the stimulus, the response to that stimulus could not be reliably scored, and was therefore not counted. The number of responses to 20 such stimuli was recorded to measure the response probability of a single fly. T o test the effect of a given genotype, several individuals were examined, usually interspersed with control flies of genotype brown; scarlet
which responded about 90% of the time.
Electrical stimulation of the neurons of the GFS and monitoring of muscle potentials: Most of the results in this paper are descriptions of the muscular response to stimula- tion that activates the GF. Electrical stimulation of the GFS produces the same escape response elicited by the light-off
stimulus described above (THOMAS and WYMAN 1984). The
Passover Locus in Drosophila 1047
RDLM
LDLM
RTTM
LTTM
I
“
I
Oregon-R
Pas
C 4
RDLM
-(-LDLM
-
, J - / e ,
shak
B2/ Df(l)T2-14A
shak
B~
mV0.5 ms
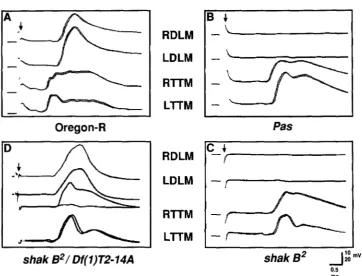
FIGURE 2.-Electrophysiology of the GF pathway: the reponse to brain stimulation of the jump and flight muscles. The fly is impaled with four recording electrodes, two stimulating electrodes and a ground. The four traces of each panel are records from the right and left wing depressor muscles (DLMs) (top two traces) and the right and left jump muscles (TTMs) (bottom two traces). Each record consists of the superimposed responses to two stimuli; in some records slight shifts allow both response traces to be seen separately, in others the two responses superimpose completely. Down arrows indicate the end of the stimulus pulse, the artefact of which can be seen beneath and to the left of the position of the arrow in each trace. Oscilloscope traces were digitized into a MacIntosh 11 computer for preparation of the figures.
Horizontal scale bar is 0.5 msec. Vertical scale bar is 20 mV for the top two traces of panel A, 10 mV for all other traces. A, Oregon-R.
Example of normal response of DLM and TTM muscles to brain stimulation. Note how TTM response precedes DLM response, and all four
muscles respond to both shocks; there are no failures. B, Pas. Example of severe phenotype. Note the absence of response from the DLM
muscles. The response of the T T M is delayed from that seen with 0 - R in panel A. C, shakB2. Note similarity of response to Pas in panel B,
ie., absence of DLM response and delayed TTM response. D, shakBZ/Df(I)T2-14A. Example of “mild” phenotype. DLMs respond to both
stimuli with approximately normal latency. The T T M s do not always respond: in this record, the right TTM (third trace) responded only
once to the two shocks (double- headed arrow). When it does respond, the TTM is delayed. Its latency is now about the same as the DLM
latency rather than shorter as in Oregon-R (panel A).
T h e DLM electrodes were placed just medial to the anterior dorso-central bristles, whereas the TTM electrodes were placed just dorso-medial to the supra-alar bristles. The mo- tor neurons of the GFS in the thoracic ganglion were stimulated by applying voltage pulses to electrodes inserted into the left and right dorsal ventral muscle (DVM 11,
TANOUYE and WYMAN 1980). Stimulus electrodes in this position were found to produce the short latency response characteristic of direct motor neuron stimulation using a low stimulus voltage. In either stimulus configuration, the recording electrodes were connected to the vertical ampli- fier of a storage oscilloscope (Tektronix 5 1 1 1 with 5A 14N four channel amplifier) and measurements were taken di- rectly from the screen of the oscilloscope. Muscle response latencies were measured from the end of the stimulus pulse to the first voltage deflection of the evoked muscle response. In Figure 2, the latency is the time from the arrow indicating the end of the stimulus pulse to the upward deflection indicating the beginning of the muscle response. Maximum response rates were determined by applying a brief train (5-1 0 pulses) of stimuli at different frequencies. At least one flat trace in response to a train indicated a stimulus rate above the maximum response rate of the pathway. In Figure 2, examples of muscle response failures are seen in panels B, C and D.
Along with maximum response rates, the percentage of
muscles that respond to brain stimulation is a measure of the reliability of the response. Each muscle was tested with the stimulus current in both polarities, and the presence or absence of a response noted. Thus the “percent muscles responding” values in Figures 4, 5 and 6 and Tables 3 and 4 reflect a number of tests twice the “ N indicated. The genotypes of Figures 4, 5 and 6 were separated into four groups as described in Figure 7 and used as four levels of a single manipulated variable in one way analysis of variance tests. For each of the four dependent (measured) variables (DLM latency and maximum response rate and TTM la- tency and maximum response rate) a separate analysis of variance was performed using the StatView 5 12+ program for the MacIntosh computer. The Fisher protected least significant differences (PLSD) test and the Scheffe F-test (KEPPEL 1982) agreed on all significance levels in the results except the comparison of the data of Figure 7H with 7L where the former test yielded a 99.999% significance and the latter a 99.99% significance.
Isolation of recombinants between two deficiency chro- mosomes: T o produce females heterozygous for deficiencies
16-3-35 and A118, males of the genotype A118/y+Yma1’06
were mated to virgin females of genotype 16-3-35/FM6. F1 virgin females of genotype 16-3-351A118 lack the dominant
1048 D. H. Baird, A.P. Schalet and R. J. Wyman
carrying the y+YmalIu6 chromosome. The few nondisjunction FI females produced were identified and eliminated by checking for the extra hairs caused by the additional y+
region of the y+Yma11u6 chromosome (SCHALET and LEFEVRE
1976). Ten to 20 virgin females of genotype 16-3-35114118
were mated to F M 6 males in bottles of standard medium at
22-26'. The parents were removed after 7 days, and the resulting adult progeny collected daily between 1 1 and 18 days. The progeny were searched for phenotypically wild- type males and the number of F I females was counted. The putative male recombinants were mated to C(l)A,y attached
X chromosome virgin females to produce stocks of flies bearing the putative recombinant X chromosomes. In this way, the fertility of the males of interest could be assessed, and the GF response of several flies of the resulting stock could be recorded. Completely analogous procedures were used to isolate putative recombinant progeny from mothers
heterozygous for the deficiency combinations 16-3-35/
HC279 and 16-3-35/LB7. In an additional experiment to confirm the recombinant nature of the FI males recovered in the above experiments, we generated car Df(1)16-3-35 Dfi( 1; l)scvl/Df( I)A118 females which included markers that closely flank the deficiencies. These females were mated to balancer males that carried the Bar marker. Again F, prog- eny were searched for the rare F1 males.
Measurement of the percentage of eggs hatching: A control rate of hatching was determined from the eggs laid by Oregon-R/FM6 females mated to F M 6 males. The rate of hatching of a known lethal in the region was determined from the eggs laid by Df( 1 )I 6-3-22/FM6 females mated to
F M 6 males. Since 16-3-22 deletes runt, a known embryonic lethal (GERGEN and WIESCHAUS 1986), the 16-3-22 male progeny will die, leaving an expected hatching rate of ap- proximately 75%. The experimental group was the off- spring of mothers heterozygous for a lethal R-9-29 allele and F M 6 which had been mated to F M 6 males. For each genotype, roughly 100 to 200 parental flies were placed in a plastic beaker which was inverted over a Petri dish of medium smeared with a paste made from yeast and water. After 3 hr at room temperature the plate was removed. After 30-40 hr, well beyond normal hatching time, the numbers of unhatched eggs and empty, chorionic egg shells were recorded.
RESULTS
Genetic analysis of single complementation groups: O u r first task was the assignment of mutations to complementation groups in 19E so that Pas could
be analyzed with respect to a set of defined loci. There are eight known genetic complementation groups in subdivision 19E (Figure 3). T h e y a r e melanizedlike (mell), runt (run), R-9-29, R-9-28, EC2?5, littlefly
(If>,
varied outspread (vao) a n d uncoordinated (unc)
(SCHALET a n d LEFEVRE 1976; MIKLOS et a l . 1987). T h e lethal alleles of the complementation groups of subdivision 19E have been extensively tested inter a n d
intra se, as well as against a panel of published and unpublished lethals, duplications a n d deficiencies
whose breakpoints impinge on this region (SCHALET
a n d LEFEVRE 1976; GREEN, YAMAMOTO a n d MIKLOS
1987; MIKLOS et al. 1987). Tests have also been per-
formed with other rearrangements and alleles of com-
plementation groups outside the 19E region but
within t h e larger maroonlike (19D3) to suppressor of
forked (20F) interval (PERRIMON, SMOUSE a n d MIKLOS 1989). Whereas most of the complementation groups in subdivision 19E have lethal or viable alleles, varied outspread a n d melanizedlike have only been defined by the phenotype of individuals heterozygous for certain overlapping deficiencies. We were also unable to ob- tain any alleles of littlefly (1 9E6) that we could reliably score. All o t h e r alleles can be unambiguously assigned
to the remaining six complementation groups and are
so displayed in Table 1.
T h e cytological mapping of deficiency breakpoints a n d loci (Figure 3) is based on the work of SCHALET a n d LEFEVRE (1973, 1976), who find that "all of section 1 9 is sufficiently amenable to cytological analy- sis that in most cases breakpoint determinations are accurate within a n error of no more than one band."
T h e association of genes with cytological bands in this
paper is subject to this same uncertainty. T h e associ- ation of each gene with a different band is not a necessary conclusion from the cytological data.
Genetic analysis of multilocus deficiencies: T h e 1 3 deficiency-bearing X chromosomes used in o u r analyses are depicted in Figure 3. T h e figure includes four deficiencies (HC279, LB7, 17-489 and A5?) not
reported earlier in the cytogenetic analyses of
SCHALET a n d LEFEVRE. T h e cytological extent of A5?,
as determined by Lefevre, was reported in LINDSLEY a n d ZIMM (1 986). T h e cytological limits of the three remaining deficiencies are inferred from genetic anal- yses. T h e genetic breakpoints of all 1 3 deficiencies have been determined using the alleles of the lethal complementation groups listed in Table 1 as well as by complementation testing of the deficiencies inter se
a n d with various duplication bearing chromosomes such as mini-2, mini-ring a n d mini-77 (GREEN, YAMA-
MOTO a n d MIKLOS 1987; PERRIMON, SMOUSE a n d MIK-
LOS 1989). The mode of induction and genetic extents
of these deficiencies are shown in Table 2. T h e pre- vious cytological uncertainties associated with t h e breakpoints of deficiency 16-3-35 have now been re- solved by direct cytological analysis (YAMAMOTO a n d
MIKLOS 1987). 16-3-35 is missing bands 19D3 through
19E3 inclusive a n d this cytological result is therefore in complete agreement with the genetic extent of this deficiency. Following convention, we have depicted the genetic breakpoints of t h e deficiencies in Figure
3 as occurring between the various complementation
groups. T h e molecular breakpoints of any of the deficiencies could, of course, be in the genes them- selves.
Electrophysiological phenotype of normal and
Passwer Locus in Drosophila 1049
1 1 1
mission through the elements of the pathway. T h e pathway to the DLM muscle involves one extra chem- ical synapse (the PSI to DLM synapse, see Figure 1) and therefore responds with a somewhat longer la- tency, about 1.4 msec. T h e TTM can respond to each of a series of stimuli delivered at 100/sec (100 Hz) and the DLM can respond nearly as rapidly. Failures to respond are almost never seen.
In homozygous Pas flies the DLMs do not respond at all (Figure 2B; Table 4). T h e T T M muscles do not respond about 50% of the time. When they do re- spond their latency is longer and more variable (1.6
f 0.8 msec SD). Whereas in wild type, muscles on the right and left sides of the
fly
both respond to each stimulus, in Pas flies one side may respond without the other. In those cases, reversing the polarity of the stimulating electrodes may change which GF is stim- ulated and thus affect whether a side responds. There- fore flies were stimulated with both polarities. One of the most sensitive tests of synaptic function is the rapidity with which spikes can be transmitted. In Pasflies the maximum rate at which the T T M muscle can
FIGURE 3.-Cytogenetic map of
the 19D3 to 19F1 X chromosome
interval illustrating the genetic com- plementation groups and chromo- somal deficiencies used in the analysis of mutants. The genetic extent of each deficiency relative to the com-
plementation groups listed above is
indicated by the black bars. Deficien- cies which extend beyond the bound- aries of this map are drawn with an arrowed end.
respond to each stimulus is less than 1 Hz (0.6 f 0.3 Hz sD).
The Pus allele shows partial dominance: T h e Pas allele is dominant in its elimination of the escape response. Flies of the genotype
+;
bw; st respond to a light-off stimulus by jumping nearly 90% of the time. In Pas/+; bw; st flies, however, the jump response is almost totally abolished (Table 3). T h e absence of a jump response in Pas/+ flies, while the electrophysi- ological response of the GFS to brain stimulation remains, suggests that the Pus mutation dominantly disrupts the pathway between the eye and the GF.Deficiency mapping of Pas: After the original map- ping of Pus to Df(1)16-?-22 (WYMAN and THOMAS
1983), KOTO (1983) further defined the location to within Of(
1)B57,
indicating a 19E location at the base of the X chromosome. We examined the response to brain stimulation of flies heterozygous for Pas and for1050 D. H. Baird, A.P. Schalet and R. J. Wyman
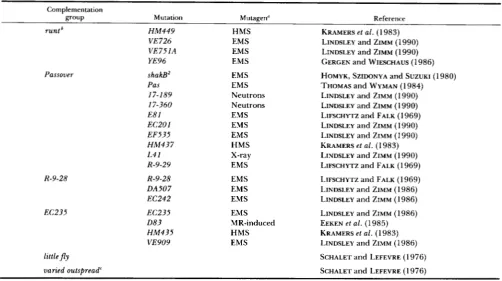
TABLE 1
Modes of induction of mutations in X chromosome subdivision 19E
Complementation
group Mutation Mutagen" Reference
runt' H M 4 4 9 HMS KRAMERS et a l . (1 983)
Passover
R-9-28
EC235
VE 726 EMS
VE751A EMS
YE96 EMS
shakBZ EMS HOMYK, SZIDONYA and SUZUKI (1980)
Pas EMS THOMAS and WYMAN (1 984)
17-189 Neutrons LINDSLEY and ZIMM (1 990)
E81
LINDSLEY and ZIMM (1990)
EMS LIFSCHYTZ and FALK ( 1 969)
LINDSLEY and ZIMM (1990)
LINDSLEY and ZIMM (1 990)
GERCEN and WIESCHAUS (1 986)
17-360 Neutrons
EC201 EMS LINDSLEY and ZIMM (1 990)
EF535 EMS LINDSLEY and ZIMM (1 990)
HM437 HMS
L 4 1 X-ray LINDSLEY and ZIMM (1 990)
R-9-29 EMS LIFSCHYTZ and FALK (1 969)
KRAMERS et a l . (1 983)
R-9-28 EMS LIFSCHYTZ and FALK ( 1 969)
DA507 EMS
EC242
EC235 EMS
083
H M 4 3 5 HMS KRAMERS et a l . (1983)
VE909 EMS LINDSLEY and ZIMM (1986)
LINDSLEY and ZIMM ( 1 986)
EMS LINDSLEY and ZIMM (1 986)
LINDSLEY and ZIMM (1 986)
MR-induced EEKEN et a l . (1 985)
littlefly SCHALET and LEFEVRE (1 976)
varied outspread" SCHALET and LEFEVRE (1 976)
HMS, hycathone methanesulfonate; EMS, ethyl methanesulfonate; MR, male recombination mutator system.
'
legless (SCHALET and LEFEVRE 1976) is an earlier name for this complementation group.' No alleles of varied outspread are extant. In late pupae and early adults of heterozygotes carrying deficiencies overlapping in bands 19E7-
8 the eyes show a varied or mottled distribution of eye pigment. T h e eye phenotype has been shown to be temperature sensitive (normal
when raised a t 17-1 8 O but mottled when raised at 24-25 ") in D f ( l ) B 5 7 / D f ( 1 ) Q 5 3 9 (SCHALET and LEFEVRE 1976) and Df( l ) A 1 18/Df( 1)Q539
(A. P. SCHALET, unpublished).
TABLE 2
Genetic extent and mode of induction for deletions involving X chromosomal subdivision 19E
Deficiencv
Deficient for
loci Mutagen Reference
16-3-35 mal-R-9-29 Neutron SCHALET and LEFEVRE (1 976); YAMAMOTO and MIKLOS (1 987)
16-3-22 mal-eo Neutron SCHALET and LEFEVRE (1 976)
A1 18 R-9-28-vao X-ray SCHALET and LEFEVRE (1976)
A 5 3 EC235-eo X-ray G . LEFEVRE (unpublished); PERRIMON, SMOUSE and MIKLOS (1989)
D 4 3 L 1 u n c - s u ( f ) ~ ~ 1 . 3 7 SCHALET and LEFEVRE ( 1 976)
HC279 R-9-28-vao X-ray G . LEFEVRE (unpublished); PERRIMON, SMOUSE and MIKLOS (1989)
17-489 EC235-bb Neutron MIKLOS et a l . (1987); A. SCHALET (unpublished)
8 5 7 run-unc X-ray SCHALET and LEFEVRE (1 976)
LB 7 R - 9 - 2 8 - s u ( f ) EMS or Mitomycin C A . SCHALET (unpublished); PERRIMON, SMOUSE and MIKLOS (1989)
LE23 vao-bb EMS SCHALET and LEFEVRE ( 1 976)
(2539 vao-A I 1 2 EMS SCHALET and LEFEVRE (1 976)
mal'" sw-me11 X-ray SCHALET and LEFEVRE ( 1 976)
T2-14A If-vao Tritiated deoxycytidine SCHALET and LEFEVRE (1 976)
a T h e mal"' deficiency was induced on the chromosomal inversion sc'.
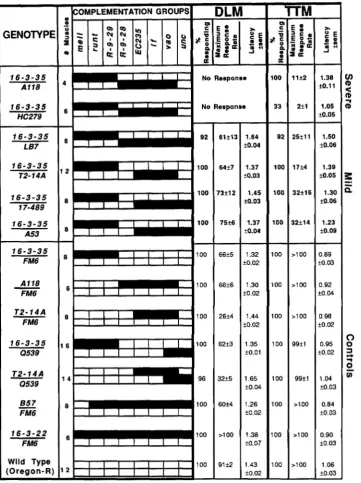
iological responses from Paslmal", and PaslQ539 flies are statistically indistinguishable from that of Pas/ FM6. Heterozygotes with five of the deficiencies ( B 5 7 ,
16-3-35, A118, HC279 and L B 7 ) produce an extreme, mutant phenotype (Figure 4) like that of Pas homo- zygotes. In these flies the DLMs do not respond to
GF stimulation at all. The TTMs respond abnormally. T h e TTM response is abolished in all Pas/B57 indi-
viduals and in different percentages of the other gen- otypes (Figure 4). In those muscles that respond at all, the T T M response shows an increase in mean latency of 53-85% over the control (PaslFM6) muscles (Fig- ure 4). These results place Pas near the boundary between the R-9-29 and R-9-28 complementation groups.
Passover Locus in Drosophila 1051
TABLE 3
The escape response of Pas/+ and s h a w l + individuals
Genotype
P a s / + 1 % 3 16
shakBZ/+ 79% 15 24
+I+ 89% 9 43
Mean response Standard No. of rate deviation flies tested
All genotypes carried the autosomal mutations brown and scarlet
which render the eyes white in color, and enhance the escape
response.
sponse to brain stimulation of flies carrying one or two deficiencies of the 19E region (Figure 5 ) . Only two of the thirteen genotypes tested exhibit the ex- tremely abnormal electrophysiological phenotype of homozygous Pas flies. In both of these deficiency combinations (16-3-35/AI I8 and 16-3-35/HC279) the DLM response is totally abolished. Both combinations reduce the TTM maximum response rate from the wild-type value which is greater than 100 Hz to below
15 Hz. T h e TTM still responds in 16-3-35/A118, but its latency (1.38
+.
0.1 1 msec SD) is always longer thanthat of the 16-3-35IFM6 control (0.89
+.
0.12 msecSD). Only 113 of the TTMs of 16-3-35lHC279 re-
sponded to brain stimulation at all. These results again place Pas in the vicinity of the boundary between R- 9-29 and R-9-28.
T h e neural defect lies with the central circuitry rather than with the motor neurons, muscles or neu- romuscular synapses since both the TTMs and DLMs respond normally to high frequency (>lo0 Hz) stim- ulation of their motor neurons in the thorax. T h e abnormal response may represent an altered GF- TTM motor neuron connection, or the presence of another descending pathway masked in the wild type
by the rapid GF-TTM response. These deficiency genotypes also produced the uncoordinated leg move- ments seen in Pas and shakB2 mutants under ether anesthesia (see below).
As can be seen in Figure 5 , deficiency 16-3-35, coming into the region from the distal side, uncovers no known lethal loci that are also uncovered by defi- ciencies AI 18, HC279 or LB7 coming in from the proximal side. Although initial cytological studies in- dicated some overlap of the region deleted between deficiencies 16-3-35 and A 1 18 (SCHALET and LEFEVRE 1976), we have obtained recombination in crosses between 16-3-35 and each of the other deficiencies. For deficiencies 16-3-35 and A I 18, seven adult male progeny were found among 21,653 female progeny. For 16-3-35 and HC279 four putative recombinants were found out of 607 1 female progeny. For 16-3-35 and LB7, four putative recombinants were found among 7324 female progeny. T h e putative male re- combinants were mated to C ( I ) A , y females. Males from each of the three deficiency crosses proved to be fertile and in turn their male progeny exhibited normal GF responses. If the recombination in these
events was homologous and in register then there must be DNA between the proximal breakpoint of 16-3-35 and the distal breakpoints of AI 18, HC279 or LB7.
In a second experiment using a chromosome bear- ing markers closely flanking the deficiencies, there were 9 male progeny (among 14,004 females) which bore the car+ and Op( 1:l)sc"' markers expected in flies bearing a chromosome resulting from a crossover in the interval between Of( 1)AI 18 and Of( 1)16-3-35. All of these males were fertile; the first two males of independent origin were tested and shown to have normal GF responses.
T h e normal phenotypes produced in males by these recombinant chromosomes also demonstrate that 16- 3-35 does not have additional proximal genetic defects that contribute to the mutant phenotype. Similarly, the A I 18, HC279 and LB7 chromosomes do not have additional distal genetic defects that disrupt the GF response. Aberrations of these types would be re- covered in the recombinants and cause an abnormal GF response.
These results indicate that Pas lies, at least partly, in the DNA between the proximal break of 16-3-35 and the distal breaks o f A I 1 8 , HC279 and LB7 and is impinged upon by these deficiencies from both sides.
Allelism with the R-9-29 complementation group:
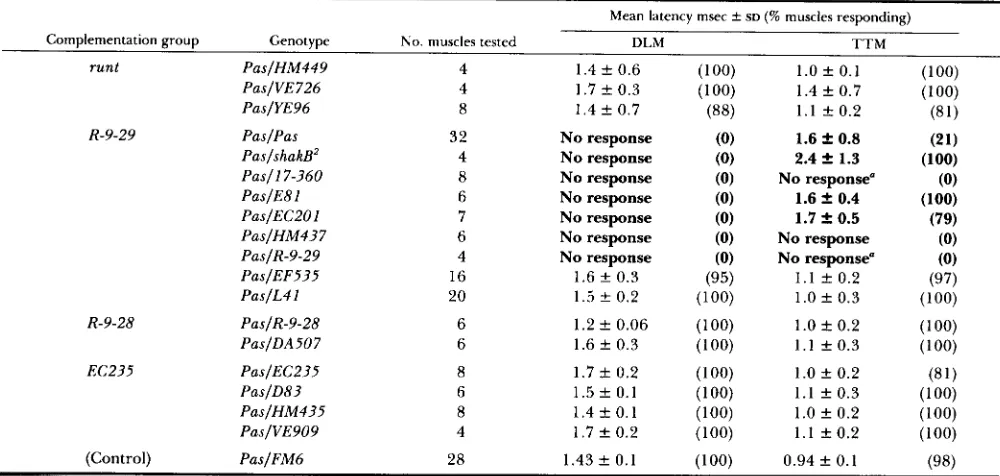
When Pas is combined with lethal alleles of the four available complementation groups (runt, R-9-29, R-9- 28 and EC235) in 19E between Of( l)maZ'o and Of( l)Q53Y, it is seen that only R-9-29 alleles cause a phenotype like that of Pas homozygotes. When Pas is combined with the R-9-29 alleles (Table 4), all com- binations are mutant except for the PaslL4I and Pas/ EF535 combinations which produce control values for DLM and T T M latencies. With the noncomplement- ing alleles none of the individuals have a DLM re- sponse to brain stimulation. T h e T T M response is either abolished in some or all individuals of a geno- type or exhibits a large increase in its latency (Table 4). When they do respond, the maximum response rate is reduced to 25 Hz or less.
T h e VE726 allele of the runt locus produces an increase in T T M latency when combined with the Pas allele (Table 4). However, when other runt alleles (VE751, HM449 and YE96) are combined with either the Pas or shakB (see below) alleles, the latencies observed are indistinguishable from control values. Thus, the interaction of VE726 with Pas is peculiar to this allele, and does not extend to other alleles of runt
or Pas.
Viable allele: shaking-B2 (HOMYK, SZIDONYA and SUZUKI 1980) is an independently isolated behavioral mutation that has been placed in the R-9-29 comple- mentation group (MIKLOS et aZ. 1987). T h e shakB2 stock was kindly provided by THEODORE HOMYK, JR.
1052
GENOTYPI
-
Pas 857-
Pas 1 6 - 3 - 3 5Pas A1 18
Pas
-
HC279
Pas L87
Pas
-
17-489
Pas TZ-14A
Pas A53
-
pas, 0
mal
Pas 0539
Pas FM6 (Control)
-
-
D. H. Baird, A.P. Schalet and R. J. Wyman
]COMPLEMENTATION GROUPS~
DLM
6 No Response
4 No Response
6 No Response
6 No Response
14 No Response
45
1 f 3 2.10 f0.14
3 f l 1.71 fO.11
12f3 2.36 M.07
56f13 1.28 f0.04
4739 1.48 f0.02
55f3 1.43 f0.02
of their legs. T h e position in which the legs are held during flight is abnormal and there is a slight tremor of the legs during ether anesthesia. T h e leg tremor phenotype of Pas and shakB2 flies is very different, however, from that of the potassium channel mutant, Shaker (SALKOFF and WYMAN 1981). Even the weak alleles of Shaker shake much more vigorously and at higher frequency than Pas or shakB2 (E. 0. ACEVES- PINA, unpublished results). T h e shaking effect in Pas or shakB2 flies is better described as an uncoordinated movement rather than the rhythmic movement seen in Shaker individuals. T h e legs of an etherized Shaker
fly, after being severed from the body, will continue to shake (GANETZKY and Wu 1982), demonstrating a generalized membrane hyperexcitability independent of central circuitry. T h e severed legs of Pas flies do not shake, indicating a central defect, possibly the disconnection of an inhibitory input.
Homozygous shakB2 do not jump to a light off
stimulus. However, unlike Pas, shakB2 does not act as a dominant in elimination of the jump. shakB2/+; bw; st individuals respond nearly as well as
+/+;
bw; stNo Response
-
63
67
67
58
-
79
86
83
-
0097
98
-
-
6 f 2
3 f 2
8 f 2
20f7
20-
16f7
9 f 3
85fl5
84f9
95f4
-
-
1.76 m.27
1 .e1 f0.16
1.64 m.14
1.14 m.10
-
1.59 fO.09
1.39 f0.08
1.77 f0.14
-
0.92 t0.041.08 f0.04
0.94 M.02
n
t
FIGURE 4.-The DLM and TTMresponses of flies heterozygous for the Passover mutation and for chro- mosomal deficiencies of the 19E sub- division. The genetic extent of each deficiency relative to the complernen- tation groups listed above is indicated by the black bars. All TTM and DLM latencies in the “severe” and “mild” groups differed significantly (t-test: P
< 0.0001) from those of sibling con-
’
trols (Pas/FM6).! L
individuals (Table 3) indicating that shakB2 is a reces- sive allele with respect to the escape response.
We find the electrophysiological phenotype of shakB2 to be very similar to that of Pas (Figure 2, B and C) (BAIRD 1986, 1988). Pas and shakB2 do not complement each other. T h e heterozygote Pas/shakB2 has the same mutant phenotype as Pas or shakB2 homozygotes. In all three of these genotypes the DLMs do not respond to brain stimulation, the TTM latency is increased and its maximum response rate decreased (Tables 4 and 5). T h e defect is central since the muscles respond normally to stimulation of the motor axons.
Passover Locus in Drosophila 1053
3ENOTYPE
~~ _ _ ~
1 6 - 3 - 3 5 A118
1 6 - 3 - 3 5 HC279
I
1 6 - 3 - 3 5 L 8 7
1 6 - 3 - 3 5 T2-14A
1 6 - 3 - 3 5 17-489
1 6 - 3 - 3 5 A53
1 6 - 3 - 3 5 FM6
-
A1 18 FM6T 2 - 1 4 A FM6
1 6 - 3 - 3 5 0539
T 2 - 1 4 A 0539
8 5 7 FM6
-
1 6 - 3 - 2 2 FM6
Wild Type (Oregon-R)
4m
No Response6
-No Response
2 loo
8 1 ~ ~ 1 0 0
1 1 1 1 1 1 I
61f13 64i7 73fl2 75f6 66f5 66f6 26f4 62f3 32f5 60f4 >loo
91 k2
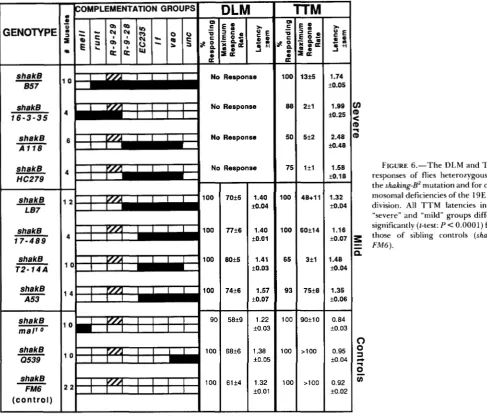
A 1 1 8 and shakB'IHC279) totally abolish the DLM output (Figure 6). In these same four combinations the mean T T M latencies range between 1.6 and 2.5
msec, a substantial increase from the average value of 0.9 msec in shakB2/FM6 sibling controls. These four deficiencies, when combined with Pas, also generate the severely mutant phenotype.
Similarly, when the shakB' allele is combined with lethal alleles of the four available complementation groups in bands 19E2 through 19E5, it is seen that alleles of runt, R-9-28 and EC235 result in a normal phenotype. Only heterozygotes with R-9-29 alleles abolish the response of the DLM and abolish the T T M response, or cause a large increase in its latency (Table 5). As for Pas, shakB2/L41 and shakB2/EF535 produce latencies indistinguishable from control values whereas shakB'IR-9-29, shakB2/E81 and shakB2/1 7-
-
1.64 f0.04 1.37 f0.03 1.45 M.03 1.37 f0.04-
1.32 f0.02 1.30 fO.02 1.44 f0.02 1.35 fO.O1 1.65 f0.04 1.26 fO.02 1.38 f0.07 1.43 f0.02-
-
-
CA E #;-
Pd
-
100 33-
92 100 100 100-
100 100 100 100 100 100I O 0
IO0
-
2 5 f l l
17f4 32f16 32f14
-
>loo >loo >loo 99fl 99fl >loo >loo >loo-
$ E 5 8-I m u
-
I .38 a . 1 1
1.05
f0.05
-
1 S O f0.06 1.39 i0.05 1.30 f0.06 1.23 f0.09 0.89 fO.03 0.92 f0.04 0.98 *0.02 0.95 f0.02 1.04 f0.03 0.84 f0.03 0.90 f0.03 1.06 f0.03FIGURE 5.-The DLM and TTM responses of flies heterozygous for chromosomal deficiencies involving
X chromosome subdivision 19E. All
T T M latencies in the "severe" and
"mild" groups differed significantly
( P < 0.0001) from those of sibling
controls (16-?-35/FM6). t-test was
used in all cases except for 16-3-35/
HC279 which, because of the large
fraction of nonresponders, was tested
with the nonparametric Mann-Whit-
ney U test.)
I89 produce mutant responses (Table 5). T h e R-9-29 and EC201 alleles also do not complement the leg- shaking phenotype of shakB2 (MIKLOS et a l . 1987).
Amorphic alleles: Since the shakB2, R-9-29, E81 and 17-189 alleles over shakB' all produce the same severe phenotype as the deficiency combination shakB2/B57, these alleles are amorphic as far as the neural phenotype is concerned.
1054 D. H. Baird, A.P. Schalet and R. J. Wyman
TABLE 4
DLM and TTM responses of individuals heterozygous for Passover and alleles of the complementation groups of subdivision 19E
Mean latency msec t SD (% muscles responding) Complenlentation group Genotype No. muscles tested T T M D L M
runt PaslHM449
PaslVE726 PaslYE96
R-9-29 PaslPas
PaslshakB’ Pas11 7-360 PaslE81 PasIECPOl PaslHM437 PaslR-9-29 PaslEF535 PaslL4 1
R-9-28 PaslR-9-28
PaslDA507
EC235 PaslEC235
PaslD83 PaslHM435 PaslVE909
(Control) PaslFM6
4 4 8
32 4 8 6 7 6 4 16 20
6 6
8 6 8 4
28
1.4 f 0.6
1.7 f 0.3
1.4 f 0.7
No response No response No response No response No response No response No response
1.6 k 0 . 3
1.5 c 0.2
1.2 f 0.06
1.6 f 0.3
1.7 rt 0.2 1 . 5 f 0.1
1.4 k 0.1
1.7 f 0.2
1.43 f 0.1
1.0 f 0.1
1.4 f 0.7
1 . 1 rt 0.2
1.6 f 0.8 2.4 i: 1.3
No response“ 1.6 f 0.4 1.7 f 0.5
No response
No response”
1.1 f 0.2
1.0 f 0.3
1
.o
k 0.21.1 f 0.3
1
.o
f 0.21.1 f 0.3
1.0 f 0.2
1.1 f 0.2
0.94 f 0.1
T h e T T M latencies in boldface showed a significant ( P < 0.0001) increase in latency from that of the Pas/FM6 controls.
a A spike occurred once after a stimulus, it probably was spontaneous rather than a response to the stimulus.
TABLE 5
DLM and TTM responses of individuals heterozygous for shaRing-B’ and alleles of the complementation groups of subdivision 19E
~
Complementation group
Mean latency msec ? SD (% muscles responding)
No. muscles
Genotype tested T T M D L M
runt shakB’IHM449 6 1.4 f 0.05 (100) 1.0 f 0.07 (1 00)
shakB’IVE751A 4 1.2 f 0.1 (100) 0.9 f 0.2 ( 1 00)
shakB’IYE96 8 1.2 f 0.06 (100) 0.9 f 0.1 (100)
R-9-29 shakB’lshakB’ 6 No response (0) 1.8 f 0.2 (80)
shakB2/17-189 4 No response (0) No response ( 0 )
shakB’lE81 4 No response“ (0) 1.3 f 0.2 (50)
shakB’IR-9-29 4 No response ( 0 ) No response ( 0 )
shakB’IEF535 12 1.3 f 0.1 ( 100) 0.9 f 0.1 (100)
shakB’IL41 8 1.4 f 0.1 (100) 1.0 rt 0.3 (100)
R-9-28 shakB’/R-9-28 18 1.2 f 0.1 (94) 0.9 f 0.3 (97)
shakB’/lEC242 4 1.4 f 0.08 (1 00) 1.0 f 0.1 ( 100)
EC235 shakB’/D83 6 1.4 f 0.1 (1 00) 0.9 f 0.08 ( 100)
shakB’IHM435 6 1.5 rt 0.07 (100) 1.1 f 0.1 ( 100)
(Control) shakB’IFM6 22 1.32 rt 0.12 ( 1 00) 0.92 f 0.08 (100)
T h e T T M latencies in boldface showed a significant ( P < 0.0001) increase in latency from that of the shakB’IFM6 controls.
a A spike occurred once after a stimulus, it probably was spontaneous rather than a response to the stimulus.
individuals are viable. While most alleles fail to com- genotypes from Figures 4, 5 and 6 displayed in Figure plement the neural phenotype of Passover, two alleles 7, C and D. While Figures 4, 5 and 6 present the (EF535 and L 4 1 ) complement the phenotype (Table mean values for the responses, Figure 7 presents the
4). This suggests that there are two independently full distribution of the responses. It can be seen that mutable functional domains at this locus, a neural and the T T M distributions for the severe genotypes have
a lethal function. very little overlap with the distributions for the control
Passover Locus in Drosophila 1055
ZENOTYPE
-
s h a k e 857shake 1 6 - 3 - 3 5
shake A1 18
shake HC279
-
-
shake LB7shake 1 7 - 4 8 9
shakB T 2 - 1 4 A
-
shake A53
shakB mall 0
shake 0539
shake FM6 ( c o n t r o l )
-
-
1 04
6
4
I Y / A J I I I
4 100
l o
- loo
-
70f577f6
80f5
74f6
58f9
68f6
61 f 4
described above, do not respond in any of the “severe” flies, while essentially all of the DLMs in the control genotypes respond (Figure
7,
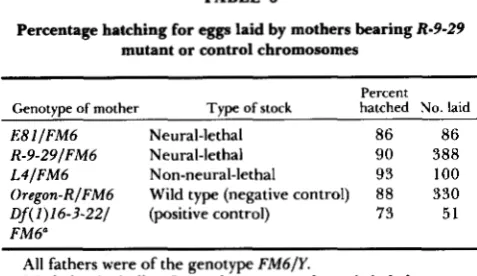
A and B).The R-9-29 alleles are larval lethals: T h e lethal phase of several R-9-29 alleles was determined. T h e hatching rate of eggs laid by mothers bearing an R-9- 29 allele is comparable to that of wild type (Table 6 ) , and is greater than that using mothers bearing a known embryonic lethal (deficiency 16-3-22, deficient for runt for example). This was true for both the L41 allele, which complements the GF defect of the viable Pas alleles, as well as for the R-9-29 and E81 alleles which do not complement Pas. Thus the three R-9-29 alleles examined do not increase embryonic lethality over the small amount observed in a wild-type control. Male larvae of the genotype Zethal/Y were isolated from each of the egg collections in which the hatching rate was determined. With rare exception these larvae died after a prolonged first instar stage of two to three days and were never observed to pupariate.
Mild trans effect of 1935-6 deficiencies: When Pas, shakB2 or Df(1)16-3-35 is combined in trans with
T
-
1.40 m.041.40 tO.O1
1.41 t0.03
1.57 t0.07
-
1.22f0.03
1.38
f0.05
1.32 fO.O1
-
m0
-
e::
t
-
100
88
50
75
-
100100
65
93
-
100
100
100 13f5
2 f l
5 f 2
1 fl
48+11
60fl4
3 f l
75f8
9OflO
>loo
>loo
I
1.74 I fO.05
1.99 v) m.25
2
rpr
2.48 fD
39.48
FIGURE 6.-The DLM and TTM
responses of flies heterozygous for
the shaking& mutation and for chro-
mosomal deficiencies of the 19E sub-
M.04 division. All TTM latencies in the “severe” and “mild” groups differed significantly (t-test: P C o . O O O ~ ) from
f0.07 those of sibling controls (shakB2/ 1.16
-
-.
F M 6 ) . P1.48 f0.04
f0.06
f0.03
0.95
3
f0.04 @
7
0,
0.92
J
f0.02proximal deficiencies in the 19E region, eight combi- nations result in an electrophysiological phenotype similar to, but less severe than, Pas (Figures 4, 5 and 6).16-3-35 or shalzB2 yield this mild phenotype when made heterozygous with any one of the deficiencies T2-14A, A53, LB7 or 17-489. T h e mean TTM re- sponse latency is increased to 1.3-1.5 msec (Figure 4) and the TTM maximum response rates are severely reduced. T h e histograms of Figure
7,
G and H , display the TTM maximum response rates and latencies of these eight genotypes; they can be compared with the control genotypes of Figure7,
C and D. There is littleor no effect on the DLM response as can be seen by comparing the histograms of Figure
7,
E and F, with the controls in Figure 7, A and B. A record of this mildly abnormal GF response is shown in Figure 2D. When Pas is combined with these same deficiencies, not only is the T T M response weakened, but the DLM is now affected. All four comparisons A through D with I through L were significant in ANOVA at 99.999% level. T h e T T M latency is increased 50-1056
DLM
D. H. Baird, A.P. Schalet and R. J. Wyman
TTM MAXIMUM RESPONSE RATE LATENCY
A
’11
B7
MAXIMUM RESPONSE RATE LATENCY
lW
1
80
6 0 -
n NO RESPONSE NO RESPONSE
6 0 -
w + - 40 -
K
w
u)
> 20-
w 20 -
o
-RESPONSES PER SECOND MILLISECONDS
0-25 25-50 50-75 75-100 ,100
RESPONSES PER SECOND MILLISECONDS
NR >2.0 1.9-1.6 1.5-1.2 1.1-0.8
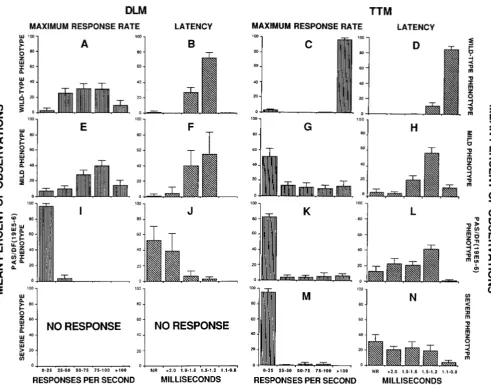
FIGURE 7.-Distribution of response parameters for different classes of genetic lesions. ROWS: T o p row (A-D): “Control.” Genotypes in
which at least one chromosome is normal both 19E3 and 19E5-6 region. Includes all genotypes listed as controls in Figures 4, 5 and 6.
Second row (E-H): “Mild.” Disruption of 19E3 combined with deficiency for 19E5-6; includes all the genotypes listed as “mild” in Figures 5
and 6. Third row (I-L): Heterozygotes between Passover and a deficiency for 19E5-6; includes all genotypes listed as “mild” in Figure 4.
Fourth row (M-N: “Severe.” Homozygous disruption of 19E3; includes all genotypes listed as “severe” in Figures 4, 5 and 6. In each
histogram weak responses are in the bins to the left, while strong responses are in the bins to the right. Rows are arranged so that there is a
general degradation of response from top to bottom in all columns. T h e T T M maximum response rates (C and G) and latencies (D and H)
a r e stronger in controls than in the “mild” genotypes. T h e DLM response is not much changed. In PaslDf(19E5-6) genotypes, the T T M
response (K and L) is further degraded and the DLM response (I and J) is now clearly affected. In the “severe” genotypes, the DLMs d o not
respond at all and there is very little overlap between the T T M histograms (M and N) and those of the control genotypes. For each genotype,
the percentage of responses in each bin was calculated. These percentages, for the relevant genotypes, were averaged to generate the
histograms in this figure. Analysis of variance of the raw data (not converted to percentages) shows that 77% of the variance in DLM
maxinlum response rate and 74% of the variance in T T M maximum repsonse rate is accounted for by the separation of the data into the
four groups of this figure (calculation of u2, WINER 1971). Since latencies could not be measured in the most strongly affected flies (those
with nonresponding muscles) the latency statistics d o not include the nonresponding class. Nevertheless, even excluding this extremely
affected group, analysis of variance shows that 50% of the variance in DLM latencies and 43% of the variance in T T M latencies is accounted
for by the separation of the data into the four groups of this figure.
of a rapid train of stimuli is severely reduced. Com- paring Figure
7,
K and L (Pas combinations) with7,
G and H (shakB’ and 16-3-35 combinations) indicates that Pas has a more severe effect on the T T M re- sponses than does shakB2 or 16-3-35 when combined with deficiencies of 19E5-6. ANOVA comparisons of
G with K and H with L were significant at the 99.999% level. T h e DLM response is abolished in all PaslLB7 individuals and in 1/2 to 314 of Pas/17-489
and PaslT2-14A individuals (Figure 4). When DLM responses are present in these genotypes, and in Pas/
A53, the latency is greater than 1.7 msec and their maximum response rate falls to 12 Hz or less (Figure 4). Compare Figure 7, I and 75 (Pas combinations) with Figure 7, E and F (shakB2 and 16-3-35 combina- tions) to see the stronger effect of the Pas combination genotypes. ANOVA comparisons of E with I and F with J were significant at the 99.999% level.
Passover Locus in Drosophila 1057
TABLE 6
Percentage hatching for eggs laid by mothers bearing R-9-29
mutant or control chromosomes
Genotype of mother Type of stock hatched No. laid E8 1
l F M 6 Neural-lethal 86 86
L 4 / F M 6 Non-neural-lethal 93 100 Oregon-RIFM6 Wild type (negative control) 88 330
Of( 1)16-3-221 (positive control) 73 5 1 FM6"
Percent
R - 9 - 2 9 / F M 6 Neural-lethal 90 388
All fathers were of the genotype FM6IY.
a Deletion including Pus and runt, an embryonic lethal.
tation group is not deleted but lies between the break- points of the deficiencies. Alleles of the R-9-28 com- plementation groups fully complement the 19E3 mu- tants and the 16-3-35 deficiency. Thus the two 19E regions which are necessary for a normal GF response are separated at least by the R-9-28 locus. Alleles of EC235 also fully complement 16-3-35 and the 19E3 mutants and thus that locus may also lie between the two regions affecting the GFS. We did not have alleles of little
fly
to test, but given the deficiencies available, the lfcomplementation group may also intervene. T h e normal phenotype of 16-3-351Q539 sets a proximal boundary on the location of the interacting region. In accord with this, the vao locus seems to be not involved since the three vao combinations, T2-14AIQ539, A1 18/Q539 and A1 18lLB23, have normal phenotype (data not shown).None of the deficiencies, even those deleting all of 19E, have any measurable electrophysiological effects on either the DLM or TTM output when heterozy- gous with an intact chromosome. Each of the deficien- cies 16-3-35, A118, T2-14A, B57 and 16-3-22 (all over FM6) produce wild-type electrophysiological re- sponses (Figure 5). In contrast, the trans combinations of 16-3-35 with the nonoverlapping deficiencies T2- 14A, 17-489 or A53 do disrupt the GF response. T h e two different portions of 19E when deleted in cis produce a normal phenotype, but when deleted in trans affect the GF response. Thus, the wild-type phenotype is observed when both regions are normal on at least one chromosome and the mutant pheno- type is observed only when both homologs are mutant.
DISCUSSION
Mapping Passover and shaking-BZ: Deficiency map- ping of the neural phenotype of these mutations places them between the proximal breakpoint of mal" and the distal breakpoint of Q539. Alleles of four comple- mentation groups in this region are available. Of these, Pas and shakB2 interact only with the R-9-29 group. It appears that Passover, shaking-B2 and the R- 9-29 alleles affect a common genetic element. T h e lethality of R-9-29 maps cleanly to one genetic position with no ambiguity (SCHALET and LEFEVRE 1973; MIK-
LOS et al. 1987). In the current cytogenetic map (LE-
FEVRE and WATKINS 1986) R-9-29 is assigned to
19E2-3. T h e placement of Pas in 19E3 is consistent with the deficiency analysis of Figures 4 , 5 and 6. T h e relationship of the distal break of LB7 to Pas is uncer- tain; PaslLB7 has the severe phenotype, as if LB7 disrupted the locus, while shakB2/LB7 and 16-3-351 LB7 have the mild phenotype, as if LB7 did not disrupt the 19E3 locus, but had its effect solely through its deletion of the 19E5-6 region.
Complex complementation with the R-9-29 alleles:
Eight alleles of the R-9-29 locus were found to be lethal when tested in various combinations among themselves. None of these are lethal when heterozy- gous with Pas or shakB2. Some of these alleles comple- ment the strong neural phenotype of the shakB2 and Pus mutations whereas most do not. In particular, two alleles, L41 and EF535, which are homozygous lethal, have no noticeable effect on the GF response when heterozygous with either shakBZ or Pus. The two phe- notypes can also be separated by the different defi- ciencies. Deficiency 16-3-35 uncovers both the lethal and neural phenotypes; deficiencies A 1 18 and HC279 uncover only the neural phenotypes. Deficiency het- erozygotes 16-3-351A 1 18 and 16-3-351HC279 pro- duce the extreme neural phenotype yet show no re- duced viability. Thus, there are clearly two genetic functions in 19E3, one lethal and one neural, with complex complementation between them. T h e alleles and deficiencies discussed can be envisaged as forming three groups: (1) the lethallnon-neural group consists of alleles L41 and EF535 and is uncovered by 16-3- 35; (2) the viable/neural group consisting of shaking- BZ and Passover and is uncovered by 16-3-35, A1 18 and HC279; and (3) the lethal/neural group consists of HM437, R-9-29, E81, EC201, 17-189 and 17-360 each of which fails to complement alleles in both of the first two groups. Given that deficiency 16-3-35 uncovers the lethality of R-9-29 alleles, and is distal to deficiencies A1 18 and HC279, which uncover only the neural phenotype, we predict that the lethal function resides in a more distal part of 19E3 than the neural function.
Noncomplementation of mutations in the 19E3