A STUDY ON PAVEMENT
PERFORMANCE AND OVERLAY DESIGN
USING HDM-4
Geethu Saji
1Sreelatha T
2B.G Sreedevi
3PG Student, Govt. Rajiv Gandhi Institute of Technology, Kottayam, India 1
Associate Professor, Govt. Rajiv Gandhi Institute of Technology, Kottayam, India 2
Scientist G, National Transportation Planning and Research Centre, Trivandrum, India 3
Abstract: Maintenance and repair of the highway pavements accounts to major expenses in the state budget. Highway Development and Management tool, HDM-4 software, developed by the World Bank for global applications is utilized for identifying an optimum maintenance strategy for highway pavements. The study area selected was Seaport-Airport Road (SPAP Road), a two-lane, 11.47km long road running between HMT Kalamasseri and Cohin Refineries Ltd. Economic analyses of different overlay options were evaluated using HDM-4. The concept of Ultra-Thin Whitetopping has not yet introduced in Kerala. Ultra-Thin Whitetopping may be defined as a concrete overlay 50mm to 100mm thick, with closely spaced joints and bonded to an existing bituminous pavement. It consist of a thin layer of high strength, fibre- reinforced concrete placed over a clean , milled surface of distressed bituminous concrete pavement, to achieve full or partial bonding. From the deterioration summary it is identified that even after 15 years, the riding quality of Ultra-Thin Whitetopping is the excellent and the most desirable one without any intervention. Ultra-Thin Whitetopping has the minimum rate of roughness progression which in turn may lead to very low Road User Cost values thus providing 46% increase in the Net Economic Benefits than that of Ordinary Bitumen overlay. It also improves the functional efficiency of the pavement.
Keywords: Deterioration Model, Distress Progression, Economic Analysis, HDM-4, Ultra-Thin Whitetopping.
I. INTRODUCTION
Pavements are one of the most important part of any transportation system. For suggesting an efficient maintenance strategy, evaluation of pavement performance is very necessary. Pavement performance evaluation includes both structural and functional evaluation. The process of accumulation of damage is called deterioration and the failure of the pavement occurs at the limiting stage of serviceability level. Distresses like Cracking, Rutting, potholes etc are the basic indicators of pavement condition. Bituminous pavements are showing early sign of distresses worldwide, due to increasing loads, intensity of traffic, high tyre pressure etc. The rutting, cracking and potholes etc are quite common. The current maintenance practice is to provide the rehabilitation strategies based on subjective judgment and engineering experience.
Kerala has a tropical humid climatic condition. Due to rainfall and harsh climatic conditions, roads in Kerala often deteriorate in different ways to those in the more temperate regions of the world. Moreover Kerala roads often suffer from accelerated failures caused by variable quality control during construction, high axle loads and inadequate funding for maintenance. Maintenance and repair of the highway network system are major expenses in the state budget. So it is the duty of road engineers to suggest a scientific maintenance system for pavements which is both economical and sustainable.
II. OBJECTIVESANDSCOPEOFTHESTUDY
The main objectives of the present study are
1. To evaluate the structural and functional condition of an in-service flexible pavement.
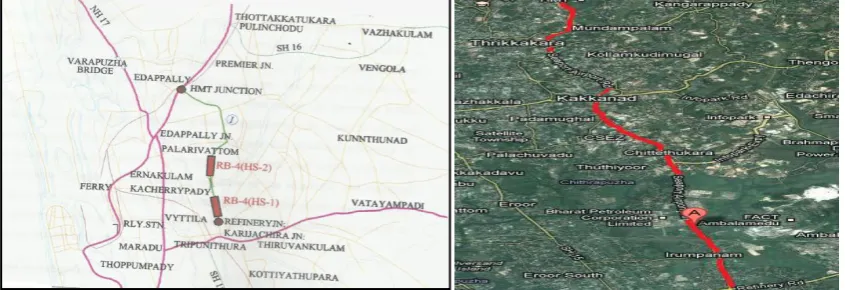
The scope of this work is to compare the cost effectiveness and performance of alternate overlay options as maintenance treatment for Kerala Urban Road conditions, considering Seaport-Airport road, running between HMT Kalamasseri and Cochin Refineries Ltd. as the study area. The study stretch is a two-lane road of 11.370 km length by Roads and Bridges Development Corporation Kerala Ltd. Also, this work is to calibrate HDM-4 deterioration models for the existing pavement condition. The study stretch is given in Fig 1.
Fig. 1 Seaport-Airport Road
III.LITERATUREREVIEW
Jain et al.(2005)attempted to create road deterioration models contained in HDM-4 to model the complex interaction
between vehicles, the environment and the pavement structure and surface. This study attempted to calibrate the HDM-4 pavement deterioration models for a National Highway Network located in Uttar Pradesh and Uttaranchal states of India. To test the efficiency of the calibrated model, models have been validated that can be adopted for prediction of distress and development of maintenance management strategies for the Indian National Highway network.
As per IRC: SP: 76-2008, Whitetopping is classified into three types. Conventional Whitetopping
It consist of a PCC overlay of thickness 200 mm or more (on the top of the existing bituminous layer) which is designed and constructed without consideration of any bond between the concrete overlay and underlying bituminous layer.
Thin Whitetopping
PCC overlay of thickness greater than 100mm and less than 200mm is classified as Thin Whitetopping. The bond between the overlaid PCC and underlying bituminous layer is often a consideration but is not mandatory.
Ultra-Thin Whitetopping
Ultra-Thin Whitetopping may be defined as a concrete overlay 50mm to 100m thick, with closely spaced joints and bonded to an existing bituminous pavement. Ultra-Thin Whitetopping system consist of a thin layer of high strength ,fiber-reinforced concrete placed over a clean ,milled surface of distressed bituminous concrete pavement, to achieve a full or partial bonding. The depth of Ultra-Thin Whitetopping depends on the grade of concrete used, intensity of traffic and time of opening the pavement for traffic, thickness of existing asphalt pavement after milling etc.
Fig. 2 Flexible composite pavement using Ultra-Thin Whitetopping
Sinha et al (2007), attempted to bring forth the concept of Whitetopping. The actual cost savings per kilometer wise in case of Ultra-Thin & Thin Whitetopping are demonstrated. The Paper concluded based on analysis that Whitetopping with the thickness between 100 mm to 250 mm can be used in rehabilitating our large network of existing bituminous roads having low to moderate traffic.
IV.DATACOLLECTION
The data is collected under the following four categories A. Pavement Condition Data
B. Vehicle Fleet Data
C. Maintenance and Rehabilitation Works Data D. Cost Data
A. Pavement Condition Data
The Pavement Condition data collection in the field was divided under the following heads:
1) Inventory data: The inventory data includes the details like Name of road, category of road, carriageway and shoulder width, drainage conditions, surface type and thickness, pavement layer details etc. The crust composition of Seaport-Airport road is given in Table I.
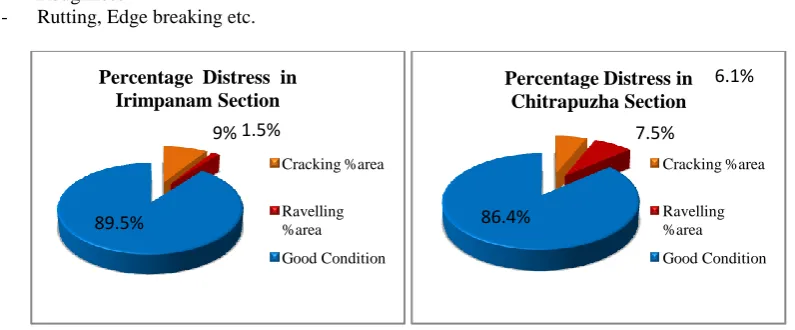
2) Pavement Evaluation: Pavement evaluation includes both structural and functional evaluation of pavements. Structural evaluation is done by Benkelman Beam Deflection method. Functional evaluation is by pavement condition survey, roughness survey and Skid resistance measurements. Major distresses are shown in Fig 3.In pavement condition the following performance indicators were physically measured on the study stretches.
- Cracking,
- Ravelling
- Patching and Potholing
- Roughness
- Rutting, Edge breaking etc.
Fig. 3 Percentage Distress in Seaport-Airport section 9% 1.5%
89.5%
Percentage Distress in Irimpanam Section
Cracking %area
Ravelling %area Good Condition
6.1%
7.5%
86.4%
Percentage Distress in Chitrapuzha Section
Cracking %area
Table I: Crust Composition
Layer Thickness(mm)
Bituminous Concrete 40
Dense Bituminous Macadam 150
Wet Mix Macadam 250
Granular Sub Base 200
Subgrade 500
Subgrade CBR 9%
Source: National Transportation Planning and Research Centre, Trivandrum.
B. Vehicle Fleet Data
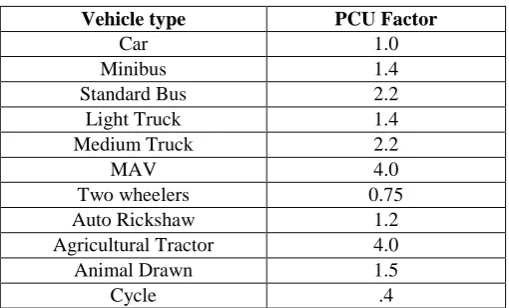
Midblock Counts were taken for seven days at the toll booth on Airport-Seaport road. Hourly traffic counts were conducted simultaneously in both directions at survey location to obtain the traffic flow and the classified composition. The survey was carried out by manual vehicle counting and classifying the vehicles passing the survey stations in all directions. The data was collected for one week to record data for each hour within 15 minutes intervals. Traffic composition of Seaport-Airport Road is given in Fig 4. It is obtained that Goods vehicle accounts for 17.78% and passenger vehicles accounts for 82.17% of total traffic. The PCU conversion factors adopted are given in Table II. The values were taken from “IRC 106-1990: Guidelines for capacity of Urban Roads in Plain Areas”.
Fig. 4 Traffic Composition in Airport-Seaport Road
TABLE II: ADOPTED PCU VALUES
Vehicle type PCU Factor
Car 1.0
Minibus 1.4
Standard Bus 2.2
Light Truck 1.4
Medium Truck 2.2
MAV 4.0
Two wheelers 0.75
Auto Rickshaw 1.2
Agricultural Tractor 4.0
Animal Drawn 1.5
Cycle .4
37%
4% 37%
2% 3% 4%
8% 4% 1%0%
TRAFFIC COMPOSITION
C. Maintenance and Rehabilitation Works Data
An M&R strategy is a course of action to be taken over the analysis period in order to keep the road section in a good condition. . The maintenance has been categorized as Ordinary Repairs (Routine Maintenance) and Periodic Renewals (Periodic Maintenance) as per the “Report of the Committee on Norms for Maintenance of Roads in India” [MoRT&H 2001].
D. Cost Data of M&R Works
The “Committee for Maintenance Norms for Roads in India, [MoRT&H 2001], has recommended the total costs for carrying out various types of maintenance and rehabilitation (M&R) works on bituminous pavements situated in various price zones of the country.
V. ANALYSISOFPAVEMENTDETERIORATIONCONDITION
Highway Development and Management Tool (HDM-4) is designed to make comparative cost estimates and economic evaluations of different construction and maintenance options. HDM-4 includes relationships for modelling Road Deterioration (RD) and Road Works Effects (WE). These are used for the purpose of predicting annual road condition and for evaluating road works strategies.
A. Procedure for Project Analysis
The procedure for project analysis is summarized below.
1. Create the road project to be analyzed by giving it a title and specifying the road to be analyzed. 2. Define the project by specifying the following:
General information about the project-Road Network data, Pavement Condition data, Vehicle fleet data and
Traffic Volume data.
Method of analysis.
Road sections to be analyzed.
3. Specify maintenance and improvement standards to be analyzed for each selected road section. Set-up and run the analysis.
4. Generate the reports and print the required outputs.
The four M&R alternatives considered for this study are defined in the Table III. The first alternative, Base alternative represents minimum routine maintenance in terms of crack sealing and pothole patching only, till such time when the reconstruction of the pavement section becomes inevitable. Various overlay options is considered as maintenance and rehabilitation alternatives.
TABLE III: PROPOSED M&R ALTERNATIVES
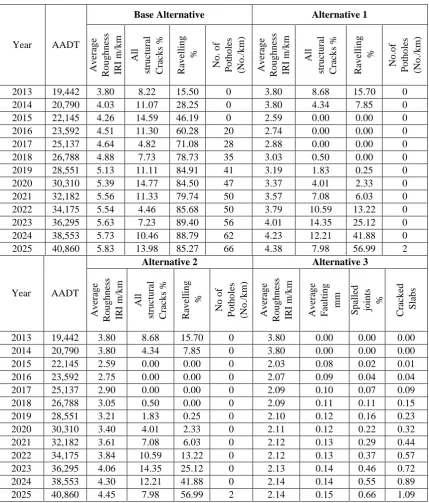
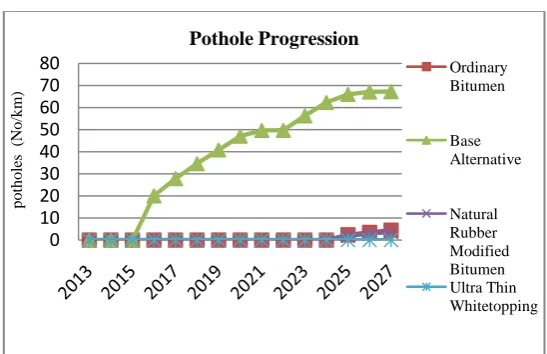
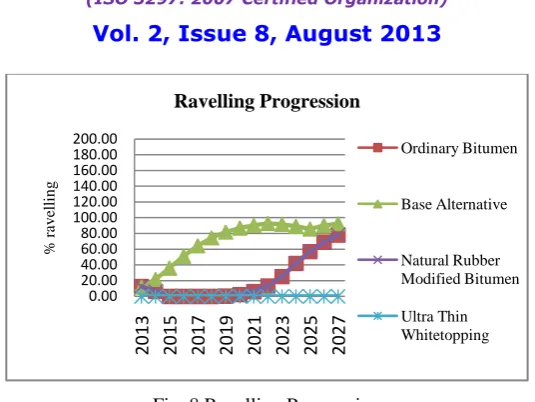
The deterioration summary of the pavement section under various Maintenance &Rehabilitation Alternatives over the analysis period of 15 years is shown in Table IV. Roughness is the most useful indicator of the pavement deterioration or average condition of the pavement section. The progression of roughness can be tracked to check that the works are correctly triggered according to the specified intervention criteria. The progression of Roughness is
Alternatives Works Standard Description of Work
Base
Alternative Routine Maintenance
Crack Sealing
Pothole Patching Drainage
Alternative 1 Overlay+ Partial Widening Provide 40mm Bituminous concrete +
Routine maintenance
Alternative 2 Overlay+ Partial Widening
Provide 40mm Natural Rubber Modified Bitumen+
Routine maintenance
Alternative 3 Ultra-Thin Whitetopping+
Partial Widening
shown in Fig 6. The progression of pavement distresses like Cracking, Pothole, and Ravelling is shown in Fig 5, Fig 7and Fig 8 respectively. From the deterioration summary it is identified that even after 15 years, the riding quality of
Ultra-Thin Whitetopping is the excellent and the most desirable one without any intervention. So it eliminates the
Routine maintenance cost.
TABLE IV: PAVEMENT DISTRESS UNDER VARIOUS ALTERNATIVES
Year AADT
Base Alternative Alternative 1
Av er ag e R o u g h n ess IR I m /k m All str u ctu ral C rac k s % R av ellin g % No . o f Po th o les (No ./k m ) Av er ag e R o u g h n ess IR I m /k m All str u ctu ral C rac k s % R av ellin g % No .o f Po th o les (No ./k m )
2013 19,442 3.80 8.22 15.50 0 3.80 8.68 15.70 0
2014 20,790 4.03 11.07 28.25 0 3.80 4.34 7.85 0
2015 22,145 4.26 14.59 46.19 0 2.59 0.00 0.00 0
2016 23,592 4.51 11.30 60.28 20 2.74 0.00 0.00 0
2017 25,137 4.64 4.82 71.08 28 2.88 0.00 0.00 0
2018 26,788 4.88 7.73 78.73 35 3.03 0.50 0.00 0
2019 28,551 5.13 11.11 84.91 41 3.19 1.83 0.25 0
2020 30,310 5.39 14.77 84.50 47 3.37 4.01 2.33 0
2021 32,182 5.56 11.33 79.74 50 3.57 7.08 6.03 0
2022 34,175 5.54 4.46 85.68 50 3.79 10.59 13.22 0
2023 36,295 5.63 7.23 89.40 56 4.01 14.35 25.12 0
2024 38,553 5.73 10.46 88.79 62 4.23 12.21 41.88 0
2025 40,860 5.83 13.98 85.27 66 4.38 7.98 56.99 2
Year AADT
Alternative 2 Alternative 3
Av er ag e R o u g h n ess IR I m /k m All str u ctu ral C rac k s % R av ellin g % No o f Po th o les (No ./k m ) Av er ag e R o u g h n ess IR I m /k m Av er ag e Fau ltin g mm Sp alled jo in ts % C rac k ed Slab s
2013 19,442 3.80 8.68 15.70 0 3.80 0.00 0.00 0.00
2014 20,790 3.80 4.34 7.85 0 3.80 0.00 0.00 0.00
2015 22,145 2.59 0.00 0.00 0 2.03 0.08 0.02 0.01
2016 23,592 2.75 0.00 0.00 0 2.07 0.09 0.04 0.04
2017 25,137 2.90 0.00 0.00 0 2.09 0.10 0.07 0.09
2018 26,788 3.05 0.50 0.00 0 2.09 0.11 0.11 0.15
2019 28,551 3.21 1.83 0.25 0 2.10 0.12 0.16 0.23
2020 30,310 3.40 4.01 2.33 0 2.11 0.12 0.22 0.32
2021 32,182 3.61 7.08 6.03 0 2.12 0.13 0.29 0.44
2022 34,175 3.84 10.59 13.22 0 2.12 0.13 0.37 0.57
2023 36,295 4.06 14.35 25.12 0 2.13 0.14 0.46 0.72
2024 38,553 4.30 12.21 41.88 0 2.14 0.14 0.55 0.89
Fig. 5 Roughness Progression
Fig. 6 Cracking Progression
Fig. 7 Pothole Progression 0.00
2.00 4.00 6.00 8.00
A
v
er
ag
e
Ro
u
g
h
n
ess
(
IRI
m
/k
m
)
Roughness Progression
Ordinary Bitumen
Base Alternative
Natural Rubber Modified Bitumen
Ultra Thin Whitetopping
0.00 5.00 10.00 15.00 20.00
%
cr
ac
k
s
Cracking Progression
Ordinary Bitumen
Base Alternative
Natural Rubber Modified Bitumen Ultra Thin
Whitetopping
0 10 20 30 40 50 60 70 80
p
o
th
o
le
s
(
N
o
/k
m)
Pothole Progression
Ordinary Bitumen
Base Alternative
Fig. 8 Ravelling Progression
VI.ECONOMICANALYSIS
In set up to the analysis, the Base Alternative is confirmed and a discount rate of 10 per cent is specified. While running the project analysis, Alternatives 1 to 3 are compared against the Base Alternative. The analysis summary is given in
Table V. From the Economic analysis it is obtained that Ultra-ThinWhitetopping has the maximum NPV/cost ratio and
Internal Rate of Return which clearly indicates that Ultra-ThinWhitetopping is the most economical overlay option for
Seaport-Airport road.
TABLE V: ECONOMIC ANALYSIS SUMMARIES
Alternative
Discounted Savings in Motorised Traffic VOC (Indian Rupees
(millions)
Discounted Savings in MT
Travel Time Cost (Indian
Rupees (millions)
Discounted Net Economic
Benefits, NPV(Indian
Rupees (millions)
NPV/Co st ratio
Internal Rate of Return
Base
Alternative 0 0 0 0 0
40mm Ordinary
Bitumen 173.94 977.16 822.93 2.508 40.4
40mm Natural Rubber Modified Bitumen
158.75 1205.66 1019.81 2.959 47.5
Ultra-Thin
Whitetopping 343.98 1235.28 1203.07 3.198 48.2
VII. CONCLUSIONS
The present pavement performance and riding quality of the study road is analysed by both Structural and Functional evaluation. It is identified that the pavement is structurally good but riding quality is reduced due to lack of maintenance strategy. In order to improve the riding quality of the pavement, an overlay option is suggested.
For predicting the deterioration progress of the study road, the HDM-4 pavement deterioration models are calibrated for the Kerala urban road conditions. From the deterioration summary it is identified that even after 15 years, the riding quality of Ultra-Thin Whitetopping is the excellent and the most desirable one without any intervention. So it eliminates the Routine maintenance cost.
0.00 20.00 40.00 60.00 80.00 100.00 120.00 140.00 160.00 180.00 200.00
2013 2015 2017 2019 2021 2023 2025 2027
%
ra
v
el
li
n
g
Ravelling Progression
Ordinary Bitumen
Base Alternative
Natural Rubber Modified Bitumen
Due to the high increase in vehicular traffic and congestion, Level of Service of the study stretch is very low thus demanding a Partial Widening in addition to overlay. Pavement Upgradation with Ultra-Thin Whitetopping is found to be the most economical since it has the highest Internal Rate of Return of 48.2 which is 19% higher than that of Ordinary Bitumen overlay. Ultra-Thin Whitetopping has the minimum rate of roughness progression which in turn may lead to very low Road User Cost values thus providing 46% increase in the Net Economic Benefits than that of Ordinary Bitumen overlay. It also improves the functional efficiency of the pavement. Also there are other benefits which can be non-quantifiable like delays to traffic during maintenance of flexible pavement, increase in comfort and safety.
Ultra-Thin Whitetopping can be suggested as the most appropriate overlay option which reduces the Life Cycle cost of the pavement.
ACKNOWLEDGMENT
The authors would like to acknowledge Dr. G Ravikumar, Scientist F, Head, Extension Services Division, Mrs. Salini P.N, Scientist B and other staffs of NATPAC for their overall guidance and support. Special Thanks to Dr. Padmini A K (HOD, Civil Engineering Dept. RIT Kottayam) and Dr. Bino I Koshy(Professor, RIT Kottayam), for their valuable support and suggestions during the work.
REFERENCES
[1] Goel,A., Das,A., “Ultra-Thin Concrete Overlays”, Proc. Seminar on Design Construction and Maintenance of Concrete Pavements, New Delhi, 2004.
[2] IRC: SP: 76-2008, “Tentative Guidelines for Conventional, Thin and Ultra-Thin Whitetopping, Indian Road Congress”, 2008. [3] IRC: SP: 30-2009, “Manual on Economic Evaluation of Highway Projects in India”, Second Revision, Indian Road Congress, 2009.
[4] Jain, S.S., Aggarwal, S., Parida, M. “HDM-4 Pavement Deterioration Models for Indian National Highway Network”, J. Trans. Eng., ASCE, 131(8), 2005.
[5] Kerali, H.G.R., “Overview of HDM4”, Vol. 1, HDM4 Documentation Series, Permanent Int. Association of Road Congresses (PIARC) -World Road Association, France, 2000.
[6] MORT&H 2001, “Report on Committee on Norms for Maintenance of Roads in India”, Ministry of Road Transport & Highways, Government of India, New Delhi.
[7] Odoki, J. B., Kerali, H.G.R., “Analytical Framework and Model Descriptions”, Vol. 4, HDM-4 Documentation Series, Permanent International. Association of Road Congresses (PIARC) -World Road Association, France, 2000.
[8] Sinha,V.K., Kumar,S., andJain, R.K .,“Whitetopping - A Cost-Effective Rehabilitation Alternative For Preserving Bituminous Pavements On Long-Term Basis”, J. Indian Road Congress, 68(3), 2007.
[9] Sreedevi, B.G., Salini, P.N., and Nair, S.B., “Field performance indicators for NRMB in a tropical setting”, Indian Highways, 47-57, 2011. [10] Whiteman, D.C., Eric, E.S., and Dakin, J M., “Software User Guide”, Vol. 3, HDM-4 Documentation Series, Permanent International