Manchester, United Kingdom - August 10-14, 2015
Division VII, Paper ID 371
SEISMIC FRAGILITY EVALUATION OF A REINFORCED CONCRETE
GROUNDWATER WELL USING NONLINEAR PUSHOVER ANALYSIS
Mohamed M. Talaat1, David K. Nakaki2, Philip S. Hashimoto3, and Yahya Y. Bayraktarli4
1
Senior Staff Engineer, Simpson Gumpertz & Heger Inc, USA; Adjunct Assistant Professor, Cairo University, Egypt
2
Senior Project Manager, Simpson Gumpertz & Heger Inc, USA
3
Senior Principal, Simpson Gumpertz & Heger Inc, USA
4
Head of Engineering Risk & Safety, BKW Energie AG, Switzerland
ABSTRACT
We performed a seismic fragility evaluation of a reinforced concrete groundwater well. Mühleberg Nuclear Power Plant (KKM) plans to use this existing well as an additional redundant cooling water supply source. The well is 11.75 m high and has a cylindrical shaft of 2.70 m outside diameter. For this entirely embedded and flexible structure, seismic response is largely determined by the displacements and stiffness of the surrounding soil. The well is unlikely to experience collapse due to seismic loading. However, sand and debris particles could infiltrate seismic-induced cracks in the well shaft and clog the submersible pumps or other pumps and filters downstream in the system. Seismic demand was determined using nonlinear static pushover analysis. A finite element model of the well and soil was constructed using nonlinear frame and spring elements in computer program SAP2000. Material nonlinearities included well cross section moment-rotation and soil pressure-displacement behaviors. Free-field horizontal soil displacements were imposed at the model boundaries for increasing levels of ground motion to identify the well deformation pattern and the location and progression of inelasticity in the flexural hinge region. Seismic capacity was defined as the peak ground acceleration where the deformation in the well shaft reaches the plastic hinge rotation capacity. The plastic rotation capacity corresponded to a concrete crack width that permits entry of particles large enough to clog the submersible pumps. The well seismic fragility was developed by the separation of variables approach to calculate the median seismic capacity and aleatory and epistemic lognormal standard deviations.
INTRODUCTION
KKM is performing a plant seismic probabilistic safety assessment (SPSA) with the goal of updating the
seismic core damage frequency (SCDF) and identifying the major risk contributors. The plant’s current
source of cooling water is the adjacent Aare River. KKM plans to secure an alternative source of cooling water by pumping water from an existing groundwater well near the Saane River to an elevated water reservoir near the KKM site. To include the benefit of the alternative cooling water supply in the updated SPSA, the seismic fragilities of its components must be evaluated. This paper develops the seismic fragility of the groundwater well.
PROBLEM DESCRIPTION
Groundwater Well Configuration
oriented radially at 3.0 m above the foundation level. The filter slot size of 3 mm. New submersible pumps and pipe will be installed to extract water from the well to the surface.
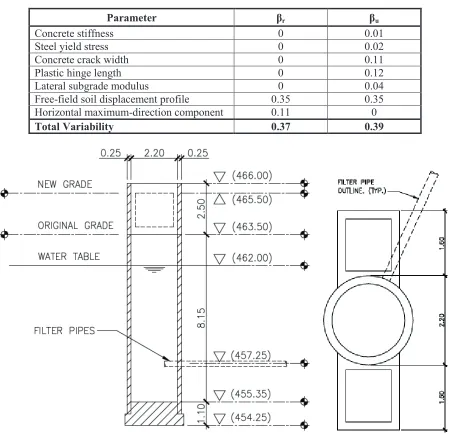
To prevent overtopping due to flood, the existing well will be extended by 2.50 m at the top and surrounded by soil backfill to raise the existing grade by 2.0 m. The foundation level will therefore be 11.25 m below new grade. The planned well configuration is shown schematically in Figure 1.
Median concrete cylinder compressive strengths are estimated to be 40 MPa and 46.7 MPa for the shaft and foundation, respectively, based on the specified strengths and the recommendations in Bamforth et al. (2008). Median concrete Young’s moduli are estimated to be 26.3 GPa and 28.4 GPa for the shaft and
foundation, respectively. Median steel yield stress and Young’s modulus are estimated to be 506 MPa
and 200 GPa, respectively.
Site Configuration
Site characterization was performed using probabilistic site response analysis in AMEC (2014a). The soil surrounding the well consists of about 3 m gravelly fill/disturbed alluvium deposits, over 1.5 m silty sand alluvium, over 5.3 m undisturbed alluvium, over weathered sandstone bedrock. Groundwater table is 3.5 m below new grade. Figure 2 shows the variation of median soil shear wave velocities with depth for several hard rock peak ground accelerations (PGAs), and the variation of secant lateral subgrade moduli with depth. The secant moduli correspond to the ultimate lateral pressure between the embedded well shaft and the surrounding soil that can lead to local yielding in the soil layers.
Seismic Input
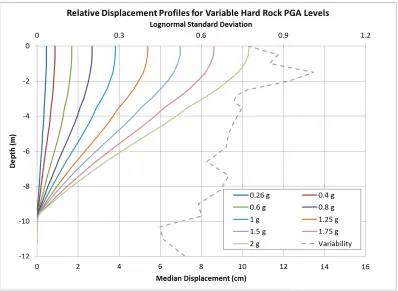
The well is an embedded concrete cylinder with a length to diameter ratio of about 4.5:1. Due to the relative flexibility of the well, its deformations during an earthquake are determined by the displacements and stiffnesses of the surrounding soil layers. Seismic input was defined by free-field soil displacement profiles. The displacement profiles were developed using probabilistic site response analysis in AMEC (2014a). The seismic deformations along the well shaft result from the layer displacements relative to the horizontal displacement at the well foundation. The imposition of horizontal displacements in all soil layers equal to the displacement at the foundation represents a rigid body mode in the well, with deformation occurring only in the soil layers beneath the foundation. Consequently, the horizontal free-field displacement at the foundation was removed from the free-free-field displacements to create a relative displacement profile. Figure 3 shows the median free-field relative displacement profiles corresponding to several hard rock PGAs. Also plotted on a secondary axis in Figure 3 is the composite variability for randomness and uncertainty.
Seismic input is based on the uniform hazard spectra (UHS) developed in the PEGASOS Refinement Project (PRP) December 2013 report (swissnuclear 2013). The displacement profiles represent the geometric mean of orthogonal horizontal earthquake components. The well response and capacity are essentially axi-symmetric, and can be analyzed using two-dimensional geometry subjected to the maximum-direction seismic input.
FINITE ELEMENT SIMULATION
23rd Conference on Structural Mechanics in Reactor Technology Manchester, United Kingdom - August 10-14, 2015 Division VII
the PGA at failure. The failure criterion was developed based on the maximum concrete crack width and the maximum grain size to ensure the continued operation of the submersible pumps.
Model Description
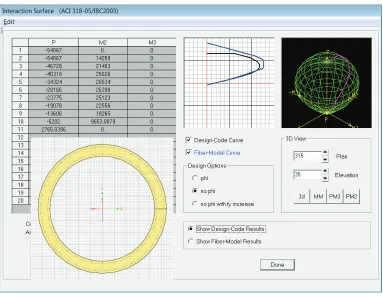
The SAP2000 model represented the well using frame elements and the surrounding soil layers using horizontal spring elements. Figure 4a shows an undeformed view of the SAP2000 model. The model origin is at the center of the well shaft at grade. The X and Y axes are oriented in the horizontal plane, and the Z axis is oriented upward, following the right-hand rule. The SAP2000 feature SectionDesigner was used to define the cross section properties of the shaft. This cross-section representation uses fiber discretization to account for nonlinear axial-flexure interaction. Concrete inelasticity was modeled using the Mander material model in SAP2000 (CSI 2010), although the response of the concrete in compression during this analysis remains essentially linear. Reinforcing steel inelasticity was modeled as elastic-perfectly plastic. Figure 5 shows the cross-section fiber discretization in SAP2000 and the corresponding axial-flexure interaction diagram. Inelasticity in the well shaft was defined at the ends of each frame element.
Soil springs were also modeled as elastic-perfectly plastic according to the best-estimate secant stiffness and ultimate capacities shown in Figure 2. Since the soil pushes against the well shaft on one face during a seismic event and does not pull on the opposite face, only one horizontal soil spring was used to represent each soil layer instead of two compression-only springs on opposite sides of the shaft. In addition, one horizontal soil spring was attached to the well foundation to represent the shear stiffness of the soil layer between the foundation and bedrock.
Nonlinear Pushover Analysis
The finite element model response was limited to the X-Z plane by restraining the out-of-plane degrees of freedom (DOFs). The foundation was restrained from vertical displacement and from rotation about the out-of-plane Y axis. The soil spring representing the equivalent shear stiffness of the soil medium beneath the foundation was attached to the foundation on one end and grounded (zero displacement) at the other end. The side soil springs were attached to the well shaft on one end and prescribed an imposed horizontal displacement at the free end. The unattached ends of the soil springs were restrained from vertical translation and from in-plane rotation. Figure 4b shows these boundary conditions. The relative free-field displacement profiles shown in Figure 3 were converted to maximum-direction component and imposed on the soil springs in separate load cases. Each load case represented a hard rock PGA demand and had a minimum of twenty sub-steps specified.
Pushover Analysis Results
SEISMIC FRAGILITY
Failure Criterion
Failure of the well to supply water after a seismic event can occur due to either functional or structural failure. Functional failure occurs if cracking in the well shaft is sufficient to permit infiltration of sand and debris with sizes large enough to clog the submersible pumps or other pumps and filters downstream in the system. Structural failure occurs if the well experiences severe distortion or collapse, which is only likely to occur at much higher deformations than would result in functional failure. Data from testing of four lightly reinforced concrete chimneys similar to the well was reported in Wilson (2011), with reported ultimate drift capacities of 1.5-2%. The well shaft supports lower axial stresses than the specimens tested by Wilson, which increases the drift capacity even further and provides ductile behavior after the moment capacity is reached. Therefore, functional failure governs the seismic fragility of the well.
The functional failure criterion was based on a maximum concrete crack width of 1.25 times the filter slot size of 3 mm, i.e. 3.75 mm. The 1.25 factor reflected the roughness and irregularity of a concrete crack extending across the shaft wall to allow 3 mm sand particles. Moreover, this maximum crack width is only present during shaking. Some crack closure will take place after the shaking stops, which may further limit the movement of sand particles across the crack surface. Therefore, there may be some conservatism in this failure criterion.
A relationship between concrete crack width and plastic hinge rotation in the shaft from the finite element analysis was developed based on ACI 224.2R-92 (ACI 1992). When subjected to flexure, the entire thickness of the well shaft on the tension side is subjected to a highly eccentric tension force that results in nearly uniform tensile stresses in the reinforcement on the inside and outside of the wall. The cracking behavior of this wall was judged to more closely resemble concrete cross section behavior in direct tension rather than in flexure. Equation 3.6 in ACI 224.2R-92 defines a median relationship between the maximum concrete crack width, wy, and the tensile stress in the reinforcement, and states that observed crack widths ±30% should be expected, as follows.
wy = [ksi units] (1)
where fs is the reinforcement stress; dc is the distance from the centreline of the reinforcement to the extreme concrete fiber; and Ac is double the gross area of the concrete cover between the tensile reinforcement and the finished concrete surface. This relationship is intended for service-level reinforced concrete behaviour, with reinforcement stresses below or at yield. The corresponding maximum crack width at yielding of the groundwater well reinforcement was calculated to be 0.58 mm. Yielding of the reinforcement will lead to proportional amplification of the existing crack widths in the inelastic zone, without the opening of new cracks. The total strain in the reinforcement at the limiting crack width was found by scaling the yield strain up by the ratio of 3.75 / 0.58. Equation 2 then calculates the limiting inelastic strain, εL,p, by subtracting out the elastic strain component.
εL,p = (3.75 / 0.58) fy / Es - fy / Es = 0.01383 (2)
where fy = 506 MPa and Es= 200 GPa are the reinforcement median yield stress and Young’s modulus, respectively. The maximum compressive strains in the concrete during the pushover analysis were minimal, so the neutral axis approximately coincided with the compression face. The curvature is nearly equal to the reinforcement strain divided by the cross-section diameter.
23rd Conference on Structural Mechanics in Reactor Technology Manchester, United Kingdom - August 10-14, 2015 Division VII
about 0.25 to 0.3 times the chimney diameter. In Wilson’s tests, the length of the plastic hinge was constrained by a reinforced concrete anchor block at the end of the concrete shaft. The effective plastic hinge lengths observed by Wilson accounted for yielding in the reinforcement above the failure plane only, while the reinforcement developed below the failure plane and into the thick concrete anchor block did not experience significant yielding. The groundwater well plastic zone takes place above the foundation. The effective plastic hinge length is taken as 0.5 times the diameter to represent yielding in the reinforcement both above and below the failure plane, i.e. yield penetration into the foundation. Equation 3 calculates the limiting plastic hinge rotation for loss of function, θL,p.
θL,p= (εL,p / Dc) (0.50 Dc) = 0.50 εL,p = 0.0069 rad (3)
This rotation capacity is significantly smaller than the ultimate rotation capacity for structural failure.
Median Ground Motion Capacity
The median ground motion capacity, Am, was determined based on linear interpolation of the data plotted in Figure 6. The hard rock PGA corresponding to plastic hinge rotation of 0.0069 rad is equal to 1.88g. Since the seismic fragility for KKM is defined in terms of the reference PGA at Elevation (-)14 m, the hard rock PGA of 1.88 g was converted to a PGA of Am = 2.30g at the reference elevation. This conversion followed the mapping relationship developed for KKM in AMEC (2014b), which is reproduced in Table 1.
Variability in Ground Motion Capacity
The major sources of variability are the well shaft stiffness, steel yield stress, concrete crack width relationship, plastic hinge length, lateral subgrade modulus soil free-field displacement profile, and horizontal maximum-direction component. The symbols βRand βU refer to lognormal standard deviations for randomness (aleatory) and uncertainty (epistemic) variabilities, respectively. The lognormal standard deviations were calculated independently from each source using the separation-of-variables method in Kennedy and Reed (1994) and then combined using the square-root-of-the-sum of squares (SRSS) method. The variability due to each source was calculated by comparing the median PGA capacity to the PGA capacity resulting from an induced perturbation in this source parameter value with other parameters at their median values. Source perturbations were induced according to the following characterization:
· Concrete stiffness: Based on βU= 0.30 for uncertainty in concrete Young’s modulus · Steel yield stress: Based on βU= 0.06 for uncertainty in steel Young’s modulus
· Concrete crack width: Based on 1.3 times the median having 84% non-exceedance probability
· Plastic hinge length: Based on 0.5 times the median having 95% exceedance probability
· Soil spring stiffness: Based on the upper-bound stiffnesses in Figure 2 having 84% non-exceedance probability
· Soil free-field displacement profile: Based on the composite variabilities shown in Figure 3, equally split between randomness and uncertainty
· Maximum-direction scale factor: Based on βR = 0.18 for randomness in horizontal components
( ) ( )
g e
e A
HCLPF R U
m 2.30 0.66
39 . 0 37 . 0 65 . 1 65 . 1 = =
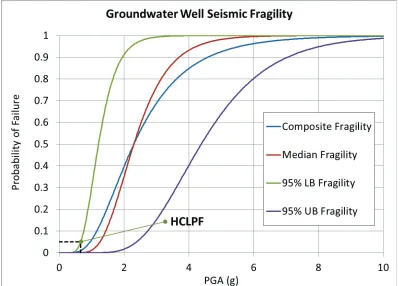
= - b +b - + (4)
This high capacity is consistent with past earthquake performance of buried structures. Relatively few failures of such structures have occurred because their deformations are limited by displacement of the surrounding soil.
CONCLUSION
The seismic fragility of the groundwater well was developed using nonlinear pushover analysis. The finite element model incorporated inelasticity in the concrete, steel, and soil material behaviour. Seismic-induced failure of the groundwater well was governed by loss of function due to the formation of cracks wide enough to allow seepage of sand and debris particles that can clog the submersible water pumps. Free-field horizontal displacement profiles were imposed on the well at increasing ground motion levels until the functional failure criterion was reached. The median seismic capacity was determined by finding the horizontal PGA at hard rock and reference elevation at which functional failure is predicted. Variability in the seismic capacity incorporated the major sources of randomness and uncertainty using the separation of variables method. The well has median and HCLPF PGA capacities of 2.30g and 0.66g, respectively, signifying substantial seismic capacity.
REFERENCES
AMEC Environment & Infrastructure, Inc. (2014a). Geotechnical Evaluation – Rewag, Report No. 14066.17RP.01, Revision 0, Oakland, California, April.
AMEC Environment & Infrastructure, Inc. (2014b). Geotechnical Evaluation – 2014 Probabilistic Safety Assessment Kernkraftwerk Mühleberg, Report No. 14066.16RP.01, Revision 0, Oakland, California, March.
American Concrete Institute. (1992). Cracking of Concrete Members in Direct Tension, ACI 224.2R-92, Farmington Hills, Michigan.
Bamforth, P., Chisholm, D. Gibbs, J., and Harrison, T. (2008). Properties of Concrete for Use in Eurocode 2, CCIP-029, The Concrete Center, Blackwater, Surrey, UK.
Computers & Structures, Inc. (2010). Computer Program SAP2000, Version 14.2.2, Berkeley, California. Kennedy, R.P. and Reed, J.W. (1994). Methodology for Developing Seismic Fragilities, EPRI
TR-103959, Electric Power Research Institute, Palo Alto, California.
swissnuclear (2013). PEGASOS Refinement Project - Probabilistic Seismic Hazard Analysis for Swiss Nuclear Power Plant Sites: Volume 2 – Results, Swiss Nuclear, Olten, Switzerland, December. Wilson, J. (2000). Earthquake Design and Analysis of Tall Reinforced Concrete Chimneys, PhD.
23rd Conference on Structural Mechanics in Reactor Technology Manchester, United Kingdom - August 10-14, 2015 Division VII
Table 1: Mapping of PGA between Hard Rock and Elevation (-)14 m.
Table 2: Lognormal Standard Deviations.
Parameter βr βu
Concrete stiffness 0 0.01
Steel yield stress 0 0.02
Concrete crack width 0 0.11
Plastic hinge length 0 0.12
Lateral subgrade modulus 0 0.04
Free-field soil displacement profile 0.35 0.35
Horizontal maximum-direction component 0.11 0
Total Variability 0.37 0.39
(a) Shear wave velocities (b) Secant lateral subgrade moduli
Figure 2. Depth Variation of Soil Properties, AMEC (2014a)
23rd Conference on Structural Mechanics in Reactor Technology Manchester, United Kingdom - August 10-14, 2015 Division VII
(a) Undeformed (b) Restraints (c) Deformed, PGA=1.75g (d) Deformed, PGA=2.0g
Figure 4. SAP2000 Model Views.
Figure 6. Median Plastic Hinge Rotation Response at Variable Hard Rock PGA Levels