ISSN: 2319-8753
I
nternational
J
ournal of
I
nnovative
R
esearch in
S
cience,
E
ngineering and
T
echnology
(An ISO 3297: 2007 Certified Organization)
Vol. 3, Issue 7, July 2014
Construction and Selection of Multiple
Deferred State (MDS-1) Variables Sampling
Plan Involving Minimum Sum of Risks
Dr. D. Senthilkumar1*, K. Lokanayaki2 , B. Esha Raffie2
Associate Professor, Department of Statistics, PSG College of Arts & Science, Coimbatore -14, Tamil Nadu, India1 Research Scholar, Department of Statistics, PSG College of Arts & Science, Coimbatore – 14, Tamil Nadu, India2
ABSTRACT: In this paper, Multiple Deferred State Variables Sampling Plan is presented. The plan parameters are determined by minimizing sum of risks for specified acceptable quality level and limiting quality level. Tables are constructed for the selection of parameters for this plan under the specific values of the producer’s and consumer’s risks indexed by acceptable quality level and limiting quality level, when the standard deviation is known and unknown for which the results are explained with examples.
KEY WORDS: Multiple Deferred State, Variables Sampling, Acceptable Quality level (AQL), Limiting Quality Level (LQL) and Minimum Sum of Risks.
I. INTRODUCTION
Acceptance sampling plan is a specific plan that clearly states the rules for sampling and the associated criteria for acceptance or otherwise. Acceptance sampling plans can be applied for inspection of end items, components, raw materials, operations, materials in process, supplies in storage, maintenance operations, data or records and administrative procedures. The above process involves attributes and variables. Quality is measured by observing the presence or absence of any characteristic or attribute in each of the units in the sample or lot under consideration, and the number of items counted which do or do not possess the quality attribute, or how many events occur in the unit area, etc in the attribute method. Variable sampling plans constitute one of the major areas of the theory and practice of acceptance sampling. The principle prerequisite for variables sampling is that the quality characteristic of interest is measured on a continuous scale. The primary advantage of the variables sampling plan is that the same operating characteristic (OC) curve can be obtained with a smaller sample size than would be required by an attributes sampling plan. Thus, a variables acceptance sampling plan would require less sampling. The variables sampling provides more information than the attributes sampling, and therefore the same protection is attained with partly considerable smaller sample size.
ISSN: 2319-8753
I
nternational
J
ournal of
I
nnovative
R
esearch in
S
cience,
E
ngineering and
T
echnology
(An ISO 3297: 2007 Certified Organization)
Vol. 3, Issue 7, July 2014
Copyright to IJIRSET www.ijirset.com 14233
producer’s and consumer’s risks indexed by AQL and LQL when the standard deviation is known and unknown. Subramani and Haridoss (2012) have developed a table and procedures for finding the multiple deferred state-1 (MDS-1) (c1, c2) sampling plan involving a minimum sum of producer’s and consumer’s risks for specified Acceptable
Quality Level and Limiting Quality Level.
In this paper, the procedure for designing Multiple Deferred State Variables Sampling Plan is obtained by minimizing the sum of risks given AQL and LQL. Extensive tables are provided for selection of parameters of the proposed plan for selected combinations of the two quality levels and the results are explained with examples.
II. MULTIPLE DEFERRED STATE VARIABLES SAMPLING PLAN (nσ ,mσ, kaσ, krσ)
The conditions and the assumptions under which the Multiple Deferred State Variables Sampling Plan can be applied are as follows;
CONDITIONS FOR APPLICATIONS
The cost or destructiveness of testing is such that a relatively small sample size is necessary although other factors make a large sample desirable.
The product to be inspected comprises a series of successive lots produced by a continuing process.
Normally, lots are expected to be of essentially the good quality.
The consumer has faith in the integrity of product.
BASIC ASSUMPTIONS
The following assumptions should be valid for application of the variables MDS plan.
Lots are submitted for inspection serially in the order of production from a process having a constant proportion of non-conforming.
The consumer has confidence in the supplier and there should be no reason to believe that a particular lot is poorer than the preceding or succeeding lots.
The quality characteristic of interest follows a normal distribution.
III. OPERATING PROCEDURE
The Operating Procedure of the Multiple Deferred State (MDS – 1) Variables Sampling Plan is as follows:
Step 1: For each lot, select a random sample of size nσ, (X1, X 2, .., Xnσ) from the submitted lot and compute σ
i i=1
σ
n 1
X= X
n
Step 2: Accept the lot if X +kaσ≤ U and reject the lot if X +krσ.> U.
Step 3: IfX +krσ<U< X +k σa then accept the current lot provided that the preceding or succeeding m lots were accepted on the condition that X +kaσ≤ U. The lot is otherwise rejected.
Thus, the proposed variables MDS plan is characterized by four parameters, namely nσ, m, kaσ and krσ. Where
nσ is sample size, krσ is acceptance constant, kaσ is conditional acceptance constant and mis number of future lots in
which conditional acceptance is based (m>0). If kaσ= krσ, then the proposed plan reduces to the variables single
ISSN: 2319-8753
I
nternational
J
ournal of
I
nnovative
R
esearch in
S
cience,
E
ngineering and
T
echnology
(An ISO 3297: 2007 Certified Organization)
Vol. 3, Issue 7, July 2014
When the lower specification limit L is required instead of U, the operating procedure would be same as above. Note that in the case of the multiple deferred state sampling plan, the forthcoming m lots will be considered for acceptance of the current lot, so that the accept/reject decision is effectively postponed.
CASE OF KNOWN STANDARD DEVIATION
MDS plans are designed by considering two points on the OC curve, namely (p1, 1- α) and (p2, β), where p1 is
called the acceptable quality level (AQL), p2is the limiting quality level (LQL), α is the producer’s risk and β is the
consumer’s risk. The proposed variables MDS plan minimizing the sum of risks under the restriction that a point on the OC curve has been fixed.
The fraction non-conforming in a lot will be defined by
p = 1- (v) =
(-v)
withv = (U -
μ ) /σ
and2 / 2 1
(y) (1)
2
z
e dz
y
where z ~ N (0, 1).
The OC function of the variables MDS sampling plan, which gives the proportion of lots that are expected to be accepted for a given lot quality p, is obtained by
mσ
a aσ rσ aσ aσ
P (p)
Pr{x
k
U | p} Pr{x
k
U
x
k
| p}[Pr{x
k
U | p}]
(2)
where the first term in the right hand side represents the probability of accepting a lot based on a single (current) sample and the second term is the probability of accepting a lot based on the stats of the preceding lots. The probability of acceptance of the lot can be written as
m
a 2 1 2 2
P (p)= w )+[ w )- w )][ w )]
(3) where
w
1
(z
p
k ) n
rσ σσ
2 p aσ
w
(z
k ) n
Let w11 be the value of w1 at p = AQL (or p1), w21 be the value of w2 at p = AQL, w12 be the value of w1 at p2 =
LQL and w22 be the value of w2 at p = LQL. If (AQL, 1-α) and (LQL, β) are prescribed, then we require mσ
a 1 21 11 21 21
P (p )= (w )+[ (w )- (w )][ (w )]
1
α
(4) and
mσ
a 2 22 12 22 22
P (p )= (w )+[ (w ) - (w )][ (w )]
β
(5) The expression for the sum of Producer’s and Consumer’s risk is given bya 1 a 2
α+β=1-P (p )+P (p ) (6)
For given AQL and LQL, the parametric values of MDS plan, namely nσ, kaσ, krσ , α and β are determined by
using a computer program.
A PROCEDURE FOR MDS SAMPLING PLAN WITH KNOWN SIGMA INVOLVING MINIMUM SUM OF RISKS
From Tables 1, 2 and 3, a procedure for designing Multiple Deferred State variables sampling plan involving minimum sum of risks for the given values of AQL and LQL is indicated below.
Tables 1, 2 and 3 are used to select the MDS for the given values of (AQL. 1- α),(LQL, β). The plans given
here have the minimum sum of risks fix the values of p1 and p2 from which a Multiple Deferred State variables
sampling plan can be selected under known σ- method. Entering the row giving p1and column giving p2, one gets the
acceptance criteria kaσ, krσ , α and β and the sample size nσ. For example, for given p1=0.002, p2= 0.005 and m=1, Table
ISSN: 2319-8753
I
nternational
J
ournal of
I
nnovative
R
esearch in
S
cience,
E
ngineering and
T
echnology
(An ISO 3297: 2007 Certified Organization)
Vol. 3, Issue 7, July 2014
Copyright to IJIRSET www.ijirset.com 14235
CASE OF UNKNOWN STANDARD DEVIATION
Whenever the standard deviation is unknown, we may use the sample standard deviation S instead of σ. In this case, the plan operates as follows:
Step 1: For each lot, select a random sample of size nS, (X1,X 2,..Xnσ) from the submitted lot compute where σ n i i=1 S 1 X= X
n
and2
i S
S
(X -X) /n -1.Step 2: Accept the lot if X +kaS ≤ U and reject the lot if X +krS .> U.
Step 3: If X+k Sr UX+k Sa then accept the current lot provided that the preceding or succeeding m lots were
accepted on the condition that X +kaS ≤ U. The lot is otherwise rejected
Thus, the proposed unknown sigma variables MDS plan is characterized by four parameters, namely nS, m, kaS
and krS. If kas = krs, then the proposed plan reduces to the single variables sampling plan with unknown standard
deviation. The determination of parameters of the unknown sigma plan is slightly different from the known sigma case. It is known that X +kasS for a large sample size approximately follows (see Hamaker, (1979), Duncan,
(1986)).
Therefore, the probability of accepting a lot based on a single sample is given approximately by
aS
as 2
aS S
U-k σ-μ
P{X U-k S|p}
(σ/ n 1+k /2
S
p aS 2
aS
n (z -k )
1+k /2
(7) If we let
S 1 p rs 2 rs
n
(y ) (z -k )
1+k /2
then the probability of acceptance under tightened inspection is considered
(y1). Similarly, if we lets 2 p as 2 as
n
(y ) (z -k )
1+k /2
then the probability of acceptance under normal inspection is considered
(y2). Hence, the lot acceptance probabilityfor the unknown sigma case is given by
ms
a 2 1 2 2
P (p)= (y )+[ (y )- (y )][ (y )]
(8)
Let y11 be the value of y1 at p = AQL (or p1), y21 be the value of y2 at p = AQL, y12 be the value of y1 at p =
LQL (or p2) and y22 be the value of y2 at p = LQL. If (AQL, 1 -α) and (LQL, β) are prescribed, then we require
P (p )= (y )+[ (y )- (y )][ (y )]a 1 21 11 21 21 ms 1 α (9)
and
ms a 2 22 12 22 22
P (p )= (y )+[ (y )- (y )][ (y )] β
(10)
A PROCEDURE FOR MDS SAMPLING PLAN WITH UNKNOWN SIGMA INVOLVING MINIMUM SUM OF RISKS
Tables 1, 2 and 3 are used to determine MDS(ns, kaS, krS) for specified values of p1and p2 . For example, if it is
desired to have a MDS(ns, kaS, krS) for given p1= 0.003 p2=0.005 and m =1,Table 1 gives ns= 567, kaS= 2.741,krS=
ISSN: 2319-8753
I
nternational
J
ournal of
I
nnovative
R
esearch in
S
cience,
E
ngineering and
T
echnology
(An ISO 3297: 2007 Certified Organization)
Vol. 3, Issue 7, July 2014
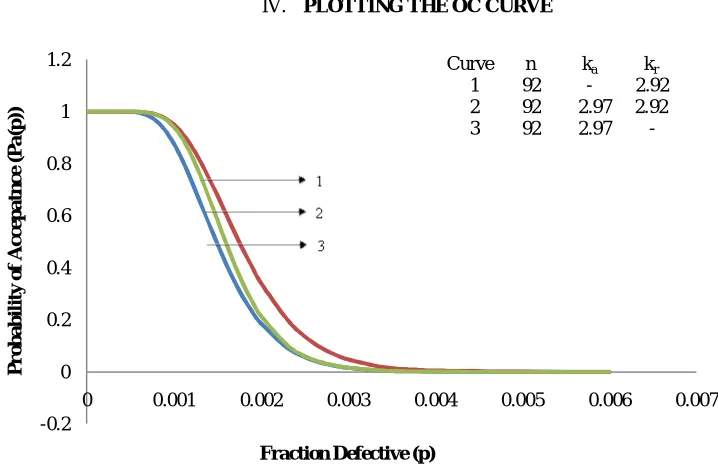
IV. PLOTTING THE OC CURVE
Figure 1: The OC curve of MDS-1(nσ; kaσ,krσ) variables sampling plans, curve 1, nσ = 92, krσ = 2.92,
α
= 7,β
=0;curve 2, nσ = 92, kaσ = 2.97, krσ = 2.92,
α
= 7, β= 0; curve 3, n = 92, kaσ = 2.97,α
= 7, β= 0;The OC curve of MDS-1(n; kaσ,krσ) variables sampling plans, curve 1, nσ = 92, krσ = 2.92,
α
= 7, β=0; curve2, n = 92, kaσ = 2.97, krσ = 2.92,
α
= 7, β= 0; curve 3, nσ = 92, kaσ = 2.97,α
= 7, β= 0;and Figure 1 shows that the OCcurves of multiple deferred state sampling by variables involving a minimum sum of the risks.
Figure 2 shows the OC curves of the variables MDS plan having different values of m and the same values of the AQL and LQL. It can be seen that the MDS plan with a larger value of m seems to be closer to the ideal OC curve.
Figure 2: mparison of OC curves with minimum sum of risks for MDS nσ = 59, kaσ= 2.90 and krσ = 2.88 when m=1;nσ
= 65, kaσ= 2.88 and krσ =2.86 when m=2;nσ = 71, kaσ= 2.88 and krσ = 2.86 when m= 3;
-0.2 0 0.2 0.4 0.6 0.8 1 1.2
0 0.001 0.002 0.003 0.004 0.005 0.006 0.007
P r o b a b il it y o f A c ce p a tn c e ( P a (p ))
Fraction Defective (p)
Curve n ka kr
1 92 - 2.92 2 92 2.97 2.92 3 92 2.97
--0.2 0 0.2 0.4 0.6 0.8 1 1.2
0 0.002 0.004 0.006 0.008 0.01
P r o b a b ilit y o f A c c e p ta n c e P a (p )
ISSN: 2319-8753
I
nternational
J
ournal of
I
nnovative
R
esearch in
S
cience,
E
ngineering and
T
echnology
(An ISO 3297: 2007 Certified Organization)
Vol. 3, Issue 7, July 2014
Copyright to IJIRSET www.ijirset.com 14237
V. CONSTRUCTION OF TABLE
The OC function of the variables MDS sampling plan, which gives the proportion of lots that are expected to be accepted for a given lot quality p, is obtained by using the expression (3) and (6).
The probability of acceptance of the lot in equation (2) can be expressed in equation (3). (AQL, 1-α) and (LQL, β) can be required in the expression (4) and (5). The expression for the sum of Producer’s and Consumer’s risks is given in the equation (6).For given AQL and LQL, the design parameters of the variables MDS plan, namely nσ, mσ,
kaσ and krσ, may be determined by satisfying the required producer and consumer conditions in equation (2) are obtained
using equation (6)
For given various values of AQL and LQL, the values of nσ, kaσ, krσ, ns, kaS, and krS are obtained by using
computer search routine through C++ programme. The values of the parameters (nσ, kaσ and krσ), when m= 1 and when
sigma is known and unknown are tabulated in Table 1. The above procedure followed by when m=2 and m=3, the value of the parameters are tabulated in Table 2 and Table 3.
Table 1, 2 and 3 provides the values of nσ, kaσ, krσ, ns, kas and krs which satisfying the equation (2) are obtained
using equation (6).
VI. CONCLUSION
In this paper, the optimal design parameters of the proposed plan are determined using the two points on the OC curve approach for Multiple Deferred State Variables Sampling Plan for given Acceptable Quality Level and Limiting Quality Level involving minimum risks.
REFERENCES
[1]. Balamurali, S.. and Kalyanasundaram, M., “Determination of conditional double sampling scheme”, Journal of Applied Statistics, Vol 26, No.8, pp.893-902, 1999.
[2]. Balamurali, S.. and Chi-Hyuck Jun, “Multiple dependent state sampling plans for lot acceptance based on measurement data”, European Journal of Operations Research, Vol.180, pp. 1221-1230, 2007.
[3]. Govindaraju, K. and Subramani, K., “Selection of Multiple deferred state MDS-1 sampling plan for given acceptable quality level and limiting quality level involving minimum risks”, Journal of Applied Statistics, Vol. 17, pp. 427-434, 1990.
[4]. Soundararajan, V. and Vijayaraghavan, R. “Construction and Selection of Multiple Deferred State Sampling Plan”, Journal of Applied Statistics, Vol.17, No.3, pp.397-409, 1990.
[5]. Subramani, K. and Haridoss, V. “Selection of Multiple Deferred State Sampling for given AQL and LQL involving Minimum Risks using Weighted Poisson Distribution”, 2012
[6]. Vaerst, R. “A Procedure to construct Multiple Deferred State Sampling Plan”, Methods of Operations Research, Vol. 37, pp. 477-485. 1982. [7]. Wortham, A.W and Baker, R.C, “Multiple Deferred State Sampling Inspection”, The International Journal of Production Research, Vol.14,
ISSN: 2319-8753
I
nternational
J
ournal of
I
nnovative
R
esearch in
S
cience,
E
ngineering and
T
echnology
(An ISO 3297: 2007 Certified Organization)
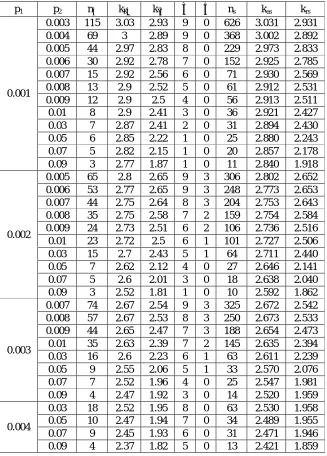
Vol. 3, Issue 7, July 2014
Table 1: Variables MDS sampling plans having mσ (or mS) = 1 indexed by AQL and LQL Involving Minimum Sum of
Risks
p1 p2 nσ kaσ krσ α β ns kas krs
0.001
0.003 115 3.03 2.93 9 0 626 3.031 2.931
0.004 69 3 2.89 9 0 368 3.002 2.892
0.005 44 2.97 2.83 8 0 229 2.973 2.833 0.006 30 2.92 2.78 7 0 152 2.925 2.785
0.007 15 2.92 2.56 6 0 71 2.930 2.569
0.008 13 2.9 2.52 5 0 61 2.912 2.531
0.009 12 2.9 2.5 4 0 56 2.913 2.511
0.01 8 2.9 2.41 3 0 36 2.921 2.427
0.03 7 2.87 2.41 2 0 31 2.894 2.430
0.05 6 2.85 2.22 1 0 25 2.880 2.243
0.07 5 2.82 2.15 1 0 20 2.857 2.178
0.09 3 2.77 1.87 1 0 11 2.840 1.918
0.002
0.005 65 2.8 2.65 9 3 306 2.802 2.652
0.006 53 2.77 2.65 9 3 248 2.773 2.653 0.007 44 2.75 2.64 8 3 204 2.753 2.643 0.008 35 2.75 2.58 7 2 159 2.754 2.584 0.009 24 2.73 2.51 6 2 106 2.736 2.516
0.01 23 2.72 2.5 6 1 101 2.727 2.506
0.03 15 2.7 2.43 5 1 64 2.711 2.440
0.05 7 2.62 2.12 4 0 27 2.646 2.141
0.07 5 2.6 2.01 3 0 18 2.638 2.040
0.09 3 2.52 1.81 1 0 10 2.592 1.862
0.003
0.007 74 2.67 2.54 9 3 325 2.672 2.542 0.008 57 2.67 2.53 8 3 250 2.673 2.533 0.009 44 2.65 2.47 7 3 188 2.654 2.473
0.01 35 2.63 2.39 7 2 145 2.635 2.394
0.03 16 2.6 2.23 6 1 63 2.611 2.239
0.05 9 2.55 2.06 5 1 33 2.570 2.076
0.07 7 2.52 1.96 4 0 25 2.547 1.981
0.09 4 2.47 1.92 3 0 14 2.520 1.959
0.004
0.03 18 2.52 1.95 8 0 63 2.530 1.958
0.05 10 2.47 1.94 7 0 34 2.489 1.955
0.07 9 2.45 1.93 6 0 31 2.471 1.946
ISSN: 2319-8753
I
nternational
J
ournal of
I
nnovative
R
esearch in
S
cience,
E
ngineering and
T
echnology
(An ISO 3297: 2007 Certified Organization)
Vol. 3, Issue 7, July 2014
Copyright to IJIRSET www.ijirset.com 14239
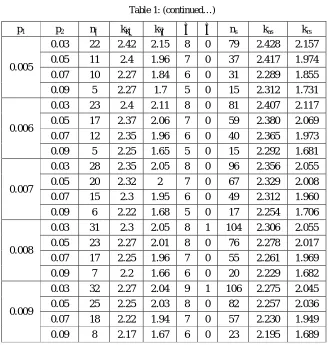
Table 1: (continued…)
p1 p2 nσ kaσ krσ α β ns kas krs
0.005
0.03 22 2.42 2.15 8 0 79 2.428 2.157
0.05 11 2.4 1.96 7 0 37 2.417 1.974
0.07 10 2.27 1.84 6 0 31 2.289 1.855
0.09 5 2.27 1.7 5 0 15 2.312 1.731
0.006
0.03 23 2.4 2.11 8 0 81 2.407 2.117
0.05 17 2.37 2.06 7 0 59 2.380 2.069
0.07 12 2.35 1.96 6 0 40 2.365 1.973
0.09 5 2.25 1.65 5 0 15 2.292 1.681
0.007
0.03 28 2.35 2.05 8 0 96 2.356 2.055
0.05 20 2.32 2 7 0 67 2.329 2.008
0.07 15 2.3 1.95 6 0 49 2.312 1.960
0.09 6 2.22 1.68 5 0 17 2.254 1.706
0.008
0.03 31 2.3 2.05 8 1 104 2.306 2.055
0.05 23 2.27 2.01 8 0 76 2.278 2.017
0.07 17 2.25 1.96 7 0 55 2.261 1.969
0.09 7 2.2 1.66 6 0 20 2.229 1.682
0.009
0.03 32 2.27 2.04 9 1 106 2.275 2.045
0.05 25 2.25 2.03 8 0 82 2.257 2.036
0.07 18 2.22 1.94 7 0 57 2.230 1.949
ISSN: 2319-8753
I
nternational
J
ournal of
I
nnovative
R
esearch in
S
cience,
E
ngineering and
T
echnology
(An ISO 3297: 2007 Certified Organization)
Vol. 3, Issue 7, July 2014
Table 2: Variables MDS sampling plans having mσ (or mS) = 2 indexed by AQL and LQL Involving Minimum Sum of
Risks
p1 p2 nσ Kaσ krσ α β ns kas krs
0.001
0.003 117 3.000 2.940 9 0 633 3.001 2.941 0.005 85 2.970 2.910 8 0 452 2.972 2.912 0.007 40 2.920 2.840 7 0 206 2.924 2.843 0.009 22 2.900 2.710 6 0 109 2.907 2.716
0.01 10 2.850 2.520 5 0 46 2.866 2.534
0.03 8 2.800 2.500 4 0 36 2.820 2.518
0.05 7 2.800 2.350 3 0 30 2.824 2.370
0.07 6 2.770 2.090 2 0 24 2.801 2.113
0.09 4 2.700 2.080 1 0 15 2.748 2.117
0.003
0.007 86 2.650 2.570 8 3 379 2.652 2.572 0.009 53 2.620 2.510 7 1 227 2.623 2.513
0.01 44 2.600 2.510 6 0 188 2.603 2.513
0.03 17 2.550 2.260 5 0 66 2.560 2.269
0.05 10 2.500 2.170 4 0 37 2.517 2.185
0.07 8 2.450 2.080 3 0 29 2.472 2.099
0.09 5 2.400 1.880 2 0 16 2.439 1.911
0.005
0.03 25 2.400 2.120 8 1 89 2.407 2.126
0.05 15 2.350 2.020 7 0 51 2.362 2.030
0.07 9 2.300 1.930 6 0 29 2.321 1.947
0.09 5 2.200 1.730 5 0 15 2.241 1.762
0.007
0.03 27 2.300 2.080 8 0 92 2.306 2.086
0.05 22 2.270 2.070 7 0 74 2.278 2.077
0.07 16 2.250 1.980 6 0 52 2.261 1.990
0.09 6 2.150 1.630 5 0 17 2.185 1.656
0.009
0.03 34 2.250 2.040 8 2 112 2.255 2.045
0.05 26 2.200 2.010 7 0 84 2.207 2.016
0.07 18 2.170 1.900 6 0 55 2.180 1.909
ISSN: 2319-8753
I
nternational
J
ournal of
I
nnovative
R
esearch in
S
cience,
E
ngineering and
T
echnology
(An ISO 3297: 2007 Certified Organization)
Vol. 3, Issue 7, July 2014
Copyright to IJIRSET www.ijirset.com 14241
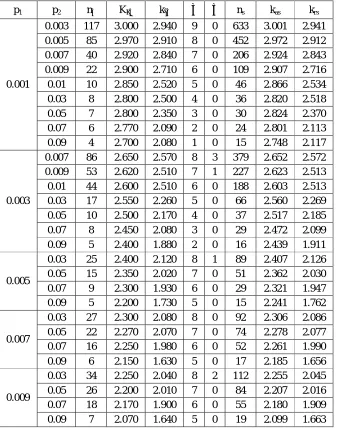
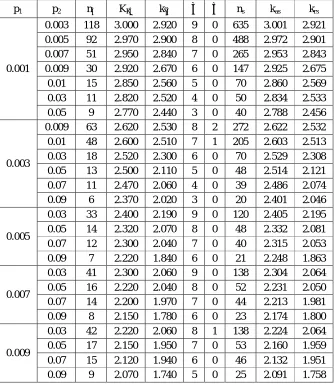
Table 3: Variables MDS sampling plans having mσ (or mS) = 3 indexed by AQL and LQL Involving Minimum Sum of
Risks
p1 p2 nσ Kaσ krσ α β ns kas krs
0.001
0.003 118 3.000 2.920 9 0 635 3.001 2.921 0.005 92 2.970 2.900 8 0 488 2.972 2.901 0.007 51 2.950 2.840 7 0 265 2.953 2.843 0.009 30 2.920 2.670 6 0 147 2.925 2.675
0.01 15 2.850 2.560 5 0 70 2.860 2.569
0.03 11 2.820 2.520 4 0 50 2.834 2.533
0.05 9 2.770 2.440 3 0 40 2.788 2.456
0.003
0.009 63 2.620 2.530 8 2 272 2.622 2.532
0.01 48 2.600 2.510 7 1 205 2.603 2.513
0.03 18 2.520 2.300 6 0 70 2.529 2.308
0.05 13 2.500 2.110 5 0 48 2.514 2.121
0.07 11 2.470 2.060 4 0 39 2.486 2.074
0.09 6 2.370 2.020 3 0 20 2.401 2.046
0.005
0.03 33 2.400 2.190 9 0 120 2.405 2.195
0.05 14 2.320 2.070 8 0 48 2.332 2.081
0.07 12 2.300 2.040 7 0 40 2.315 2.053
0.09 7 2.220 1.840 6 0 21 2.248 1.863
0.007
0.03 41 2.300 2.060 9 0 138 2.304 2.064
0.05 16 2.220 2.040 8 0 52 2.231 2.050
0.07 14 2.200 1.970 7 0 44 2.213 1.981
0.09 8 2.150 1.780 6 0 23 2.174 1.800
0.009
0.03 42 2.220 2.060 8 1 138 2.224 2.064
0.05 17 2.150 1.950 7 0 53 2.160 1.959
0.07 15 2.120 1.940 6 0 46 2.132 1.951