A Statistical Test of a Neutral Model
Using
the Dynamics
of
Cytonuclear Disequilibria
Susmita
Datta,* Mike
Kipar~ky,~
David M. Randt and
Jonathan
Arnoldf
*Department of Biostatistics, Rollins School of Public Health, Emory University, Atlanta, Geor ‘a 30322, tDepartment of Ecology and Evolutionary Biology, Brown University, Providence, m o d e Island 02912 and
gt
Department of Genetics,University of Georgia, Athens, Georgia 30602 Manuscript received February 26, 1996 Accepted for publication September 11, 1996
ABSTRACT
In this paper we use cytonuclear disequilibria to test the neutrality of mtDNA markers. The data considered here involve sample frequencies of cytonuclear genotypes subject to both statistical sampling variation as well as genetic sampling variation. First, we obtain the dynamics of the sample cytonuclear disequilibria assuming random drift alone as the source of genetic sampling variation. Next, we develop
a test statistic using cytonuclear disequilibria via the theory of generalized least squares to test the random drift model. The null distribution of the test statistic is shown to be approximately chi-squared using an asymptotic argument as well as computer simulation. Power of the test statistic is investigated under an alternative model with drift and selection. The method is illustrated using data from cage experiments utilizing different cytonuclear genotypes of Drosophila melunogaster. A program for imple- menting the neutrality test is available upon request.
C
ETONUCLEAR disequilibrium measures providenew inferential tools in analyzing hybrid zone data. In recent years, there has been increasing atten- tion on studying the association or interaction between
a nuclear gene or genotype and maternally inherited
cytoplasmic components such as mitochondria (see
LAMB and AVISE 1986; ASMUSSEN et al. 1987; ARNOLD 1993). Questions have arisen concerning whether or not these cytonuclear associations can be explained without invoking natural selection.
Since a significant amount of work in the last decade is based on neutrality of mitochondrial DNA (mtDNA) markers, a number of researchers have recently de- signed experiments to test the neutrality of mtDNA
markers (CLARK and LYCKEGAARD 1988; MACRAE and
ANDERSON 1988; FOS et al. 1990; POLLAK 1991; SCRIBNER and AVISE 1994a,b; S. T. KILPATRICK and D. M. RAND,
unpublished results; HUTTER and RAND 1995). We have
taken a different approach to test the neutrality of a mtDNA marker with measures of association of mtDNA
markers with nuclear genes or genotypes termed qyte
nuclear disequilibria.
Stochastic behavior of allelic disequilibria was ad-
dressed by FU and ARNOLD (1992). The dynamics of
cytonuclear genotypic disequilibria over different gen- erations have been described by DATTA et al. (1996). Stochastic trajectories of cytonuclear disequilibria cal- culated in Fu and ARNOLD (1992) and DATTA et al. (1996) were used to test the neutrality of mitochondrial
Cmesponding author: Jonathan Arnold, Department of Genetics, University of Georgia, Athens, GA 30602.
E-mail: [email protected]
Genetics 144: 1985-1992 (December, 1996)
DNA markers in a vertebrate cage experiment involving
two species of mosquito fish (SCRIBNER and AVISE 1994). In this experiment an artificial hybrid zone composed of two competing species of mosquito fish that inter- breed was established. Frequencies of cytonuclear geno- types and associated cytonuclear disequilibria were monitored over time and compared with their expecta- tions under drift.
In such an experiment there are two potential
sources of variation in cytonuclear frequencies, statisti- cal sampling variation and genetic sampling variation
(WEIR, 1990). Statistical sampling variation arises from sampling individuals from a population to estimate fre- quencies of cytonuclear genotypes (ASMUSSEN et aZ., 1987). Genetic sampling variation arises from genetic drift, the sampling of gametes from a finite breeding pool of individuals in nature to constitute the next gen- eration (Fu and ARNOLD 1992; DATTA et al. 1996). In
the experiment of SCRIBNER and AVISE (1994) in every
generation, all individuals from an entire population were sampled. As a consequence statistical sampling variation was eliminated, and only genetic sampling variation (i.e., drift) remained. This unusual design to
a cage experiment permitted DATTA and ARNOLD
(1996) to develop a simple neutrality test of a mtDNA marker using the observed trajectories of cytonuclear disequilibria. It is the purpose of this report to extend the domain of applicability of our neutrality test of an mtDNA marker to include cage experiments with both statistical and genetic sampling variation in cytonuclear disequilibria.
S.
Generation 0
Generation 1
Generation 2
b
b
b
experiment
Initial Population
I I
.
Population j Sample j
."__"____""""_.
Population
i
SamplePopulation
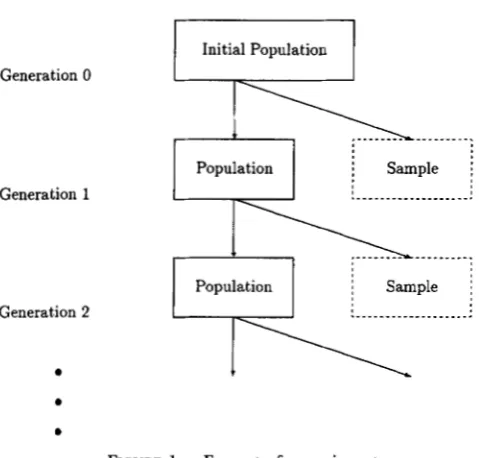
FIGURE 1.-Format of experiment.
than in DATTA and ARNOLD (1996). We note that a statistical test of neutrality of a single genetic locus was carried out by SCHAFFER et al. (1977) under a similar sampling scheme. We follow a similar ap- proach in testing whether or not the dynamics (over time) of the observed cytonuclear disequilibria are con- sistent with those expected under a random drift model. Tests of hypotheses about cytonuclear disequi- libria in the absence of genetic sampling variation have been considered by ASMUSSEN et al. (1987), FU and ARNOLD (1992), and ASMUSSEN and BASTEN (1994). The focus of this article is on a test of fit to a hypothe- sized drift process using sample estimates of cytonuclear disequilibria over time.
THE METHOD
Cytonuclear disequilibria: Let us suppose we observe a hybrid population at a nuclear locus with two alleles A and a, and at a cytoplasmic locus with alleles M and
m simultaneously as in SCRIBNER and AVISE (1994a). The frequencies of the respective cytonuclear genotypic classes are denoted by
PI,
. . .
,
ps, respectively. For exam- ple,pl
is the frequency of the class A A / M (see Table 1). Note that the same population can be represented in terms of the frequencies of their allelic combinations( A / M , A / m , a / M , a / m ) in Table
2.
TABLE I
Frequencies of cytonuclear genotypes
Nuclear genotype
Cytoplasm A A Aa aa Total
M P I P 2
ps
4m $4 P 5
ps
1 - 4Total U U W 1
TABLE 2
Frequencies of allelic combinations
Nuclear allele
Cytoplasm A U Total
M el = pl
+
p / 2
e3 =p ,
+
p / 2
Q m Q =p4
+ p / 2
e4 =ps
+
p / 2
1 - qTotal
P
1 - P 1Cytonuclear disequilibrium is defined to be the asso- ciation of nuclear genotypes or alleles with cytoplasmic alleles (ASMUSSEN et al. 1987). The following are the cytonuclear disequilibria corresponding to the homozy- gote A A / M and the heterozygote A a / M , respectively:
4
P,
- U q , (1)4
=p ,
- vq,(2)
where u =
P,
+
p4
and v =p ,
+
ps.
Similarly, the allelic disequilibrium is given byD = e1 -
pq,
(3)where
p
= el+
%, andq
= el+
e3, and the e,'s are the frequencies of the allelic combinations (Table 3). For detailed definitions and their moment dynamics we re- fer to DATTA et al. (1996).All the above quantities can be defined at the sample level, as well. We will supplement all of these variables with carets to denote their sample counterpart. For ex- ample, D l =
il
-2ia
denotes the sample disequilibrium corresponding toAA/M.
A statistical test based on disequilibrium dynamics:
From now on, we will consider a cage experiment with the sampling scheme in Figure 1. The experiment starts with an initial base population with nonzero allelic dis- equilibrium D =
4.
Generations are discrete and non- overlapping, and only a fixed number of randomly se- lected offspring of the previous generation are introduced into the cage, leading to genetic drift (Le.,genetic sampling variation). The offspring are allowed to mature, mate, and have offspring, and are removed from the cage to make room for the next generation. From the adults of generation t removed from the cage, a total of a( t ) adults are randomly sampled to estimate frequencies of cytonuclear genotypes in Table 1 (see Figure 1), leading to statistical sampling variation. Con-
TABLE 3
Gametic (allelic) disequilibrium
Nuclear allele
Cytoplasm A a Total
M e, = p q
+
D es = (1 - p ) q - D Qm a = p ( l - q ) - D ~ = ( l - p ) ( l - q ) + D 1 - q
sequently, the sample genotypic counts are multinomial with parameters equal to the cytonuclear genotypic fre- quencies
pl
( t ) ,.
. .
,
p6(t) of the tth generation of the population. In each generation these genotypic fre- quencies are the realization of a drift process. The model used here to describe the genetic sampling varia-tion is termed the random union of zygotes (RUZ)
model (WATTERSON 1970, 1972).
Genetic sampling variation: Let X@( t) be the number of individuals receiving gamete f from the father and gamete m from the mother at time t, and let x(t) =
(X11( t ) ,
.
.
.
,
&4( t ) ) be the vector of such counts. The probability distribution of the counts X(t) - given the gametic combination counts at time t - 1 , X(t - - 1 ) is multinomial and is given byPr(X(t) - =
$ 0
1x0
- 1 ) )where N( t) =
XJm
x@( t ) , J m = 1, 2, 3, 4 (WATTEFSON, 1970) and efand e, are frequencies of allelic combina- tions in fathers and mothers. It is not hard to see that the cytonuclear genotypic frequencies are linear combi- nations of the gametic combination counts Xfm (see e.g., DATTA et al. 1996). Therefore, one can find the condi- tional moment generating function ofpl,
. . .
,
&
at time t given the frequencies at time t - 1, which in turn extends to the calculation of the moments of the cyto- nuclear disequilibria, Dl and4.
See DATTA et al. (1996) for details.Statistical sampling variation: The estimated disequi- libria based on the statistical sample from the popula- tion at time t are given by
B ( 4
=1;dS
+
= n j ( t ) / n ( t ) , j = 1,
. . .
,
6 ,(7)
and nl ( t ) - q( t) are the genotypic counts in the sample from generation t = 0 , 1, * *.
Here the estimates are subject to multinomial sam- pling variation, conditional on the genotypic frequen- cies in Table 1 , at time t generated by the drift process. Total sampling variation: The total (statistical
+
ge- netic) variance and covariances of the cytonuclear dis- equilibria can now be calculated from the above model. These expectations are necessary to construct a neutral- ity test comparing observed and expected disequilibria.The (unconditional) variance of & t ) , i = 1 , 2, can be calculated by the formula
where $ and 5 stand for the genetic and the statistical
sampling, respectively. Now ignoring smaller terms of
the order O ( n " ( t ) A r ' ( t ) ) and O ( n - ' ( t ) ) , (i.e., terms like l / n ( t ) N ( t ) and l / n 2 ( t ) ) , we can obtain an approxi- mation for the first term in ( 8 ) :
Varf,(E5(Dj(t)))
=
Var,;(D,(t)), ( 9 )which can be calculated from the formulae given in
DATTA et al. (1996). Note that E,@,( t ) ) is calculated by differentiating the moment generating function of a
multinomial distribution with parameters n(t) and
pl(
t ) ,. . .
,
p6(
t ) . Direct calculation using the moment generating function and ignoring the higher orderterms shows that
E4Var5(fi1(t))) = -
(-(p$$
+
2dl-1$-$q0 - $401 n( t)
+
d:-1$ - d t - l h )+
pO(-d;-,&+
2d:-1g - dl-1&+
2dt-1&0+
&o - 3d?-1&0+
4dt-i&qo -&qo
+
Po&
- 2$& - 3dt-l&&+
2&& -&&
- 2d:-1&+
dt-lf$qo+
dt-1poqo+
6%
- dt-1&70 -&&)I,
( 1 0 ) wherepo
= p ( 0 ),
qo
= q(0) are the initial gene frequencies and dl-] = Ec,(D(t - 1 ) ) . In deriving the above formula, Var,(G (t) ) is calculated by arguments similar to those for E$(& (t)) from the multinomial statistical sampling. For calculating the second term, E,(Var,(a(t))), in ( 8 ) , we used the 6-method and the fact that expectations ofp
and q remain constant over generations. Using a result ofFu
and ARNOLD (1992), for the random drift model we findwhere Nj = N ( i ) , i 2 1.
- 48dt-,&&
+
866
+
24dt-1p&$ - 16&$- 56d,-16$
+
32&$+
32d,-1&$- 1 6 6 4
+
8&& - 16&&+
8&$)}. (12)For a complete understanding of the system we also need to calculate the total covariance between the sam- ple disequilibria as well. Covariances can occur between disequilibria in the same generation or disequilibria in different generations. Both are now calculated. The to- tal covariance between
Bl
( t ) and & ( t ) (Cov(Bl( t ) ,I&( t ) ) ) in the same generation is given by
c o v ~ j ( ~ ~ ( B l ( t ) ) , E \ ( & ( O ) )
+
ECj(Covs(B1(t), & ( t ) ) ) . (13)Using similar calculations as before and ignoring higher order terms, we find
c o v ( ~ l ( t ) , & ( t ) ) = COV,,(Dl(t), 4 ( t ) )
1
+
- {pO(8d;-lP, - l6d;-,& - 24d;-,&+
32d;-,&+
l6d;-& - l6d;-&+
3d,-,pOqO - 8d;-lpOqo+
2&qo - 4d?-l&qo+
16d:-1&q0+
64d,3_1&q0- 2 6 4 0 - 8Od:-&o - 120d:-l&qo
+
112d:-,&qO+
64d;-l&qo - 48d:-l&O - 4&& - 32&&- 32d:-1&&
+
4&$+
32d,-,&$+
152d,'-1&$4
t)- 112d,-,&& - 216d:-1p&$
+
128dt-,&&+
96d:-1&& - 48dt-1&& - 40d,-,p&$+
16&$+
144dt-,&$ - 4 8 6 4 - l68dt-,g$+
48&$+
64d,-lP:$ - 16&$ - 16&&+
48&& - 4 8 6 3+
16p$$)}, (14)where the first term Cov,(D,(t),
4(
t)) can be calculated following DATTA et al. (1996).The covariance between the estimates based on sam- ples from different generations are calculated next. For
1 5 i, j 5 2, t 2 0 , s 2 1, given 5 , the composition
of the population at time t,
Bi(t)
andBj(t
+
s) are independent. Also up to higher order terms,E(Bi( t )
I
Tt) = Di( t ) (15)and
E(B;(t
+
s)1 s )
= E ( E ( B j ( t+
s)I
Yt+JI
3,)= E(D,(t
+
s)1 s ) .
(16)It can be shown using the one-step conditional moment generating function ( cJ: DATTA, Fu, and ARNOLD 1996)
that the above quantity equals ((N,+,r - l)/N,+,)E(D(t
+
s -l)p(t
+
s - 1 ) ( 7 , ) , i f j = 1 and ( ( N , + , - 1)/N,+,)E(D(t
+
s - 1 ) ( 1 - 2p(t+
s - 1))17,), i f j = 2, which in turn, by the &method, is approximately equalto (follows from the dynamics of
D,
see ARNOLD and Fu 1992),where
rp
= p,,, if j = 1 and = 1 - 2p0 if j = 2. Note that the above product needs to be interpreted as 1 for s =1. Consequently one has, modulo higher order terms,
C0V(Bi(t),
Bj(
t+
s)) =(N+s
- 1)N+
s(17)
Once again, in the above equation Cov(Di( t ) ,
D(
t ) ) can be found using the recursions of the first two moments of Di( t ) in DATTA et al. (1996) and D ( t ) in Fu and AR- NOLD (1992). Note that in obtaining the first term of the above expression we have used the independence of the samples at times t and t+
s given the population at time t.Let the vector
Y
= (B1(1),.
,
Bl(4,
& ( I ) ,.
.
.
,
I & ( k ) ) (18)be the trajectory of sample disequilibria, f i l and
I&.
Note that
E ( B i ( t ) ) = Etr(E$(Bi(t))) = S(Di(t)), (19)
ignoring higher order terms, which is equal to a,&& if
i = 1 and a,(l - 2pO)& if i = 2. Thus, the trajectory of the sample disequilibria
Y
is approximately normally distributed with mean vector p = X p and variance- covariance matrix E, where X = [X,I
X,], X1 = ( al,. . .
,
~ k , 0,
. . .
, O ) ' , X2 = (0,. . .
, 0, ai,. . .
, Q ) ' , withP
=( P I , P d ,
PI
=&A,
PZ
= (1 - 2po)&. To recapitu- late, the trajectory of sample cytonuclear disequilibria is denoted by Y. The expectation of this trajectory is p.the earlier paragraphs. The normal approximation is just-ified when both n( 1) and N( t ) are large.
ivPutmlit?l test: With the mean vector p and the vari- ance-covariance matrix C of the estimated trajectory for
Bl
and D 2 , we can now construct a neutrality test bycomparing the inferred trajectory of cytonuclear dis- equilibria
(Y)
with its expectation over time ( p ) .If the initial values f i ) ,
qo
andDo
in the cage are known, one can use the following statistics to test the null hy- pothesis of a random drift model:T =
(Y
- P ) ~ Z ” ( Y - p ) , (20)which will have an approximate chi-square distribution with 2 k degrees of freedom. One would reject a random drift model if T
>
~ : ( 2 k ) , where ~ 2 ( 2 k ) is the upper a t h quantile of a chi-square distribution with 2 k degrees of freedom. However, often in practice, the composi- tion of the initial population (summarized byp )
is not known and only a simple random sample from it is available. In that case, we suggest (consistently) estimat- ing the variance covariance matrix C by substituting in the sample estimates f i ( O ) , q(0) and B(0) in places ofb,
qo
and do, respectively, in the expression forE
from (9)-
(14) and (17). Next, an overall estimate ofp
is obtained by the method of weighted least squares:fi
=(xrg-
IX)-1xtg-1y.
Finally, we could use the test statistic T =
(Y
- @ ) re-’
(Y
- @), which will have an approximately chi- square distribution with 2 ( k-
1) freedom under the random drift model. This proposition is validated with a simulation study fork
= 2. In the simulation we con- sidered that the initial generation had the frequenciesp ,
= 0.5 andp6
= 0.5, and all the subsequent genera-tions had constant generation size N = 500. In each simulation, random samples of constant sample size n
= 50 are generated for k
+
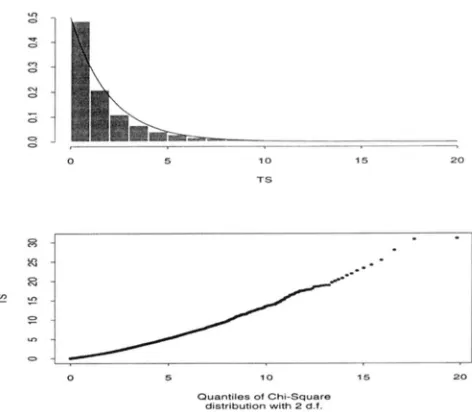
1 = 3 generations. The value of the test statistic is calculated for each simulation, and the entire process is repeated 5000 times. Conse- quently, we have 5000 independent realizations of the test statistic. A histogram wa5 drawn with these values, which is in good agreement with an overlaid true chi- square distribution with 2 degrees of freedom (Figure 2). The agreement is emphasized with a Q-
Q plotalso.
Note that for this neutrality test it is not necessary to
have sample data from all consecutive generations. It is easy to adjust and reinterpret the test statistic in such cases. Software for carrying out this neutrality test is available from the author ([email protected]). Instead of using the chi-square percentiles in con- structing the approximate rejection region of the test, one may resort to Monte Carlo simulation to find the exact Pvalue given a sample. This may be preferable if the sample sizes are small and one is afraid that the large sample distribution may not be adequate. Since
0 5 10 1s 20
TS
w ”
0 S i o ( 5 20
Qventlles 01 Chi-Squmre disWbullon with 2 d.f.
FIGURE 2.-Histogram and chisquared Q - Q plot based
on 5000 Monte-Carlo replications of the test statistic T. The
overlaid graph in solid line is the density of chi-squared distri- bution with 2 degrees of freedom.
the Pvalue calculation using present day computing is not expensive in terms of computing time, we anticipate that this approach may be preferred by many users.
If, in practice, the entire history of the generation sizes is not known, then one may use simple interpola- tion. We found that the test statistic is not too sensitive with respective to misspecification of the generation sizes.
RESULTS
An example: To illustrate our test procedure, we now consider a real cage experiment constituting artificial hybrid zone data on Drosophila melanogmter conducted by M. &PARSKY. The experiment uses controlled envi- ronmental conditions to study the effects of cytonuclear interaction in a population genetic context using genet- ically manipulated strains of D. melanogmtpr. The hy- brids were formed with the crosses of initial stocks of flies collected in Ega, Denmark and Death Valley, CA.
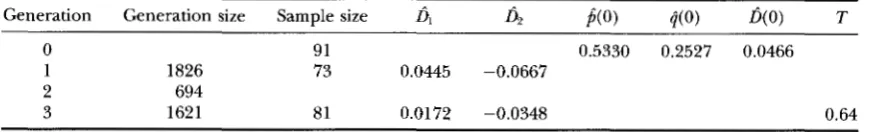
TABLE 4
Results for 60A locus
Generation Generation size Sample size
Bl
4
b(0) B(0) m ) T0 91 0.5330 0.2527 0.0466
1 1826 73 0.0445 -0.0667
2 694
3 1621 81 0.0172 -0.0348 0.64
T, test statistic.
reporting our results (Table 4 and Table 5) we rela- beled the generations starting from the first generation. Generation sizes, sample sizes, cytonuclear disequilibria and the value of the test statistic are reported on these
two nuclear loci in Tables 4 and 5 in combination with the mtDNA marker. The value of the test statistics at locus (DPP) is significant at the significance level IY = 0.05. This suggests random drift alone cannot explain the population dynamics adequately. Some other forces (such as selection) have to be taken into consideration to explain the dynamics. Conversely, at another locus (60A) the value of the test statistic was not significant at the same level, suggesting the neutral model (random drift) is consistent with the dynamics of the cytonuclear disequilibria.
When data were obtained for the third generation, values of the test statistic in both the loci were large enough, and Pvalues were very small (at 60A, value of the test statistic is 25.53 and the Pvalue is 0.00027, at the DPP locus they are 18.97 and 0.00421, respectively), which leads us to reject the null hypothesis of random drift and consequently to reject the neutrality of the mtDNA marker.
The null distribution of the test statistic is simulated with the same population and sample size as the 60A
locus. The values of the genotypic frequencies used for the initial generation were the same as those obtained from the initial generation sample, namely, 10/91, 13,’ 91, 0.0, 16/91, 32/91, 20/91 for
p , ,
. . .
,
p,,
respectively. For this simulation, we also assume that we have no sample information at the second generation. Under this scenario the value of the test statistic is generated 5000 times and a histogram is drawn. The histogram was overlaid with a true chi-square distribution with 2(k - 1) = 2 degrees of freedom. Next, a Q - Q plot isdrawn (Figure 3). Both of the plots are in good agree- ment with the true chi-square distribution.
A simulation study for the power of the test: We
conducted a simulation to calculate the power of the test proposed in this paper.
As
an alternative model we consider a special type of selection model that assumes that the genotypic frequencies in the population prior to mating (and hence prior to the statistical sampling) changes according to the following selection rule:pl
= p i w J a , i = 1,. . .
, 6,where = Xpiwt, w1 = ~3 = w4 = w6 = 1 and y = w5 = 1 - s with 0 5 s 5 1. Note that s = 0 corresponds
to no selection (see CLARK 1984).
In the initial generation the population had frequen- cies
pl
= 0.5 andp,
= 0.5, and in all subsequent genera- tions the population size N = 1000. Random samples of size n = 100 from each generation were collected, and the value of the test statistic was computed based on the entire sample. The process was repeated inde- pendently 5000 times. The power is estimated by the empirical proportion of times the value of the test statis- tic landed in the upper 5% tail of a chi-square distribu- tion with2
( k - 1) degrees of freedom, where k+
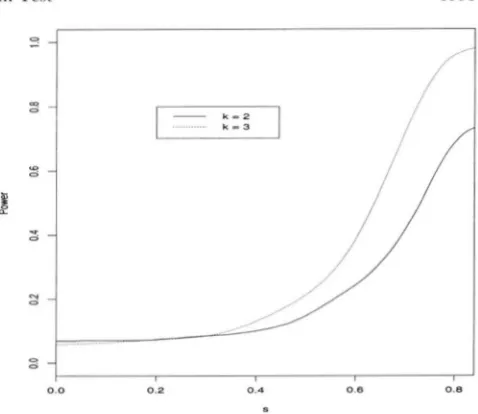
1 is the number of generations sampled.In Figure 3, the power curves are shown as functions of s for k = 2 and 3. The growth of the power curve is somewhat slow at the beginning, indicating that the test is unable to detect weak selection on heterozygotes. The power however increases rapidly after a stage. The test has better power if more generations are sampled, as to be expected. Also it would increase (not docu- mented here) if more individuals were sampled from each generation.
TABLE 5
Results for DPP locus
Generation Generation size Sample size D l f i 2 j ( 0 ) q(0) B ( 0 ) T
0 85 0.5118 0.2235 0.0327
1 1826 69 -0.0256 0.0078
2 694
3 1621 77 0.0587 -0.0712 18.5*
0 5 10 I 5 20
TS
0 5 10 15 20
Ouanlllea 01 Chi-Square d~alrlDuIlOn Wllh 2 d.1
FIGURE 3.-Histogram and chi-squared Q - Q plot hased
on 5000 Monte-Carlo replications of the test statistic Tusing the same population sizes and the same sample sizes as the 60A locus. Also the initial genotypic frequencies are taken to be the same as in the initial sample at the 60A locus. The overlaid graph in solid line is the density of chi-squared distri- bution with 2 degrees o f freedom.
DISCUSSlON
One of the strengths of this test is that it may be more sensitive to departures from neutrality than a test based on the history of gene frequencies at a single genetic locus, and we have found this to be the case in practice when several neutrality tests are applied to the same data set, such as the one in the example. Comparable power studies are underway. The test also takes into account both genetic and statistical sampling variation and can be applied to trajectories in which there are missing data either about the initial state of the cage population or about the state of the population at one
or more time points.
Disequilibria have been used by others (MUEILER pt
01. 1985; HEDRICK and THOMSON 1986) to test neutral-
ity. Our test is motivated by the one-locus test of FISHER and FORD (1947), but the test combines data on two
markers to enhance power. HEDRICK and THOMSON
(1986) constructed a two-locus test of neutrality, assum- ing the population is at steady state and resorted to simulation to generate a null distribution. Our test makes no steady-state assumption and requires n o simu- lation method to simulate i t s null distribution except for small samples, where the asymptotic chi-square dis- tribution may not be adequate. MUELLER et nl. (1985)
also constructed a test of neutrality, but their null hy-
pothesis was selection with randomly varying intensity, and again they generated a null distribution by simula- tion. Results presented here about our neutrality test in (21) are analytical, do not resort to the simulation for a null distribution of the test statistic and can be generalized to more complicated null hypotheses, such
0.0 0.2 0.4 0.0 0.8
FIGVRF. 4.-The power function o f the proposed test statis- tic under a selection model as a function o f the selection coefficient s, hased on samples of size n = 100 from each
generation of size iV = 1000.
as genetic hitchhiking of a mitochondrial DNA marker
with respected to a selected nuclear locus (CIARK,
1984). M'e have also shown that o u r neutrality test has reasonable small to moderate sample properties ( i . ~ . ,
Figures 2 and 3) , which makes it useful i n practice. There are several limitations to the test. M'e have only shown the validity of the test when generations are discrete and nonoverlapping. Our neutrality test has only been shown to be valid under one kind of design for a cage experiment (Figure 1). " h e n selection is weak (s 5 0.4), the power to detect selection can be
quite low (Figure 4). This is in contrast to the power
curves under an alternative with migration alone
(DATTA and ARNOIB 1996), where power curves in-
crease much more rapidly with the migration rate m. Lastly, the history of the generation sizes is assumed
to be available; although in practice, one can use the interpolated values if some are missing.
There are a number of extensions to this work that
are needed. Power calculations are needed under a
broader range of alternatives to the neutral model. The validity of the test in (20) needs to be examined for other sampling designs for cage experiments. Compara- tive studies with other neutrality tests needed to be made.
M'e thank ROB DE.\N, R ~ . T I I F r ' s ~ m : ~ , and MARIA S:\SCIII.Z for their helpful comments. Comments by twn anonymous referees greatly improvcd thc manuscript.
LITERATURE CITED
A R N ~ I . I ) , J., 1993 Cytonuclear disequilibria in hybrid zones. Annu. Rev. Ecol. Syst. 24: 521 -.i54.
Assll.ssl:.s, h4. A., J. A R S O I . I > and J .
<:.
AVISE, 198i Definition and properties of tlisequilihrium statistics for associations between nuclear and cytoplasmic genotypes. Genetics 1 1 5 7.55-i68. t\s\!r'ssl;s, M. A , , and (;. R . ~ s r ~ . s . 1994 Sampling theoly for cytn-AVISE, J. C., 1994 Mokcular Markers, Natural Histmy and Evolution.
Chapman and Hall, New York.
CLARK, A. G., 1984 Natural selection with nuclear and cytoplasmic transmission. I. A deterministic model. Genetics 107: 679-701.
CLARK, A. G., and E. M. S. LYCKEGAARD, 1988 Natural selection with nuclear and cytoplasmic transmission. 111. Joint analysis of segre- gation and mtDNA in Drosophila melanogmter. Genetics 118: 471 -
481.
DATTA, S., Y. X. Fu and J. ARNOLD, 1996 Dynamics and equilibrium behavior of cytonuclear disequilibria under genetic drift, muta- tion, and migration. Theor. Popul. Biol. (in press).
DATTA, S., and J. ARNOLD, 1996 Diagnostics and a statistical test of
neutrality hypotheses using the dynamics of cytonuclear disequi- libria. Biometrics 52: 1042-1054.
FISHER, R. A., and E. B. FORD, 1947 The spread of a gene in natural conditions in a colony of the moth Panaxia dominula L. Heredity Fos, M., M. A. DOMINGUEZ,A. LAToRREandA. MOYA, 1990 Mitochon- drial DNA evolution in experimental populations of Drosophila pseudoobscura. Proc. Natl. Acad. Sci. USA 87: 4198-4201.
Fu, Y. X., and J. ARNOLD, 1992 Dynamics of cytonuclear disequilib- ria in finite populations and a comparison with a two-locus nu- clear system. Theor. Popul. Biol. 41: 1-25.
Fu, Y. X., and J. ARNOLD, 1992 A table of exact sample sizes with Fisher's exact test for 2 X 2 tables. Biometrics 48: 1103-1112.
HEDRICK, P. W., and G. THOMSON, 1986 A two locus neutrality test: applications to humans, E. Coli, and lodgepole pine. Genetics
112: 135-156.
1: 143-174.
HUTTER, C. M., and D. M. RAND, 1994 Competition between mito- chondrial haplotypes in distinct nuclear genetic environments:
Drosophila pseudoobscura versus Drosophila persirnilis. Genetics 141:
1113-1124.
MACRAE, A,, and W. W. ANDERSON, 1988 Evidence of non-neutrality
of mitochondrial DNA haplotypes in Drosophilapseudoobscura. Ge-
netics 127: 411-416.
MUELLER, L. D., B. A. WILCOX, P. R. EHRLICH, D. G . HECKEI. and D. G.
MURPHY, 1985 A direct assessment of the role of genetic drift in determining allele frequency variation in populations of Eu- phyd?ym editha. Genetics 110: 495-511.
POLLAK, P. E., 1991 Cytoplasmic effects on components of fitness in tobacco hybrids. Evolution 45: 785-790.
S C ~ R , H. E., D. YARDLEY and W. W. ANDERSON, 1977 Drift or
selection: test of gene frequency variation over generations. Ge- netics 87: 371-379.
SCRIBNER, K. T., and J. C. AVISE, 1994a Population cage experiments with a vertebrate: genetics of hybridization in Gambusia fishes. Evolution 48: 155-171.
SCRIBNER, K. T., and J. C. AVISE, 1994b Cytonuclear genetics of ex- perimental fish hybrid zone inside biosphere 2. Proc. Natl. Acad. Sci. USA 91: 5066-5069.
WATTERSON, G.A., 1970 The effect of linkage in finite random- mating population. Theor. Popul. Biol. 1: 72-87.
WATTERSON, G. A,, 1972 Errata. Theor. Popul. Biol. 3: 117.
WEIR, B. S., 1990 Genetic Data Analysis. Sinauer Assoc., Sunderland,
MA.