Copyright2001 by the Genetics Society of America
ODS2: A Multiplatform Software Application for Creating Integrated
Physical and Genetic Maps
David Hall,*
,†Suchendra M. Bhandarkar* and Jian Wang
†*Department of Computer Science,†Department of Genetics, The University of Georgia, Athens, Georgia 30602-7404 Manuscript received September 1, 2000
Accepted for publication December 8, 2000
ABSTRACT
A contig map is a physical map that shows the native order of a library of overlapping genomic clones. One common method for creating such maps involves using hybridization to detect clone overlaps. False-positive and false-negative hybridization errors, the presence of chimeric clones, and gaps in library coverage lead to ambiguity and error in the clone order. Genomes with good genetic maps, such as Neurospora crassa, provide a means for reducing ambiguities and errors when constructing contig maps if clones can be anchored with genetic markers to the genetic map. A software application called ODS2 for creating contig maps based on clone-clone hybridization data is presented. This application is also designed to exploit partial ordering information provided by anchorage of clones to a genetic map. This information, along with clone-clone hybridization data, is used by a clone ordering algorithm and is represented graphically, allowing users to interactively align physical and genetic maps. ODS2 has a graphical user interface and is implemented entirely in Java, so it runs on multiple platforms. Other features include the flexibility of storing data in a local file or relational database and the ability to create full or minimum tiling contig maps.
A
contig map is a physical map that shows the native mated to be 0.5 and 10%, respectively (R. A. Prade, J.order of a library of overlapping genomic clones. Griffith, K. Kochut, J. Arnold and W. E.
Tim-Such maps help in the positional cloning of genes, serve berlake,personal communication). In restriction en-as a framework for whole genome sequencing (Chuma- zyme fingerprinting, gel electrophoresis is commonly
kovet al.1995;McPherson1997), and are used in the used to measure the size of restriction fragments. A study of the large-scale organization of genomes (Prade problem with this method is that different fragments et al.1997). Approaches that have been used to infer having similar lengths may appear to be a single frag-the order of libraries of clones include fingerprinting, ment. This is known as fragment collapsing (Gillett
assaying for sequence-tagged sites (STSs), and direct et al.1995). Clone chimerism is a problem associated detection of clone overlaps. Clones may be fingerprinted with all mapping protocols. Chimerism is especially by treatment with restriction enzymes and measurement common with certain cloning vectors, such as yeast arti-of the sizes arti-of the resulting fragments (Coulsonet al. ficial chromosomes. Finally, there are typically gaps in 1986;Olsonet al.1986). Another fingerprinting method library coverage that create contig breaks. The relative is based on hybridization of oligonucleotide probes order and orientation of contigs cannot be deduced (Lehrach et al. 1990). Sequence-tagged sites can be without additional data (GreenbergandIstrail1995). detected with the polymerase chain reaction (Green Many algorithmic approaches have been developed
and Olson 1990). Hybridization (Prade et al. 1997) to recover the native order of clones with noisy data. and DNA sequencing (Venteret al.1996) can be used Algorithms for restriction enzyme fingerprinting data
to detect clone overlaps directly. are given in Coulson et al. (1986), Carrano et al.
There are a number of types of errors associated with (1989), Stallings et al. (1990), and Gillett et al. these protocols that make recovery of the native clone (1995). Algorithms for oligonucleotide hybridization order difficult. False-positive and false-negative PCR and data are given in Cuticchia et al. (1992), Fu et al. hybridization results are common. For example, false- (1992), and Mayraz and Shamir (1999). Algorithms positive and false-negative error rates for theAspergillus for STS content and clone hybridization data are given nidulans mapping project (Prade et al. 1997), which in Cuticchia et al.(1992), Mottet al.(1993), Wang used hybridization to detect clone overlaps, were esti- et al. (1994), Alizadehet al. (1995),Greenberg and
Istrail (1995), Nadkarniet al. (1996),Bhandarkar
and Machaka (1997), Christoff et al. (1997), Jain
Corresponding author:Suchendra M. Bhandarkar, Department of andMyers(1997),ChristoffandKececioglu(1999), Computer Science, The University of Georgia, 415 Boyd Graduate
Kececioglu et al. (2000), and Tsai and Kao (2000). Studies Research Ctr., Athens, GA 30602-7404.
E-mail: [email protected] An algorithm that uses both clone hybridization data
and restriction enzyme fingerprinting is described in hybridization data. The program ODS was used in the construction of the A. nidulans physical maps (Prade SasinowskaandSasinowski (1999).
A number of freely available software applications for et al. 1997). The programs Probeorder, Costig, and Barwere used in the mapping of theSchizosaccharomyces creating contig maps have been developed over the
past decade. Applications for restriction digestion data pombegenome (Mottet al.1993). Neither of these ap-plications contains any direct support for integrating include CONTIG9 (Sulstonet al.1988),GRAM(
Sod-erlundandMcGarvan1993), and FPC (Soderlund physical and genetic maps, however. In this article we report an updated version of the ODS package called et al.1997). A number of applications have been
devel-oped for creating STS marker maps. These include SEG- ODS2. It uses a modified version of the algorithm fea-tured in ODS that incorporates genetic mapping data MAP (Green andGreen 1991; Magness et al. 1994),
ContigMaker (Suyama1993), CONTIGMAKER (Daly as well as clone-clone hybridization data. ODS2 has a graphical user interface and was implemented in Java, et al.1994), SAM (SoderlundandDunham1995), and
Contig Explorer (Nadkarni et al.1996). Applications so it runs on multiple platforms (e.g., UNIX and MS Windows). It also features a graphical tool for displaying for creating contig maps using clone hybridization data
include Probeorder, Costig, and Bar (Mottet al.1993), and editing maps. We discuss these features and illus-trate the use of the software in the construction of a and ODS (Cuticchia et al. 1993), which was also
de-signed for oligonucleotide fingerprinting data. preliminary map ofN. crassalinkage group VI. An effort is currently under way to create
high-resolu-tion cosmid-based contig maps of the fungusNeurospora
MATERIALS AND METHODS crassa (http://gene.genetics.uga.edu; Aign et al. 2001;
Bhandarkaret al. 2001;Kelkaret al. 2001). The ap- Cosmid libraries used to construct the physical maps in proach that is being taken uses hybridization to detect Figures 5 and 6 are described inKelkaret al.(2001). Physical mapping data as shown in Figure 6 were generated by DNA overlaps between 40-kb cosmids. A hybridization-based
hybridization described inKelkaret al.(2001). Assignments protocol is advantageous in that a high degree of
paral-of markers to physical and genetic maps was achieved by com-lelism can be achieved. DNA from thousands of clones plementation, hybridization, and cosmid end sequencing as can be fixed to the same nylon filter and simultaneously described inKelkaret al.(2001).
probed for hybridization with a clone. If the clones have been assigned to chromosomes, then the probings can
ALGORITHM be done with a mixture of clones, one from each
chro-mosome, to achieve a speedup proportional to the
num-Description of clone ordering algorithm: The clone ber of chromosomes. Additionally, robotics systems can
ordering algorithm used by ODS2 is a modification of be extensively utilized in the process to increase
labora-that used in ODS (Cuticchia et al. 1993). The algo-tory throughput (ArnoldandCushion1999).
rithms used by ODS are based on Hamming distance Although a hybridization-based approach is relatively
and simulated annealing. Briefly, the Hamming dis-inexpensive due to the economy of scale that can be
tance between each pair of clones is computed. The realized, the reliability of maps created using only
hy-Hamming distance between two clones is the number bridization data is considered to be less than that for
of probes hybridizing to one clone, but not to both. maps constructed using STS content data (Sasinowska
Simulated annealing is then used to search for a permu-andSasinowski 1999). N. crassahas a long history of
tation of clones that minimizes the sum of Hamming genetic study and, consequently, rich genetic maps are distances between each pair of adjacent clones. available for this organism (Perkins2000). An effort is The algorithm used by ODS2 incorporates the follow-being made in the Neurospora mapping project to an- ing modifications and enhancements over the one used chor clones to these genetic maps through direct ge- by ODS. First, the Hamming distances between probes netic complementation, hybridization to clones known
are computed and the probes are ordered instead of to complement mapped mutations, and BLAST search
clones. LetC⫽c1,c2, . . . ,c|C|denote the set of clones.
with available clone sequence data such as cosmid
end-Let P ⫽ p1, p2, . . . , p|P| denote the set of probes. Let
sequence data (Kelkaret al. 2001). This genetic data
P⫽p2,p2, . . . ,p|P|denote an ordering (or permuta-will help researchers to construct more reliable maps.
tion) of the probes. Let D denote a binary matrix of First, it will allow anchored contigs to be placed in the
size |C| ⫻ |P|, where Di,j is 1 if clone ci is believed to
correct position and orientation relative to one another.
contain probepjbased on experimental data, or 0
other-Second, it will help researchers detect and correct false
wise. LetDdenote a matrix derived fromDby permut-joins. These occur when multiple contigs appear to be a
ing the columns to correspond to the probe ordering single contig due to false-positive errors and chimerism.
P. The Hamming-distance traveling salesman objective Of the existing software, ODS (Cuticchiaet al.1993),
function is given by Probeorder, Costig, and Bar (Mottet al.1993) are the
most suitable in that they were designed for building
F(P)⫽
兺
|P|⫺1i⫽1
兺
|C|
j⫽1
where 丣 is the Boolean exclusive or operation. This modification was made to decrease the runtime of the algorithm, as the set of probes is a subset of the set of clones. After ordering the probes, the clones are placed within the probe order as follows. For a given clone, the longest contiguous sequence of probes that hybrid-ize with the clone is found, if such a sequence exists. The clone is placed in the map such that it spans across these probes. This approach of ordering probes and then fitting clones to the probe order is also described inMottet al.(1993). If more than one such sequence is present, then the clone cannot be placed unambigu-ously in the map. Such clones are randomly placed in one of the possible positions. These clones with ambigu-ous location are indicated to the user by color coding. The user may then choose to eliminate these clones from the map or use genetic complementation data, if available, to correctly place the clones. Of course, clones that do not hybridize to any probes cannot be placed in the map.
The second modification to the algorithm is the use of the microcanonical annealing search algorithm (Creutz
1983) instead of simulated annealing. Microcanonical annealing was found to achieve levels of optimization as good as simulated annealing and to do so an order of magnitude faster (BhandarkarandMachaka1997).
This algorithm, as adapted for clone ordering, is shown Figure1.—The microcanonical annealing algorithm search algorithm used by ODS2.Nis the number of probes. Parame-in Figure 1.
ters that were used are as follows:Emax⫽ 0.5; factor⫽ 0.5; The third modification is a weighted penalty valueφ
K⫽3; MAXCOUNT⫽100⫻N. that is added to the sum of Hamming distancesF(P).
This penalty is related to the number of misplaced
an-chored clones. When a given permutation of probes is φ
2⫽ ␣
兺
1ⱕi⬍jⱕ|A|
R(ai,aj). (4)
being evaluated by the algorithm, the subset of clones that are anchored to the genetic map are placed
with-The penalty functionφ2penalizes each pair of markers in the probe ordering as described above. Let A ⫽
in A whose order relative to each other is incorrect.
⬍a1,a2, . . . ,a|A|⬎ denote a permutation of anchored
Sinceφ2exploits only the pairwise ordinal information clones. Let pos(ai) return the position in the genetic
between markers it can handle partially ordered marker map of the marker to whichai is anchored. One of the
information. As before,␣is a scaling factor that can be penalty functionsφ1used by ODS2 is given by
adjusted by the user. Note thatφ2has a minimum value when the order of markers implied byAis the same
φ1⫽ ␣
兺
|A|⫺1
i⫽0
|pos(ai)⫺ pos(ai⫹1)|. (2)
as the order of markers in the genetic map.
The third objective function φ3 is described in Jain The variable␣ is a scaling factor that can be adjusted andMyers(1997) and can be expressed as
by the user. When ␣ is set to a higher value, more
φ3⫽ ␣(|A| ⫺lis(A)), (5)
emphasis is placed on genetic complementation data. Note that this penalty is a minimum for a given␣when
where lis(A) is the length of the longest increasing the order of markers implied byAis the same as the
subsequence inA. As before,␣is a scaling factor that order of markers in the genetic map.
can be set by the user.
The second penalty function φ2 used by ODS2 does Evaluation of the algorithm on simulated data: The not require the set of markers to be completely ordered.
probe ordering algorithm in ODS2 was tested with the Fori⬍j, let
three penalty functionsφ1,φ2, andφ3described above on simulated data modeled after data from theA. nidulans R(ai,aj)⫽
1, ifai is to the right ofaj in the genetic map
0, otherwise. physical mapping project (Pradeet al. 1997). A 4-Mb
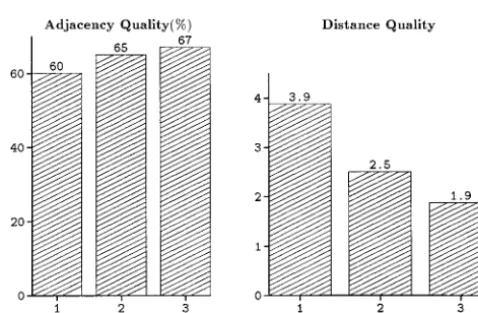
Figure2.—Adjacency and dis-tance qualityvs.the average num-ber of anchors per contig. Probes were ordered using the microca-nonical annealing algorithm and the Hamming-distance traveling salesman objective functionF(P) by itself (HAM) and augmented with each of the penalty functions
φ1[HAM⫹(1)],φ2[HAM⫹(2)], andφ3[HAM⫹(3)]. Each point represents the mean of 50 sepa-rate problem incidences on simu-lated data.
selected without replacement from the clones to give a strongly correlated with the distribution of the anchored markers. Two probes are connected if they are believed probe coverage of 0.8. A probe-clone incidence matrix
was generated by scoring all overlapping clone and to be incident to the same clone. A contig of probes is a set of probes where each probe in that contig is con-probe pairs as 1 and all nonoverlapping pairs as 0.
False-positive and false-negative errors were introduced at nected to at least one other probe in the contig, and no probes are connected to a probe in any other contig. random into the matrix at the rates of 1 and 20%,
respectively. The simulated data were prefiltered for It was shown that the greatest improvements in map quality came when there were a sufficient number of removal of potential false-positive errors using an
algo-rithm proposed byMottet al.(1993). anchored markers distributed uniformly among the
probe contigs. During preliminary simulations it became apparent
permu-TABLE 1
Values for selected points in Figure 2
Objective function
Anchors per contig F(P) F(P)⫹φ1 F(P)⫹φ2 F(P)⫹φ3
Average adjacency quality (%)
0.0 55⫾14 57⫾14 56⫾14 55⫾14
0.5 56⫾16 60⫾13 59⫾13 56⫾13
1.0 59⫾15 73⫾15 70⫾15 74⫾13
1.5 57⫾13 82⫾15 81⫾13 78⫾17
2.0 57⫾16 89⫾11 88⫾12 88⫾15
Average distance quality
0.0 4.37⫾1.96 4.24⫾2.65 4.43⫾2.67 4.37⫾1.94
0.5 4.28⫾2.60 3.88⫾2.21 3.91⫾2.29 4.42⫾2.50
1.0 4.13⫾2.45 2.50⫾1.72 2.61⫾1.55 2.37⫾1.37
1.5 4.23⫾2.18 1.84⫾1.51 1.90⫾1.41 2.45⫾1.53
2.0 4.34⫾2.22 1.17⫾1.16 1.25⫾1.25 1.84⫾1.80
Average adjacency and distance qualities for the Hamming-distance traveling salesman objective function F(P) by itself and augmented with the penalty functionsφ1,φ2, andφ3on simulated data with the⫾95% error bounds (i.e., confidence intervals) are shown.
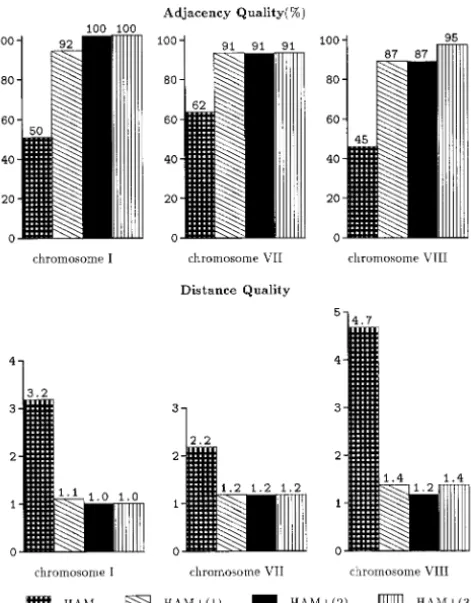
tations were used to evaluate the probe orderings gener- These plots show that combining anchored probe data from multiple independent sources using penalty func-ated from simulfunc-ated data. These are the adjacency
qual-ity (AQ) and the distance qualqual-ity (DQ;Greenbergand tionφ2can improve the accuracy of the computed order of probes.
Istrail1995). The adjacency quality is the fraction of
adjacencies in the computed ordering of probes that Evaluation of the algorithm on real data:The probe ordering algorithm in ODS2 was also evaluated in terms exist in the true ordering. The distance quality is the
average number of positions in the computed ordering of run time and map quality using real data from A. nidulans chromosomes I, VII, and VIII (Prade et al. separating two probes that are adjacent in the true
or-dering. For adjacency quality the ideal value is 100 1997). Extensive genetic maps are available for this or-ganism. Ideally, the physical maps should contain as few whereas for distance quality the ideal value is 1. In Figure
2, simulated data were ordered using the microcanoni- contigs as possible and agree with the genetic map. Due to hybridization experimental error, the contig map cal annealing algorithm and the Hamming-distance
traveling salesman objective function F(P) by itself, produced by the ordering algorithm may not agree with the genetic map. We used the following method to mea-andF(P) augmented with each of the three penalty
sure the correlation between the contig and genetic functionsφ1,φ2, andφ3. Each point in the graphs
repre-maps. By removing all nonanchored clones from a physi-sents the mean of 50 separate runs on different data
sets. These graphs show that as the average number of anchored probes per contig increases, the quality of the resulting map improves when the penalty functions are used. Mean values with 95% error bounds (i.e., confi-dence intervals) for some of the points in these graphs are shown in Table 1.
As mentioned previously, penalty functionφ2can be used when the set of anchored markers is not totally ordered. To increase the total number of anchored probes, it may be desirable to pool together markers that have been anchored to different maps. In Figure 3, we simulated the pooling together of different sets of anchored markers. The cardinality of each separate set of anchored markers is equal to 0.7 times the number of probe contigs. Figure 3 shows the impact of combin-ing one, two, and three separate sets of anchored
mark-Figure3.—Adjacency and distance quality as a function of ers on the adjacency quality and the distance quality of the number of independent sets from which the anchored the resulting probe ordering. Each bar shows the mean probe data were derived. Each bar represents the average of
caused the value ofF(P) to decrease. In the cases of chromosomes VII and VIII the incorporation of penalty functionφ3resulted in more substantial increases in the value ofF(P) (Table 2).
Benchmarks of the program ODS2 were run on a Sun Enterprise 250 computer with a 300 MHz Ultra-SparcII CPU and 512 MB main memory running the Solaris 7 operating system on data from chromosome VIII of A. nidulans using penalty function φ1. Results using a number of different values for␣ are reported in Table 3. As microcanonical annealing is a stochastic algorithm, benchmarks were run 25 times for each ␣ value. Average values over the 25 runs are reported in Table 3.
In general, run times for these data are reasonably short. It can be seen that, in general, as more weight is placed on the penalty function, both the number of contig breaks and the percentage of marker adjacencies recovered increase. When ␣ was equal to 0.01, there were, on average, 16.4 contigs and 55% of marker adja-cencies were recovered. When ␣ was equal to 100.0, there were, on average, 20.1 contigs and 100% of marker adjacencies were recovered. This indicates that the algo-rithm is creating contig breaks to align the physical map with the genetic map. The program ODS2 also supports the manual alignment of physical and genetic maps.
Figure 4.—Results from orderingA. nidulans data using This is described in the following section.
the Hamming-distance traveling salesman objective function with and without penalty functionsφ1(1),φ2(2), andφ3(3).
The bar plot represents the adjacency or distance quality of IMPLEMENTATION
genetic markers in the physical map and represents the
aver-age of five runs with␣ ⫽1.0. ODS2 is a fully graphical application implemented in
Java. It features a graphical user interface and will run on any platform that supports Java 2. It has been tested cal map, we are left with a permutation of anchored on Sun hardware running the Solaris 7 operating system probes and clones and, hence, an ordering of the mark- and on PC hardware running Microsoft Windows NT. ers. The AQ and DQ measurements were then deter- In addition to providing tools for creating maps, ODS2 mined for this ordering of markers implied by the order- also provides features for data management. The soft-ing of the probes. Also, the Hammsoft-ing-distance travelsoft-ing ware can store data in a file or in a database on the salesman objective function valueF(P) was determined same host or a remote host. Data can be added incre-for the computed ordering of probes to see if the incor- mentally to either of these repositories using the applica-poration of the penalty functions led to an increase in tion at any time during the life of a project. Data are its value. This gave an indication of the consistency entered into the repositories via five types of text files. of the probe orderings with the clone-probe incidence The first three files contain data that are required, and
data. the last two contain optional data. The first type of
TABLE 2
Change in final value of the Hamming-distance traveling salesman function ofA. nidulans data after ordering with the penalty functionsvs.without
Objective function Chromosome I Chromosome VII Chromosome VIII
HAM⫹(1) ⫹0.29% ⫹0.44% ⫹0.80%
HAM⫹(2) ⫺0.03% ⫹0.40% ⫹0.30%
HAM⫹(3) ⫹0.90% ⫹1.12% ⫹1.90%
Data were ordered with the Hamming-distance objective function alone and in combination with one of the penalty functions. The value of the Hamming-distance traveling salesman function for the data ordered using each penalty function, minus the value for data ordered without the penalties, is shown. Average values over five runs are presented with␣ ⫽1.0.
them. The precise format of each of these file types is user can elect whether or not to use any of the penalty specified in the documentation that comes with the functions described previously and can adjust the weight
software. (␣) placed on this function. When the selected map(s)
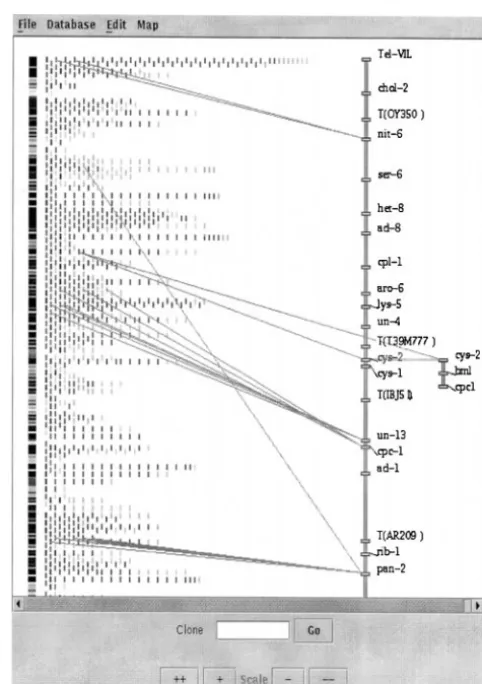
The program ODS2 can be used with either a rela- are generated, each is displayed graphically in a new tional database or a special file for managing all the window. This window contains a menu that lets users data for a given project. A typical session with the soft- edit the associated map. This editing tool is shown in ware may begin by opening an existing project. To do Figure 5, which displays a map ofN. crassalinkage group this, the user would load all data from the project file VI. On the far left side of the screen, a colored bar or database into memory. All software functions can be indicates the depth of coverage at the corresponding carried out by selecting from menus or activating other
graphical components. The user may then import new data from one or more of the text files described above. ODS2 has a menu option for configuring a database. The user specifies a database account name, password, host name, and port. The application will create the necessary tables if they do not already exist. ODS2 has been tested with Oracle 8 (http://www.oracle.com) and MySQL (http://www.mysql.com) database management systems on Sun hardware running the Solaris 7 op-erating system. The application should theoretically work with any relational database management system that is SQL92 compliant and for which there is a Java JDBC driver available.
After opening a project, the user may then select one or more chromosomes and build a map for them. The
TABLE 3
Analysis of the ODS2 algorithm with penalty functionφ1
on data fromA. nidulanschromosome VIII
Run time Recovered marker
␣ (sec) No. of contigs adjacencies (%)
0.01 11.0 16.4 55
0.1 10.4 15.7 57
1.0 12.8 18.6 92
10.0 11.6 19.6 100
100.0 13.3 20.1 100
Benchmarks were performed on a Sun E250 computer, with a 300 MHz UltraSparcII CPU and 512 MB main memory, running the Solaris 7 operating system. The data contain
1273 clones, 118 probes, and 12 anchored clones. The algo- Figure5.—Screenshot of the ODS2 graphical map viewing/ editing tool displaying part of an integrated physical and ge-rithm was run 25 times for each value of␣. Average values
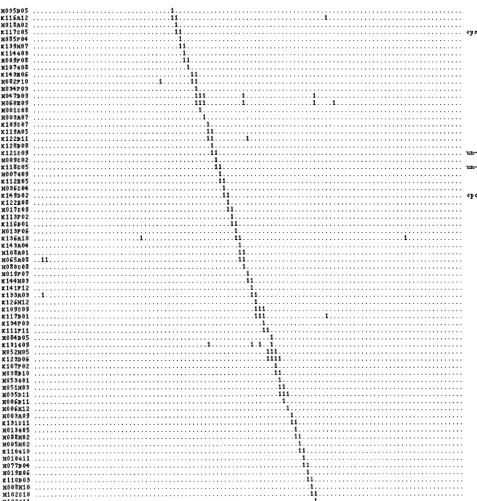
Figure6.—A minimal tiling contig map ofN. crassalinkage group VI. Clone names are in the left column. If a clone contains a marker, the name of the marker is displayed in the far right column. Hybridization data are shown as a matrix of binary values. Columns correspond to probes. A “1” indicates that a clone and probe hybridize and a “.” indicates a clone and probe do not hybridize.
position on the map. The darker the color, the greater (again, these colors are not evident in the grayscale image). The scale of the displayed maps can be adjusted the coverage at that position. Contig breaks (i.e., regions
of 0 coverage) are indicated by red bands (these do not as needed.
The genetic map is displayed to the right of the con-show up in the grayscale image of this figure). To the
right of the coverage indicator are the clone contigs. tigs. Clones anchored to genetic markers are indicated by gray lines that terminate at one end on the clones The clones are color coded as follows. Black clones
were used as probes. Blue clones can be unambiguously and at the other end on the associated markers. If the contig map is in agreement with the genetic map, then placed within the probe ordering. Gold clones cannot
Figure6.—Continued.
software orders the clones, several types of corrections versed. A block of clones can also be moved to a different location on the map. This is accomplished by selecting to the map may be necessary. It may be necessary to
reposition the contigs. Also, false contigs that are de- a set of clones by dragging the mouse over them, cutting these clones out of the map, and pasting them to a tected when clones within the same contig are anchored
to different regions of the genetic map may need to be different location. In this way entire contigs can be moved or possibly false contigs broken up and sepa-broken. An example of this situation can be seen in
Figure 5, where a contig must be broken so that the rated. The depth indicator to the left of the clones is useful for moving and reversing clone blocks. For mov-uppermost subcontig containing the marker pan-2
(bot-tom of genetic map) can be moved next to the other ing an entire contig, the user selects clones between two red bands on the indicator. For breaking a potential contig containing this marker.
re-Figure6.—Continued.
would move clones between two light-colored bands or a all ambiguously placed nonanchored clones at one time as well. The software will also generate a minimum tiling light-colored band and a red band. Light-colored bands
correspond to regions of the map where there are rela- map. It does this by removing all clones from the map except for a minimal set needed to cover the chromo-tively few observed hybridizations to link subcontigs.
Random false-positive hybridization could cause contigs some. Clones are preferentially kept in the map if they are a probe, or they can be unambiguously placed in to be falsely joined, and the junction between contigs
would likely have a corresponding light-colored band the map, or they are anchored to the genetic map. Ambiguously placed clones can be automatically moved due to a lack of additional true hybridizations.
Several other types of edits are also supported. Clones to alternative locations using a menu option.
After a map is built, it may be saved in a file on disk may be selected and deleted from the map. This option
can also be exported into a text format. Such a map is software tools are needed in this area. Our future work will focus on the integration of the maximum-likelihood-shown in Figure 6. This map is a preliminary minimum
tiling ofN. crassalinkage group VI (the data collection based physical mapping objective function (Bhandarkar
isⵑ75% complete as of date). The map in Figure 6 was et al.2001) with clone data that are anchored to genetic generated using a weight of ␣ ⫽ 10 for the genetic markers on the genetic map. This would involve aug-mapping data. The map underwent additional manual menting the maximum-likelihood objective function editing to bring it into alignment with the genetic map. with ordinal information in the form of a prior distribu-A preliminary full version of the map is available for tion derived from the anchored clones. We are also viewing on the web at http://gene.genetics.uga.edu/ investigating normalization of transcription profiling
ncrassa6.html. data through integration with views of the physical map.
This research was supported in part by an NRICGP grant from the U.S. Department of Agriculture and in part by a Microbial Genetics DISCUSSION
Grant MCB-9630910 from the National Science Foundation. Although a number of good software applications
have been developed over the years to support the
con-struction of contig maps, none of these is ideally suited LITERATURE CITED
to support the mapping protocol being taken in the
Aign, V., U. SchulteandJ. D. Hoheisel,2001 Hybridization
map-N. crassaproject. ODS (Cuticchiaet al.1993), Probe, ping ofNeurospora crassalinkage groups II and V. Genetics157: Costig, and Barr (Mottet al.1993) were designed for 1015–1020.
Alizadeh, F., R. M. Karp, D. K. WeisserandG. Zweig,1995 Physical creating maps using clone-clone hybridization data, but
mapping of chromosomes using unique probes. J. Comp. Biol. do not contain any features for integrating genetic map- 2:159–184.
ping data into the contig maps. It would be possible to Arnold, J.,andM. T. Cushion,1999 Constructing a physical map of thePneumosystisgenome. J. Eukaryot. Microbiol.44:8S. use one of the applications for creating STS marker
Bhandarkar, S. M.,andS. A. Machaka,1997 Chromosome recon-maps, such as SEGMAP (GreenandGreen1991;Mag- struction from physical maps using a cluster of workstations. J. nesset al.1994), as some of them also build contigs as Supercomput.11:61–86.
Bhandarkar, S. M., S. A. Machaka, S. S. SheteandR. N. Kota, well. However, SEGMAP was designed for creating yeast
2001 Parallel computation of a maximum likelihood estimator artificial chromosome-based maps of larger genomes. of a physical map. Genetics157:1021–1043.
For instance, one of the inputs for the program is a file Carrano, A. V., J. Lamerdin, L. K. Ashworth, B. Watkins, E. Bas-combet al., 1989 A high-resolution, fluorescence-based, semiau-containing the chromosomal banding patterns. Thus,
tomated method for DNA fingerprinting. Genomics4:129–136. SEGMAP would not be suitable for fungal
chromo-Christoff, T.,andJ. Kececioglu,1999 Computing physical maps somes. Most of the existing mapping applications are of chromosomes with nonoverlapping probes by branch and cut. Proceedings of the 3rd ACM Conference on Computational Mo-tied to a particular computer platform or database
man-lecular Biology, Lyon, France, pp. 115–123. agement software. For instance, Contig Explorer (
Nad-Christoff, T., M. Ju¨ nger, J. Kececioglu, P. MutzelandG. Reinelt,
karniet al. 1996) runs on Macintosh clients and uses 1997 A branch-and-cut approach to physical mapping of
chro-a UNIX server for dchro-atchro-a storchro-age. mosomes by unique end-probes. J. Comp. Biol.4:433–447.
Chumakov, I. M., P. Rigault, I. Le Gall, C. Bellanne-Chantelot, Although ODS2 was created for theN. crassamapping
A. Billaultet al., 1995 A YAC contig map of the human ge-project, it would be a good candidate for use in other nome. Nature377(Suppl): 175–297.
mapping projects as well. ODS2 was designed, in particu- Coulson, A., J. Sulston, S. BrennerandJ. Karn,1986 Toward a physical map of the genome of the nematodeCaenorhabditis eleg-lar, for genomes with good genetic maps. However, the
ans.Proc. Natl. Acad. Sci. USA83:7821–7825.
application has other features that could make it a viable Creutz, M.,1983 Microcanonical Monte Carlo simulation. Phys. tool even for genomes without genetic maps. First, as Rev. Lett.50:1411–1414.
Cuticchia, A. J., J. ArnoldandE. Timberlake,1992 The use of it is Java based, it runs on virtually all modern platforms.
simulated annealing in chromosome reconstruction experiments Second, it gives the users the flexibility of storing data based on binary scoring. Genetics132:591–601.
in local files or a central database. Third, it has a com- Cuticchia, A. J., J. Arnoldand W. E. Timberlake, 1993 ODS (ordering DNA sequences): a physical mapping algorithm based pletely graphical user interface. Many of the menu
oper-on simulated annealing. Comput. Appl. Biosci.9:215–219. ations, such as “cut” and “paste,” are common to other Daly, M. J., M. P. Reeve, A. Kaufman, J. OrlinandE. S. Lander, modern applications. Fourth, the clone ordering ap- 1994 CONTIGMAKER: software for physical map contig assem-bly. Cold Spring Harbor Meeting on Genome Mapping and Se-proach based on Hamming distances has been proven
quencing, Cold Spring Harbor, NY, p. 210. in other mapping projects (Pradeet al.1997;Enkerli
Enkerli, J., H. Reed, A. Briley, G. BhattandS. F. Covert,2000
et al. 2000). Fifth, full maps or minimal tiling maps Physical map of a conditionally dispensable chromosome in Nec-tria haematococcaMP VI and location of chromosome breakpoints. can be built. We are making ODS2 freely available for
Genetics155:1083–1094. noncommercial use. It can be obtained by contacting
Fu, Y., W. E. TimberlakeandJ. Arnold,1992 On the design of
the authors. genome mapping experiments using short synthetic
oligonucleo-tides. Biometrics48:337–359. In conclusion, the integration of multiple data and
Gillett, W., J. Daues, L. Hanksand R. Capra,1995 Fragment information sources is critical in genomics projects to
collapsing and splitting while assembling high-resolution restric-enhance the accuracy and reliability of the final product tion maps. J. Comp. Biol.2:185–205.
tent mapping of human chromosomes: theoretical considerations Olson, M. V., J. E. Dutchik, G. M. Graham, C. Brodeur, M. Helms
et al., 1986 Random-clone strategy for genomic restriction map-and early experiences. PCR Methods Appl.1:77–90.
Green, E. D.,andM. V. Olson,1990 Systematic screening of yeast ping in yeast. Proc. Natl. Acad. Sci. USA83:7826–7830.
Perkins, D. D.,2000 Neurospora crassa genetic maps and mapped artificial-chromosome libraries by use of the polymerase chain
reaction. Proc. Natl. Acad. Sci. USA87:1213–1217. loci. Fungal Genet. Newsl.47:40–58.
Prade, R. A., J. Griffith, K. Kochut, J. ArnoldandW. E. Tim-Greenberg, D. S.,andS. Istrail,1995 Physical mapping by STS
berlake,1997 In vitroreconstruction of theAspergillus nidulans hybridization: algorithmic strategies and the challenge of
soft-genome. Proc. Natl. Acad. Sci. USA94:14564–14569. ware evaluation. J. Comp. Biol.2:219–273.
Sasinowska, H.,andM. Sasinowski,1999 An algorithm for the
Jain, M., andE. W. Myers,1997 Algorithms for computing and
assembly of robust physical maps based on a combination of integrating physical maps using unique probes. J. Comp. Biol.4:
multi-level hybridization data and fingerprinting data. Comput. 449–466.
Chem.23:251–262.
Kececioglu, J., S. SheteandJ. Arnold,2000 Reconstructing order
Soderlund, C. A.,andI. Dunham,1995 SAM: a system for iteratively and distance in physical maps using nonoverlapping probes.
Pro-building marker maps. Comput. Appl. Biosci.6:645–655. ceedings of the 4th ACM Conference on Computational
Molecu-Soderlund, C. A.,andL. P. McGarvan,1993 GRAM V1.4: User’s lar Biology, Tokyo, Japan, pp. 183–192.
Manual.Los Alamos National Laboratory, Los Alamos, NM.
Kelkar, H. S., J. Griffith. M. E. Case, S. F. Covert, R. D. Hallet al.,
Soderlund, C. A., O. LongdenandR. Mott,1997 FPC: a system for 2001 The Neurospora crassa genome: cosmid libraries sorted by
building contigs from restriction fingerprinted clones. Comput. chromosome. Genetics157:979–990.
Appl. Biosci.13:523–535.
Lehrach, H., R. Drmanac, J. Hoheisel, Z. Larin, G. Lennon et
Stallings, R. L., D. C. Torney, C. E. Hildebrand, J. L. Longmire,
al., 1990 Hybridization fingerprinting in genome mapping and
L. L. Deavenet al., 1990 Physical mapping of human chromo-sequencing, pp. 39–82 inGenetic and Physical Mapping, Vol. 1,
somes by repetitive sequence fingerprinting. Proc. Natl. Acad. edited byK. E. DaviesandS. M. Tilghman. Cold Spring Harbor
Sci. USA87:6218–6222. Press, Plainview, NY.
Sulston, J., F. Mallett, R. Staden, R. Durbin, T. Horsnellet al.,
Magness, C., Y. XuandP. Green,1994 SEGMAP: an interactive
1988 Software for genome mapping by fingerprinting tech-computer program for generating YAC-based STS-content maps.
niques. Comput. Appl. Biosci.5:101–106. First International Workshop on Human Chromosome 7
Map-Suyama, A.,1993 ContigMaker: Software tool for contig map con-ping, Cytogenetics and Cell Genetics (1-2), Marburg, Germany,
struction, pp. 376–384 inProc. Genome Informatics Workshop IV, p. 63.
edited byT. Takagi, H. Imai, S. Miyano, S. Mitakuand M. Mayraz, G.,andS. Shamir,1999 Construction of physical maps Kanehisa. Universal Academy Press, Tokyo, Japan.
from oligonucleotide fingerprints data. Proceedings of the 3rd
Tsai, H.,andC. Kao,2000 Using genetic algorithms to construct ACM Conference on Computational Molecular Biology, Lyon, physical maps of chromosomes with unique probes, pp. 167–168 France, pp. 268–277. inCurrents in Computational Molecular Biology, edited byS. Miyano,
McPherson, J. D.,1997 Sequence ready—or not? Genome Res.7: R. Shamir and T. Takagi. Universal Academy Press, Tokyo,
1111–1113. Japan.
Mott, R., A. Grigoriev, E. Maier, J. HoheiselandH. Lehrach, Venter, J. C., H. O. SmithandL. Hood,1996 A new strategy for
1993 Algorithms and software tools for ordering clone libraries: genome sequencing. Nature381:364–366.
application to mapping of the genome of Schizosaccharomyces Wang, Y., R. A. Prade, J. Griffith, W. E. TimberlakeandJ. Arnold, pombe.Nucleic Acids Res.21:1965–1974. 1994 A fast random cost algorithm for physical mapping. Proc.
Nadkarni, P. M., A. Banks, K. Montgomery, J. Leblanc-Stracew- Natl. Acad. Sci. USA91:11094–11098. ski, P. Milleret al., 1996 CONTIG EXPLORER: interactive