ABSTRACT
SUTTON, KRISTEN RUTH. Systematic Approach for Error Proofing Transaction Processes. (Under the direction of Dr. J.A. Joines, Dr. C.T. Culbreth, and Dr. T.G. Clapp.)
The purpose of this research was to develop a model to reduce errors in transactional processes within companies. The model created utilized three error proofing concepts: the FMEA, TRIZ Solution Directions, and the Error Proofing Healthcare (EPH) model. The research involved analyzing 250 FMEA’s that were previously conducted in a large transactional corporation and obtaining feedback from associates. The model that was created consisted of three phases. Phase one identifies the potential failures that could occur within a process while phase two uses TRIZ solution directions to create multiple innovative solutions and phase three uses a method called Solution Priority Number (SPN) to rank and evaluate the solutions generated. The SPN consists of the return on investment (ROI) and the ease of implementation of each
Systematic Approach for Error Proofing
Transaction Processes
by
Kristen Ruth Sutton
A thesis submitted to the Graduate Faculty of
North Carolina State University
In partial fulfillment of the
Requirements for the Degree of
Master of Science
Textile Engineering
Raleigh, North Carolina
2009
APPROVED BY:
_____________________________ ___________________________
Jeffrey A. Joines C. Thomas Culbreth
Committee Chair Committee Co-Chair
DEDICATION
BIOGRAPHY
Kristen Sutton was the Valedictorian of her graduating class in May of 2003 from South Rowan High School. She started attending North Carolina State University in August of 2003. She graduated Cum Laude with a Bachelors of Science in Textile Engineering and a Minor in Industrial Engineering from North Carolina State University in May of 2007. When Kristen completed her Bachelors of Science in Textile
ACKNOWLEDGEMENTS
TABLE OF CONTENTS
LIST OF TABLES ...vii
LIST OF FIGURES...ix
Chapter I- Introduction ...1
Chapter II- Existing Quality Methods ...3
2.1 Quality Methods in Transactions Prior to Lean and Six Sigma ...3
2.2 LEAN...5
2.2.1 History...5
2.2.2 Key Tools for Transactions ...6
2.2.3 Key LEAN Error Proofing Tools for Transactions ...9
2.2.3.1-E-2-E Map ...10
2.2.3.2-Poka-yoke...10
2.2.3.3-Seven Types of Deadly Waste...11
2.3 Six Sigma ...12
2.3.1 History...14
2.3.2 Key Tools for Transactions ...15
2.3.3 Key Six Sigma Error Proofing Tools for Transactions...18
2.3.3.1-Brainstorming ...19
2.3.3.2-Cause & Effect Diagram & Matrix...20
2.3.3.3-Failure Mode and Effects Analysis (FMEA) ...23
2.4 Tools and Models Used for Error Proofing...24
2.4.1 FMEA...24
2.4.2 Theory of Inventive Problem Solving (TRIZ)...30
2.4.3 Error Proofing Healthcare (EPH) Model ...31
2.4.3.1-Phase 1: HFMEA ...32
2.4.3.2-Phase 2: Solution Generation ...35
2.4.3.3-Phase 3: Solution Prioritization ...37
Chapter III- Error Proofing Transaction Model (EPT) ...40
3.1 Phase 1: Transactional Failure Mode and Effects Analysis (TFMEA) ...41
3.1.1 Format of the Existing FMEA ...42
3.1.2- Generalized Sub-Process, Failure Modes, Effects, and Causes ...46
3.1.3- Removal of Detection Score ...53
3.2 Phase 2: Solution Generation/TRIZ...54
3.3 Phase 3: Solution Evaluation...57
3.3.1- ROI ...57
3.3.3 Solution Priority Number (SPN) ...62
3.3.4 Action Plan ...63
Chapter IV- Error Proofing Transaction Method (EPT) ...64
4.1 Phase I-TFMEA...64
4.1.1 Scope of the TFMEA ...64
4.1.2 Team Selection ...65
4.1.3 Process Map...65
4.1.4 Generating Failure Modes, Effects, and Causes...67
4.2 Phase II- Solution Generation ...71
4.3 Phase III- Solution Selection...72
4.3.1 Return on Investment (ROI)...72
4.3.2 Ease of Implementation...75
4.3.3 Solution Priority Number (SPN) ...76
4.3.4 Action Planning ...77
Chapter V- Case Study ...78
5.1 Assemble Team ...78
5.2 Map Process ...79
5.3 FMEA & TFMEA ...81
5.3.1 Existing FMEA...81
5.3.2 TFMEA ...82
5.3.3 Comparison of the Existing FMEA and the TFMEA ...85
5.4 Solution Generation ...86
5.4.1 Brainstorming ...87
5.4.2 TRIZ Solution Directions...87
5.4.3 Comparison of Brainstorming and TRIZ Solution Direction...88
5.5 Solution Evaluation & Selection ...89
5.5.1 Selection by Discussion ...89
5.5.2 Selection based on ROI and Ease of Implementation...89
5.5.3 Comparison of Existing Method and SPN Method ...91
5.5 Summary of Case Study...91
Chapter VI- Conclusions and Future Work ...93
6.1 Conclusions ...93
6.2 Future Work ...94
REFRENCES ...96
LIST OF TABLES
Table 2.1- C&E Matrix Relationship between X's and CTQ's ...22
Table 2.2- Cause and Effect Matrix (Gitlow & Levine, 2005)...23
Table 2.3- Severity Table (Curtis, 2002)...26
Table 2.4- Probability Table (Curtis, 2002)...27
Table 2.5- Detection Table (Curtis, 2002)...28
Table 2.6- TRIZ Methods (Terninko, 1998)...31
Table 2.7- HFMEA Severity Rating for Patient Outcomes (DeRosier et al., 2002)...33
Table 2.8- HFMEA Occurrence Rating for Patient Outcomes (DeRosier et al., 2002)....33
Table 2.9- Effectiveness Scoring (Seastrunk, 2005) ...38
Table 2.10- Cost Scoring (Seastrunk, 2005)...38
Table 2.11- Implementation Scoring (Seastrunk, 2005) ...38
Table 3.1- Simple Survey Questions...41
Table 3.2- Severity, Occurrence, and Detection ...43
Table 3.3- Generalized Sub-processes ...47
Table 3.4- Generalized Effects...48
Table 3.5- Generalized Sub-process Steps, Failure Modes, and Causes...49
Table 3.5 (Continued)...50
Table 3.5 (Continued)...51
Table 3.5 (Continued)...52
Table 3.7- Solution Directions for EPH ...55
Table 3.8- TRIZ Examples ...56
Table 3.9- TRIZ Questions ...56
Table 3.10- Visible and Hidden Costs...59
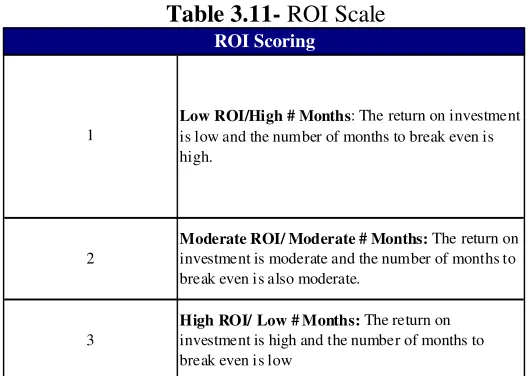
Table 3.11- ROI Scale ...61
Table 3.12- EPH Ease of Implementation Scale...61
Table 3.13- EPT Ease of Implementation Scale ...62
Table 4.1- Severity Scoring ...69
Table 4.2- Occurrence Scoring ...70
Table 4.3- ROI Scoring ...75
Table 4.4- Ease of Implementation Scoring ...76
Table 5.1- High Level Process Steps...79
Table 5.2- Generalized Failure Modes ...83
Table 5.3- Effects for "does not deliver at all" ...84
Table 5.4- Results of Existing FMEA and TFMEA...86
Table 5.5- Solutions Generated using TRIZ Solution Directions...88
Table 5.6- Next Highest Ranking Solutions ...90
LIST OF FIGURES
Figure 2.1- End to End Map for Receiving a Loan...10
Figure 2.2- Cause and Effect Diagram (Cause-and-effect diagram.1998) ...21
Figure 2.3- FMEA Worksheet (Seastrunk, 2005) ...24
Figure 2.4- Simple Process Map ...25
Figure 2.5- Hazard Scoring Matrix (DeRosier et al., 2002) ...33
Figure 2.6- Decision Tree Analysis (DeRosier et al., 2002) ...35
Figure 2.7- Error Proofing Principles (Seastrunk, 2005) ...36
Figure 2.8- Solution Generation Questions (Seastrunk, 2005) ...37
Figure 3.1- % Elimination of Failure Comment Box...60
Figure 4.1- Process Mapping Template (Seastrunk, 2005) ...66
Figure 4.2- Cost of Failure Occurring Comment ...73
Figure 4.3- % Elimination of Error Comment ...74
Figure 4.4- Cost of Implementation Comment ...74
Figure 5.1- Process Map for Loan Process...80
Figure 5.2- FMEA for First Sub-Process Step...82
Figure 5.3- Generalized Causes ...84
Chapter I- Introduction
The Merriam-Webster definition of a transaction is: “an exchange or transfer of goods, services, or funds.” A transactional corporation is a company that provides goods, services, or funds to a customer, but the focus in transactional settings is the customer. An example of a transactional type setting is a bank which provides funds for their customers. Another example of a transactional service is a restaurant which provides service and a product or food to their customers.
Transactional process differ from manufacturing. In manufacturing there is a product that is being produced from start to finish. There is equipment and machinery that can be altered to improve a process. Most of the products that are being produced are known prior to their creation. In a transactional setting the company has to respond quickly to the request of their customer. In transactional settings there are few machines that can be altered to improve a process and most of the improvements that are made are focused on eliminating human errors.
Chapter II- Existing Quality Methods
Companies use a variety of quality methods (i.e. Six Sigma, Total Quality Management, Lean, etc.) to help improve processes within their organization. Several transactional service companies now utilize Lean and Six Sigma methodologies where they previously used Total Quality Management (TQM).
2.1 Quality Methods in Transactions Prior to Lean and Six Sigma
There are many different types of errors that occur in transactional services. For example, in a bank manual data entry can lead to many errors. Therefore, controls are put in to place to keep these errors from occurring. However, it would be devastating if these errors occurred and the repercussions would be great. To help eliminate errors, many banks have started to use Six Sigma in order to improve their quality and to keep these errors from occurring.
Before the use of Six Sigma and Lean, banks used a variety of quality
the desired results, and act on what was learned to improve. This methodology allowed banks to learn from what they were doing and improve the current process. (Evans, 2005)
Each bank used different tools from TQM, Deming’s 14 Points, and Shewhart’s method. There was not a specific set of tools or a roadmap to follow for quality
improvement in banks until Six Sigma and Lean were applied. Also, banks often used their own variation of Six Sigma and the benefits have been tremendous. For example, from 2001-2004 Bank of America has saved about 2 billion dollars and has increased their customer satisfaction by 25% from the utilization of Six Sigma (Gupta, 2005). The Six Sigma methodology has allowed banks to utilize a structured roadmap to improve their process.
There has been a big difference in using Six Sigma in banks instead of just TQM. When TQM was used, a team would look at one problem in order to reduce cycle time and defects. When a specific isolated problem is the only item that is analyzed the potential savings are small and the work may not be validated (Michalski, 2003).
Six Sigma and Lean have a much broader scope since they analyze the entire process, where TQM only focused on pieces of the process. In using TQM each problem was attacked by a team of quality assurance personnel while in Six Sigma each employee in a corporation becomes a process improver (Michalski, 2003). As with many
2.2 LEAN
Companies have started using Lean tools in order to restructure their
manufacturing methods. Lean focuses on removing wasteful activities such as: waiting, transportation, material hand-offs, inventory, and over production. Lean allows
companies to operate as a whole instead of many separate units. When companies start to adopt a Lean way of thinking, which eliminates waste by reducing cycle time and
increases productivity and quality, an incredible return on investment (ROI) can be realized. An example of a company that had a great ROI was General Motor’s largest plastics supplier, Blackhawk Automotive Plastics. Before becoming GM’s largest supplier, Blackhawk adopted the idea of lean manufacturing. Blackhawk’s Lean processes led to 100% on time delivery, increased productivity by 15%, and decreased inventory levels by 25% for twelve months (Forger, 2003).
Lean has two key components: feedback of information and process speed. Lean is very focused on reducing waste not only on the manufacturing floor, but also in other parts of the company. Lean focuses on cleaning up the workspace in order to change the time it takes to complete a task. Many organizations have adopted Lean’s 5S theory in order to clean and organize each employee’s desk.
2.2.1 History
revolutionary and his initial concept of low cost is one of the key concepts of Lean. However, Lean differs from Ford's process in that his mass production lines where balanced for only one product and ultimately failed in environments where there are small lot sizes. Lean focuses on producing a variety of different products while at the same time keeping the costs low. Toyota developed the lean concepts and was the first corporation to combine low cost with high quality. Lean is a generalization of the
production system developed at Toyota which is also known as Just-In-Time (JIT). With the combination of Henry Ford and Toyota’s production systems a new an innovative process improvement methodology was created. In 1990, Jones, Womack, and Roos started the Lean terminology in their book The Machine That Changed the World: The Story of Lean Productions. And the Lean production revolution was started. In this book they discussed how an automotive industry transformed its operations from craft
production, to mass production, and finally to Lean production. (Womack et al., 1990; Womack, Jones, & Roos, 1990)
2.2.2 Key Tools for Transactions
many other lean methodologies that are being used such as Lean office, Lean product development, Lean design, Lean accounting, and Lean warehousing (Trebilcock, 2004). Many different lean techniques that are utilized by banks and other transactional service industries have utilized many different lean techniques in order to reduce errors from occurring. Below are some of the lean concepts that are used by transactional services. (Conner, 2001)
• Seven Wastes (Reduction)
o Defects, Overproduction, Transportation, Waiting, Inventory, Motion, and
Processing (too much).
o One of the most common forms of waste in transactions is waiting.
• End-2-End Maps
o Map of the entire value chain of events from start to finish of the target or
selected good or service.
o E-2-E maps are used in transactions for a visual representation of the
process and to determine who is completing each task.
• Spaghetti Charts
o Creates a picture of the physical traveling that the products/information
experience within a process.
o Used in transactions to create a picture of how information flows through
a process.
• 5S
o Used to organize any environment by applying the 5 S’s, which are sort,
storage, shine, standardize, and sustain.
o Sort- get rid of what is not needed
o Storage- arrange and identify for ease of use o Shine- clean daily; clean up what’s left
o Standardize- eliminate cause; standard methods o Sustain- set discipline, plan, schedule
o 5S is used in transactions to assure associate’s workspaces are organized
to increase efficiency. • Load Chart
o Visual display of each person’s workload in a process. o Used in transactions to help to eliminate waste in each step.
• 5 Why’s
o Asking why a failure occurred multiple times, usually five, to determine
the root cause of a problem.
o i.e.: Why did your car not start? Because the battery is dead
Why is the battery dead? Because the light was left on Why was the light left on? Because it was left on accidently etc.
o Used in transactions to determine the root cause of a problem.
o An activity that changes the size, shape, fit, form, or function of material
or information (for the first time) to meet the customer requirements. • Non-Value Added Activity
o All other activities that take time or resources or that does not satisfy the
customer requirements.
• Time Value Map
o Visual display of all of the steps in a process.
o Used in transactions to help eliminate non-value added steps in a process.
• Product Process Flow
o Used to determine the flow of a product through a process.
o Used in transactions to determine how products flow through different
processes.
• Work in Process
o Causes: Instability (of operations), unbalanced capacity, monuments,
demand variation, supply variation, and push. • Poka Yoke
o Mistake proofing
2.2.3 Key LEAN Error Proofing Tools for Transactions
proofing in transactional services are E-2-E Map, Poka-Yoke, and Seven Types of Deadly Waste.
2.2.3.1-E-2-E Map
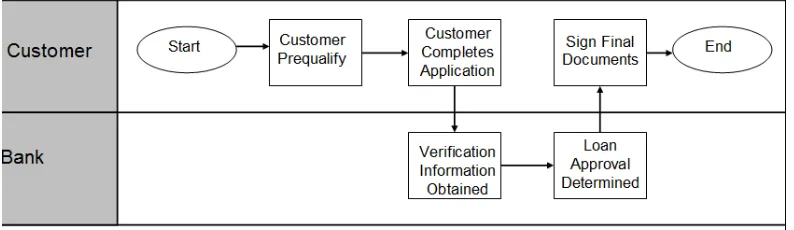
In order to truly understand a system, a map of the entire process needs to be created to identify what potential errors could occur. In creating an end-to-end map, the entire chain of events that occur in a process from start-to-end can be seen, as seen in Figure 2.1. Each step of the process in the E-2-E map can be analyzed to identify potential errors. Failures first need to be identified before deciding on how to keep the error/failure from occurring. It is essential to create an accurate end-to-end map, or process map in Six Sigma, to determine each step that is performed in a process in order to correctly identify potential failures.
1Figure 2.1- End to End Map for Receiving a Loan
2.2.3.2-Poka-yoke
manufacturing process where the operations are changed to fit the human. Nakajo and Kume have studied many different error proofing solutions and categorized them into five principles: elimination, replacement, facilitation, detection, and mitigation
(Seastrunk, 2005). These principles were then broken down in to sub-principles so that they could be used to error proof many different processes (Seastrunk, 2005). Nakajo noticed that many manufacturing plants were making the exact same errors over and over and showed that proven solutions could be used to keep these errors from occurring. Also, if the same errors are occurring in different parts of a process, then one solution or type of solution can be used to keep these errors from happening as well. (Seastrunk, 2005)
2.2.3.3-Seven Types of Deadly Waste
underutilization, and most importantly waiting. Waiting is directly tied to customer satisfaction and therefore reducing waiting increases satisfaction, which lead to overall success.
The seven types of deadly waste can be utilized when choosing a solution for a problem (error) that is occurring. In reducing the different types of waste that are present, the company will be more efficient which lead to increased customer satisfaction. Errors in a process are a form of waste. So, by reducing the errors that occur, waste will also be reduced. Identification and cause of the waste needs to occur before one can reduce/eliminate waste.
Error proofing is a critical component of lean because by reducing the amount of errors that can occur in a company ultimately reduces the waste in the system, the amount of rework, and the value add. When transactional companies utilize Lean techniques for error proofing they often see improved ROI (Return on Investment) because their
workplace will be operating more efficiently.
2.3 Six Sigma
Six Sigma has many different definitions and has been described as “an improved quality assurance program, an updated measurement/improvement process, a new
defective parts per million. Six Sigma supplies each employee with a toolbox of tools that when used correctly will cause great rewards for the individual and the company.
Many companies have implemented Six Sigma methodology. For example, some of these companies are: Caterpillar, 3M, Bank of America, Motorola, and General
Electric which are only a small subset of the companies that have seen great rewards from the utilization of Six Sigma. In one year approximately 60% of Caterpillar’s profitability came from Six Sigma improvements (Gupta, 2005). Caterpillar’s first year gains after using Six Sigma exceeded their first year deployment costs. 3M “committed to Six Sigma as a way of doing business (Gupta, 2005).” They have accredited hundreds of millions of dollars saved by utilizing Six Sigma. 3M’s CEO said the following
regarding Six Sigma, “We’re betting our performance on Six Sigma. That is saying that, if Six Sigma doesn’t succeed, the company doesn’t succeed” (Gupta, 2005). Bank of America has utilized Six Sigma for process improvements in many different projects in order to increase their customer satisfaction. From 2001-2004, Bank of America has saved approximately two billion dollars and has increased their customer satisfaction by 25% from the implementation of Six Sigma (Gupta, 2005). When Motorola utilized Six Sigma on their manufacturing floor between the years of 1987-1994, their manufacturing costs were reduced by 1.5 million dollars (Gupta, 2005). In the summer of 2004,
Many other companies had huge success from implementing Six Sigma throughout their entire corporation. (Gupta, 2005)
2.3.1 History
Motorola created the Six Sigma Process in 1987. They developed a four phase methodology that had to be completed in order to improve a process and were termed MAIC, which stood for Measure, Analyze, Improve, and Control. This first phase was Measure because the projects had already been defined and the correct people had been assigned to the projects. In later years the Define phase would be added to be completed before entering the Measure phase because correctly defining the project was noted as a key aspect to improve a process. (Eckes, 2005)
Bill Smith is given credit for the birth of Six Sigma, but Mikel Harry is given credit for packaging Six Sigma as a “vibrant quality-improvement methodology (Eckes, 2005).” Bill Smith created many of the original formulas and the statistics that are behind Six Sigma, but Mikel created many of the details around Six Sigma (Eckes, 2005). He published the book The Strategic Vision for Acceleration Six Sigma. Bill Smith and Mikel Harry together created the foundation for one of the greatest quality initiatives. (Eckes, 2005)
manufacturing floor to reduce defects. GE applied Six Sigma in all parts of their company along including their manufacturing floor, product design, transactions,
processes, etc. GE focused on using statistical and non-statistical tools in order to lead to higher quality products in less time than their competition. GE helped to make Six Sigma into what it is today by taking the methodology that Motorola created and expanding it to all aspects of a company. (Eckes, 2005)
2.3.2 Key Tools for Transactions
In transactional processes, a human is a key part of a process. A human is not a machine that can perform the same task identically each time and is prone to making errors, since there are certain factors that cause variation. Six Sigma utilizes many tools and methodologies to help reduce the probability of human error. Since a majority of the work in transactional services is performed by humans it is vital to reduce the probability of human error. Transactional services use many of the Six Sigma tools. Each
transactional service may use some of the tools in different ways as well as in different portions of the DMAIC cycle. The following list is some of the tools most commonly used by banks. (Michalski, 2003)
• Define Phase
o Project Charter
Used to identify the team members, the project goal, the timeline, the problem statement, the business case, and the project scope.
Used to determine the risks that are present in this project and ranks each of these risks.
o Stakeholder Analysis
Determines who is important to this project, how much they support the project, and how much they need to support the project. This is done to assure that support is provided when needed.
o Primary Metric and Secondary Metrics
• Measure Phase
o Cause and Effect Diagram
Determines how the measurement system, people,
process/procedures, equipment/machines, environment, and materials affect the problem.
o Cause and Effect Matrix
The customer requirements (CTQ’s) are correlated to the risk factors.
o Brainstorming
Used to generate ideas about the process and what could be improved or changed.
o Failure Mode Effects Analysis
before it occurs. This tool allows a person to determine which failures are high priorities.
o Sample Size Determination
Helps to determine the appropriate sample size.
o Data Collection Plan
• Analyze Phase
o Hypothesis Testing
Used to test to see if the means of two different data sets are equal or not equal.
• Improve/Control Phases
o Pugh Matrix o Control Plan
Used to insure that a process stays in control.
• The following tools are used in different phases of the DMAIC depending on the transaction company.
o Control Charts
Used to determine if a process is in statistical control.
o DOE
Used to determine what the best design would be.
o Pareto Charts
o Histograms
Used to see the spread of the data and to determine what type of distribution would fit the data (i.e. a Normal distribution).
o Process Maps
Maps out each step of a process.
o MSA
Used to determine if a measurement system is working correctly. The reproducibility of the workers as well as the the repeatability of the measurement system is being tested.
o Correlation
Shows the linear relationship between variables
o Regression
Shows the relationship between an independent X variable and a response (Y).
o Analysis of Variance (ANOVA)
Used to show whether or not the variation between the average of the levels is greater than what could be expected form the variation that should occur at that level.
2.3.3 Key Six Sigma Error Proofing Tools for Transactions
Brainstorming, Cause & Effect Diagram & Matrix, and Failure Modes and Effects Analysis (FMEA).
2.3.3.1-Brainstorming
Brainstorming is a tool that is widely used by many different corporations in order to identify problems, find solutions for problems, and identify opportunities for
improvement. Brainstorming was created by Alex F. Osborne in 1941 while he was searching for creative ideas and in doing so had an unstructured group process of
interactive “brain-storming” (Michalski, 2003). When there is a group of individuals in a room verbalizing their ideas there is more discussion regarding each individual’s ideas, hopefully generating more ideas. Brainstorming is like the old saying “two heads are better than one.” Brainstorming is used by many different transactional industries in a variety of ways. Brainstorming is used to identify problems that are occurring and to identify ways to solve these problems, which ultimately is error proofing the process.
Brainstorming is also used to identify opportunities for improvement.
2.3.3.2-Cause & Effect Diagram & Matrix
In a Six Sigma Project one of the first things that is done is to collect a voice of the customer (VOC) and create a list of CTQ’s (Critical to Quality Characteristics). There are many different methods to collect the voice of the customer. One of the most common ways is to survey the customer regarding the product that is being created or improved. The CTQ’s are things that are identified as being critical to the quality of the project. CTQ’s will be measured throughout the project to ensure that the project is succeeding. For example if there was a Six Sigma project being conducted on improving the printing process of airline tickets then a CTQ for that project would be printed airline ticket errors (Gitlow & Levine, 2005). There are two tools that are used for identifying the possible causes of variations of the CTQ’s in a project and the causes of these
variations: the Cause and Effect Diagram and the Cause and Effect Matrix. A Cause and Effect Diagram is used when there is only one CTQ for a project while a Cause and Effect Matrix is used when there are multiple CTQ’s for a project (Gitlow & Levine, 2005).
methods, materials, equipment, measurement, and environment. Going back to the example mentioned earlier; the categories for that CTQ of “printed airline ticket errors” would be: method (printing), material (ticket stock), personnel, and machine (Gitlow & Levine, 2005). These categories will vary depending on the project and CTQ being analyzed. Teams will then think about the CTQ and determine what are the potential causes of the errors that could occur within each category. For the example used earlier of “printed airline ticket errors” some of the causes of errors that could occur under the category Method (Printing) are: quality of the printing and the speed of the printing (Gitlow & Levine, 2005). A Cause and Effect Diagram is a tool used in the
determination of what failures could occur in a process along with the potential causes. Once the causes of a failure are identified then it is much easier to keep these failures from occurring. (Gitlow & Levine, 2005)
2Figure 2.2- Cause and Effect Diagram (Cause-and-effect diagram.1998)
A Cause and Effect Matrix is used for multiple CTQ’s to organize the possible sources of variation and the causes of the variation simultaneously. There are two sources in which the data for a Cause and Effect Matrix can be discovered: 1) a
each CTQ. The weights of each CTQ are determined in the define phase of the project by using the voice of the customer. The weights of each CTQ are defined between 0 and 1 with the sum of all the weights equal to one. The most probable causes of each of the CTQ’s are listed horizontally (see Table 2.2). The relationship between each cause (X) and each CTQ are then determined by the team using the scale below in Table 2.1.
1Table 2.1- C&E Matrix Relationship between X's and CTQ's
(Gitlow & Levine, 2005)
After each of the X’s are given relationship scores then the weighted averages are calculated for each X using the weight associated with each CTQ and the relationship score that was given between a certain CTQ and a certain factor. The X’s with the highest weighted averages are viewed as the important X’s for all of the CTQ’s. It is also important to look at any blank cells, where the relationship was zero, to
determine if that X can be eliminated. If an X does not have a relationship with some of the CTQ’s then it is important to see if that X can be eliminated to reduce the complexity of the model. The Cause and Effect Matrix is a good tool to determine the important X’s for all of the CTQ’s in a project. If the causes of failures can be determined then it is easier to keep these errors from occurring in a process. (Gitlow & Levine, 2005)
Score
Definition
9
Strong Relationship (Positive or Negative)
3
Moderate Relationship (Positive or Negative)
1
Weak Relationship (Positive or Negative)
2Table 2.2- Cause and Effect Matrix (Gitlow & Levine, 2005)
2.3.3.3-Failure Mode and Effects Analysis (FMEA)
In many industries, companies would wait for a failure to occur and then they would take the necessary actions to keep that failure from occurring again. Other corporations would try to anticipate a failure, but there was not a tool for this purpose. Until the FMEA tool was developed, there was no structured way for corporations to determine failures before they occur. A FMEA can be described as a tool that intends to: identify a potential failure and the effects of that failure, recognize actions that can be taken to eliminate that failure, and document all of this information.
2.4 Tools and Models Used for Error Proofing
There were three main concepts that were used to develop the error proofing model for transactions. The three main error proofing concepts that were utilized were: FMEA, TRIZ Solution Directions, and the Error Proofing Healthcare (EPH) Model. Parts of each of these three error proofing concepts will be used to create the Error Proofing Transaction (EPT) model.
2.4.1 FMEA
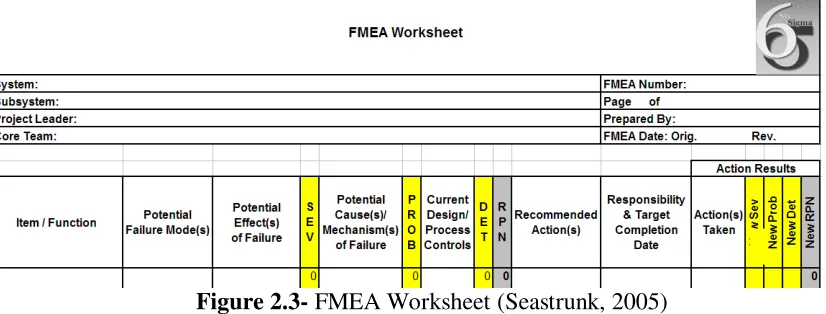
The FMEA is a tool that is best completed by a group and not an individual. Each team member needs to be familiar with the process that is being analyzed. An example of an FMEA worksheet that can be referred to as the FMEA process is pictured below in Figure 2.3.
3Figure 2.3- FMEA Worksheet(Seastrunk, 2005)
4Figure 2.4- Simple Process Map
Each of the events that occurs, like “Prequalify”, are called high level process steps. There are many different levels of depth that an organization can go into with a process map. Sub-process steps can be created for each high level process step. It is important to have the right amount of detail so that all of the potential failures in that process step can be identified.
After creating a process map, each of the process steps is listed in the
failure mode in the column that is labeled “Potential Effect(s) of Failure.” After listing the potential failures and effects for the first process step the severity of each failure is determined where the worst severity score is a ten. Table 2.3, defines each of the severity scores. The severity score will be placed beside the corresponding failure in the “SEV” column in the FMEA worksheet.
3Table 2.3- Severity Table (Curtis, 2002)
Hazardous without warning
Very high severity ranking when a potential failure mode effects safe
system operation without warning 10
Hazardous with warning
Very high severity ranking when a potential failure mode affects safe
system operation without warning 9
Very High System inoperable with destructive
failure without compromising safety 8
High System inoperable with equipment
damage 7
Moderate System inoperable with minor damage 6
Low System inoperable without damage 5
Very Low System operable with significant
degradation of performance 4
Minor System operable with some degradation
of performance 3
Very Minor System operable with minimal
interference 2
None No effect 1
placed in the FMEA worksheet, the next step is for the team to score how likely it is for each failure to occur. In Table 2.4 the definitions for each score is given. The worst probability score is a probability score of 10. There is also a failure probability which shows a ratio of how many defective parts would constitute a certain score. The
probability score will be placed beside the corresponding failure in the “PROB” column of the FMEA worksheet.
4Table 2.4- Probability Table(Curtis, 2002)
>1 in 2 10
Very High: Failure is almost inevitable
1 in 3 9
1 in 8 8
High: Repeated
failures 1 in 20 7
1 in 80 6
1 in 400 5
Moderate: Occasional failures
1 in 2,000 4
1 in 15,000 3
Low: Relatively few
failures 1 in 150,000 2
Remote: Failure is
unlikely <1 in 1,500,000 1
score is a score that rates how likely it is that a certain failure will be detected before it occurs where the worst detection score is ten. All of the Definitions for each of the scores are given in Table 2.5. The detection score will be placed beside the
corresponding failure in the “DET” column of the FMEA worksheet.
5Table 2.5- Detection Table(Curtis, 2002)
Absolute Uncertainty
Design control cannot detect potential cause/mechanism and subsequent failure
mode
10
Very Remote
very remote change the design control will detect potential cause/mechanism and
subsequent failure mode
9
Remote: Failure is unlikely
Remote chance the design control will detect potential cause/mechanism and subsequent
failure mode
8
Very Low
Very low chance the design control will detect potential cause/mechanism and subsequent
failure mode
7
Low
Low chance the design control will detect potential cause/mechanism and subsequent
failure mode
6
Moderate
Moderate chance the design control will detect potential cause/mechanism and subsequent
failure mode
5
Moderately High
Moderately High change the design control will detect potential cause/mechanism and
subsequent failure mode
4
High
High chance the design control will detect potential cause/mechanism and subsequent
failure mode
3
Very High
Very high chance the design control will detect potential cause/mechanism and subsequent
failure mode
2
Almost Certain
Design control will detect potential cause/mechanism and subsequent failure
mode
After each failure is given a detection score, the team calculates the Risk Priority Number (RPN) by multiplying the Severity Score x Probability Score x Detection Score. So, the worst RPN number that a failure could have is: 10x10x10=1,000. The RPN is calculated for each of the failures and is listed beside the corresponding scores in the “RPN” column in the FMEA worksheet. The team will then determine the potential failure modes, effects, severity score, causes, occurrence score, controls, and detection score for the remaining process step using the same procedure.
After the RPN is calculated for all of the potential failure modes for each process step, the high risk failure modes will be determined based on the RPN. Usually the company will have a set cut off value for the RPN. For example a company or team could determine that all RPN’s greater than 150 are deemed high risk potential failures. After all of the high risk failures are determined then the recommended actions that need to be taken to mitigate this failure are listed. These actions are listed beside the
Each of the high risk failures will be listed and actions that were taken to mitigate that particular failure. These actions will be listed beside the corresponding failure in the “Action(s) Taken” column in the FMEA Worksheet. After listing the actions taken the new probability and new detection scores will be determined while taking into account the actions that were taken. The same tables and definitions as before will be used to determine the correct score. The new scores will be placed beside the corresponding actions in the “New PROB” and “New DET” columns in the FMEA worksheet. After re-scoring each of these failures then a new RPN will be calculated. This RPN is calculated the same way as before, by multiplying the Severity by the Probability and then by the Detection. The new RPN’s will be placed beside the corresponding scores in the “New RPN” column in the FMEA worksheet. In comparing the old RPN score and the new RPN score a team can determine whether or not the recommended actions did help to mitigate the high risk failures.
2.4.2 Theory of Inventive Problem Solving (TRIZ)
parameters (Terninko, 1998).” After conducting this research Althshuller realized that creativity can be taught. The goal of all of this research that Altshuller and his students conducted was to help direct the mind outside of the normal realm of thinking (Fey, 1997). Altshuller’s major solution generation techniques can be seen below in Table 2.6.
6Table 2.6- TRIZ Methods (Terninko, 1998)
The 40 Inventive Principles that Altshuller created can help to generate proven solutions. The principles will help to direct the mind a known direction and allow for more solutions to be generated. The 40 Inventive Principles will help to generate innovative solutions.
2.4.3 Error Proofing Healthcare (EPH) Model
proofing principles, and evaluating and selecting the best solution (Seastrunk, 2005). This approach utilizes the Healthcare Failure Mode Effects Analysis (HFMEA) in the first step but greatly expands upon it and leads to more effective and successful solutions in the end. In addition, this method was created to stimulate and guide a team’s thinking when analyzing error-prone processes. There are three main phases of the EPH:
HFMEA, solution generation, and solution prioritization (Seastrunk, 2005).
2.4.3.1-Phase 1: HFMEA
A traditional HFMEA is performed during the first phase. A detailed process map highlighting potential failure modes with the aid of predefined generalized sub-processes and failure modes is completed first. The list of generalized sub-processes and failure modes can be seen in Figures 1 and 2 in Appendix I respectively and have been developed from research in healthcare and are specific to the industry.
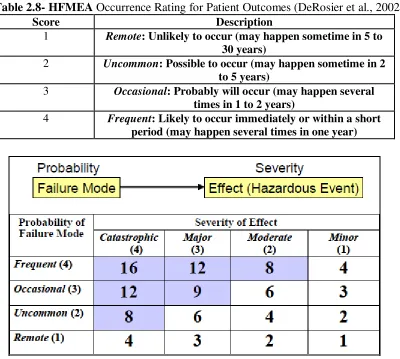
The identified failure modes are then evaluated on a scale from one to four on their occurrence and severity. Table 2.7 depicts an example of the patient outcome table for severity and in Table 2.8 the occurrence rating is shown. The hazard score is
7Table 2.7- HFMEA Severity Rating for Patient Outcomes (DeRosier et al., 2002)
Score Description
1 Minor patient outcome: No injury, nor increased length of stay, nor increased level of care
2 Moderate patient outcome: Increased length of stay or increased level of care for 1 to 2 patients
3 Major patient outcome: Permanent lessening of bodily functioning, disfigurement, surgical intervention required, increased length of stay for 3 or more days, increase level of care for 3 or more patients
4 Catastrophic patient outcome: death or major permanent loss of function, suicide, rape, hemolytic transfusion reaction,
surgery/procedure on the wrong patient or wrong part of body, infant abduction or discharge to wrong family
8Table 2.8- HFMEA Occurrence Rating for Patient Outcomes(DeRosier et al., 2002)
Score Description
1 Remote: Unlikely to occur (may happen sometime in 5 to 30 years)
2 Uncommon: Possible to occur (may happen sometime in 2 to 5 years)
3 Occasional: Probably will occur (may happen several times in 1 to 2 years)
4 Frequent: Likely to occur immediately or within a short period (may happen several times in one year)
6Figure 2.6- Decision Tree Analysis(DeRosier et al., 2002) 2.4.3.2-Phase 2: Solution Generation
The second phase after the identification of potential errors is to generate solutions from error proofing principles and proven solution directions. The five error proofing principles (Elimination, Replacement, Facilitation, Detection, and Mitigation) were identified by researchers after looking at more than 1000 solutions and categorizing them into these five major groups. Figure 2.7 overviews these five error proofing
7Figure 2.7- Error Proofing Principles (Seastrunk, 2005)
8Figure 2.8- Solution Generation Questions (Seastrunk, 2005) 2.4.3.3-Phase 3: Solution Prioritization
things that are important to the healthcare industry when choosing a solution. These things are “how much will it cost, how difficult will it be to implement, and how effective will it be” (Seastrunk, 2005). The effectiveness, cost, and implementation are evaluated on a scale from one to three and multiplied together to form the solution priority number (SPN), where high scores represent a solution which is effective, cheap, and easy to implement. The scoring for each of these parameters can be seen in Tables 2.9, 2.10, and 2.11.
9Table 2.9- Effectiveness Scoring (Seastrunk, 2005)
Score Definition
3 Very Effective: Probability can be eliminated and reduced to 1, or
Control Measure or Detectability can be changed to “Yes.”
2 Effective: Probability can be reduced; however, Hazard score is still more than 8, and Control Measure and Detectability remain to be “No.”
1 Ineffective: Probability can not be reduced, and Control Measure and
Detectability remain to be “No.”
10Table 2.10- Cost Scoring (Seastrunk, 2005)
Score Definition
3 Low: Within daily operation budget. No specific budget is needed.
2 Moderate: Unit level budget is needed.
1 High: Hospital level budget is needed.
11Table 2.11- Implementation Scoring (Seastrunk, 2005)
Score Definition
3 Easy: No training is needed. No resistance is expected.
2 Moderate: Training course is needed.
Some resistance is expected.
1 Difficult: Culture change is needed.
Strong resistance is expected.
Chapter III- Error Proofing Transaction Model (EPT)
The FMEA which is current tool used to prevent errors from occurring in
transactions is not sufficient for identifying all potential errors and requires lots of time. The FMEA does not contain a sufficient way to generate and select the best solutions. A new tool is needed for transactions that will identify more potential errors, generate effective solutions, and contain a set way to choose the best solution. A new model for transactions was developed using the Error Proofing Healthcare Model (EPH) as the starting point to develop the Error Proofing Transactions (EPT) model.
A team of six individuals in a large banking organization worked on modifying the EPH model to fit transactional services. The team was comprised of vice presidents, managers, and associates. Each member of the team was very familiar with the FMEA, which was the current error proofing process being employed and became familiar with the EPH model.
3.1 Phase 1: Transactional Failure Mode and Effects Analysis (TFMEA)
The current state of developing FMEAs in transactional processes within companies was analyzed. Multiple FMEA sessions were observed and the many issues were noted. A simple survey seen in Table 3.1 was given to many different associates asking what issues were encountered with the current FMEA process. The team members obtained greater detail when administering the survey in person which maximized responses received. Many issues were identified with the current FMEA when used in transactional services. These issues along with the HFMEA model and 250 completed FMEAs in a large banking company were analyzed to assist in developing the new TFMEA. Changes inthe format of the FMEA were the generation of the generalized sub-process steps, the failure modes, the causes, as well as the removal of the detection score.
12Table 3.1- Simple Survey Questions
Questions Number of Indivudals
Surveyed Yes No
Think about the process step identified, are all of the potenti al failure modes identified?
25 25 0
Think about the process step identified,
are all of the potenti al effects i dentified? 25 25 0
Think about the process step identified,
are all of the potenti al causes identified? 25 25 0
Are the sub process steps, failure modes,
3.1.1 Format of the Existing FMEA
The format of FMEA will be utilized in the TFMEA for identifying failures, because the FMEA is widely used and associates are familiar with the FMEA process. The FMEA that was being utilized had previously been modified to fit this corporation by changing the following.
1) The rating scale for severity, occurrence, and detection 2) The terminology that was used.
The rating scale for the FMEA was changed to be on a scale of one to five for severity, occurrence, and detection. The scale was changed to minimize discrepancy on ratings between team members. Any risk priority number (RPN) that scored above a “cut-off” number of 27 was a failure mode for action. The FMEA terminology was modified to focus on the customer rather than the typical manufacturing floor. The
13Table 3.2- Severity, Occurrence, and Detection
Severity Score Severity Definition
5 Customer will be Lost
4 Very likely that the Customer will be dissatisfied and their business will be lost
3 Customer will be affected and their business could potentially be lost
2 Customer is not likely to notice or be affected
1 No effect
Occurrence Score Occurrence Definition
5 Failure Almost Always Occurs 4 Failure Occurs Repeatedly 3 Failure Occurs Occasionally 2 Failure Occurs Only a Few Times 1 Failure is Unlikely to Occur
Detection Score Detection Definition
5 Little to No Chance of Detection 4 Very Low Chance of Detection 3 Moderate Chance of Detection 2 High Chance of Detection 1 Almost Certain Detection
One of the issues noted while observing the traditional FMEA sessions was that each team would conduct the FMEA in a different manner. Some teams would list all of the potential failure modes first and then list all of the effects. Other teams would list the potential failure modes for one process step and then list the effects. In order to assure that each team was conducting the TFMEA in the same manner a more structured approach was created by generating a list of steps. These steps are listed below and are embedded in the electronic spreadsheet describing the TFMEA.
1) Start with the tab labeled “1.)TFMEA”
3) Determine all of the failures that could occur for the current process step, use the generalized failure modes that can be found in the worksheet titled “Generalized Functions & Failure.” Note: These failure modes are just to assist you in thinking of all of the potential failure modes.
4) Determine all of the effects of failures for the current process step, use the generalized effects that can be found in the worksheet titled "Generalized
Functions & Failure." Note: These effects are just to assist you in thinking of all of the potential effects.
5) Determine the severity of the failures for the current process step occurring. Use the rating scale that is located in the embedded comment in that cell. Note: To see the comment place your mouse over the red triangle in the top right corner. 6) Determine all of the causes of each failure for the current process step by using
the generalized causes that can be found in the worksheet titled "Generalized Functions & Failure." Note: These causes are just to assist you in thinking of all of the potential causes.
7) Determine the occurrence of the failures for the current process step occurring. Use the rating scale that is located in the embedded comment in that cell. Note: To see the comment place your mouse over the red triangle in the top right corner. 8) The RPN will be automatically be calculated.
9) Repeat Steps 3-8 for each sub-process.
11) Copy all of these high risk failure modes and paste them into the worksheet title "2.) Solutions and Scoring"
12) For each of the high risk failures, the team needs to think about potential solutions. In order to help with brainstorming potential solutions please look at the worksheet labeled "TRIZ" and consider each of the solution directions listed and ask the team the questions that are listed for each solution direction.
13) After each of the solutions are listed you need to determine the cost of the failure occurring. To assist with the cost determination, use the section of that worksheet titled "Costs to Consider When Determining the Cost of an Failure Occurring." Which should help to account for all costs. Note: This cost is an annual cost. 14) Determine the percent of the time that the solution will keep the error from
occurring. Use the rating scale that is located in the embedded comment in that cell. Note: To see the comment place your mouse over the red triangle in the top right corner.
15) Determine the cost of implementation. Again the section below titled "Costs to Consider When Determining the Cost of an Failure Occurring" can be used to account for all of the costs.
16) The return on investment (ROI) will automatically be populated.
17) The number of months to breakeven will automatically populate as well. 18) Determine the ROI score. Use the rating scale that is located in the embedded
19) Determine the ease of implementation score. Again, the rating scale that is located in the embedded comment in that cell. Note: To see the comment place your mouse over the red triangle in the top right corner.
20) The SPN will automatically update where the best solutions are the solutions with the highest score.
21) The solutions that are chosen for implementation should have an individual assigned to oversee implementation and a target date of when the implementation should be completed.
3.1.2- Generalized Sub-Process, Failure Modes, Effects, and Causes
When conducting a TFMEA high level process steps must be identified where three to five steps is typical. After these high level process steps are generated then the sub-process steps, failure modes, effects, and causes can be determined. Two of the issues that were identified in the existing FMEAs were the following.
1) The amount of time required to generate sub-process steps, failure modes, effects, and causes.
2) The problem of overlooking or missing important failure modes.
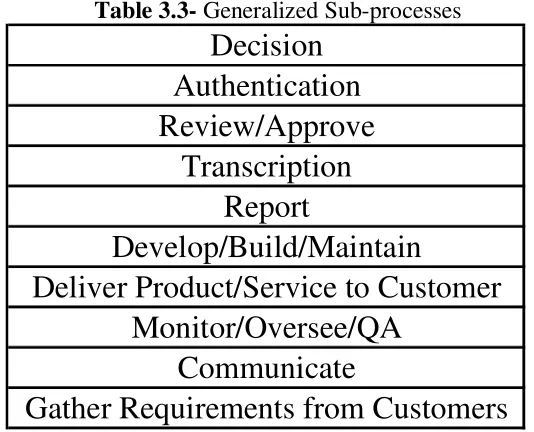
effects, and causes. There were a total of ten high level sub-processes that were determined for transactional services as seen in Table 3.3.
14Table 3.3- Generalized Sub-processes
Decision
Authentication
Review/Approve
Transcription
Report
Develop/Build/Maintain
Deliver Product/Service to Customer
Monitor/Oversee/QA
Communicate
Gather Requirements from Customers
Each of the original sub-process steps, in the 250 FMEA’s, were replaced with the corresponding generalized sub-processes. These high level sub-process steps were reviewed with multiple associates to obtain their feedback. The associates felt that the list of generalized sub-process steps was representative and are now being used.
Each of the original failure modes were replaced with the corresponding generalized failure mode. Like the sub-processes, the generalized failure modes were verified by multiple associates to obtain their feedback. The associates felt that the list of generalized failure modes was representative. These generalized failure modes will assist in determining all of the potential failure modes that could occur within a sub-process step and decrease the amount of time required for this step.
Next, the effects from the 250 FMEA’s were analyzed and categorized to create ten generalized effects, seen in Table 3.4. Unlike the failure modes, these effects could relate to any failure mode within any sub-process step.
15Table 3.4- Generalized Effects
Loss of Sale
Loss of Existing Customer
Rework
Negative Customer Experience
Refulatory Violations
Reputation Damage
Incur Extra Expense
Can't Measure Success
Unable to Execute Business Strategy
Uncompensated Risk Exposure
All of the causes from the 250 FMEA’s under each of the generalized failure modes were grouped together to create high level causes. A list of generalized causes was created for each potential failure mode. The generalized causes can be seen below in Table 3.5. Each of the original causes was replaced with the corresponding generalized cause and duplicates were removed.
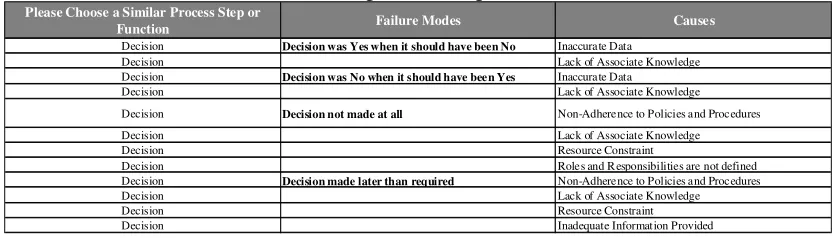
The generalized sub-processes, failures modes, effects, and causes were assembled in a Excel worksheet that can be utilized when conducting the TFMEA to facilitate efficiency. The failure modes are grouped by generalized sub-process steps and the causes are grouped by generalized failure modes while the effects, since they relate to all failure modes, are listed separately in the worksheet. The worksheet was designed so that when a generalized sub-process step is selected only the generalized failure modes for that sub-process step will appear. When a generalized failure mode is selected only the causes for that failure mode will appear. A small part of the worksheet can be seen below in Table 3.5 and the generalized effects can be seen below in Table 3.6. The entire worksheet can be seen in Appendix I in Figure 4.
16Table 3.5- Generalized Sub-process Steps, Failure Modes, and Causes
Please Choose a Similar Process Step or
Function Failure Modes Causes
Decision Decision was Yes when it should have been No Inaccurate Data
Decision Lack of Associate Knowledge
Decision Decision was No when it should have been Yes Inaccurate Data
Decision Lack of Associate Knowledge
Decision Decision not made at all Non-Adherence to Policies and Procedures
Decision Lack of Associate Knowledge
Decision Resource Constraint
Decision Roles and R esponsibilities are not defined
Decision Decision made later than required Non-Adherence to Policies and Procedures
Decision Lack of Associate Knowledge
Decision Resource Constraint
17Table 3.5 (Continued)
Authentication Fail to authenticate Lack of Associate Knowledge
Authentication Non-Adherence to Policies and Procedures
Authentication Communication Gap
Authentication Roles and Responsibilities are not clearly defined
Authentication Insufficient Information
Authentication Authenticate someone who should not have access Lack of Associate Knowledge
Authentication Non-Adherence to Policies and Procedures
Authentication Fail to authenticate someone who should have access Insufficient Policies and Procedures Authentication Take too long to authenticate System Limitations
Authentication Lack of Associate Knowledge
Authentication Insufficient/Unavailable Data
Review/Approve Review not performed Lack of Associate Knowledge
Review/Approve Non-Adherence to Policies and Procedures
Review/Approve Resource Constraint
Review/Approve Approval beyond your authority to approve Inadequate Policies and Procedures
Review/Approve Lack of Associate Knowledge
Review/Approve Non-Adherence to Policies and Procedures
Review/Approve Approval when correct decision would have been
rejection Lack of Associate Knowledge
Review/Approve Mis-Interpret data
Review/Approve Inaccurate Data provided
Review/Approve Inadequate Policies and Procedures
Review/Approve Rejection when correct decision would have been
approval Non-Adherence to Policies and Procedures
Review/Approve Lack of Associate Knowledge
Review/Approve Inaccurate/Insufficient Data provided
Review/Approve Takes too long to review Inadequate Polices and Procedures
Review/Approve Resource/Workload Constraint
Review/Approve System Limitations
Review/Approve Non-Adherence to Policies and Procedures
Review/Approve Review not thoroughly executed Lack of Associate Knowledge
Review/Approve Non-Adherence to Policies and Procedures
Review/Approve Inadequate/Insufficient Data provided
Review/Approve Review completed and not documented appropriatelyNon-Adherence to Policies and Procedures
Review/Approve Lack of Associate Knowledge
Review/Approve System Limitations
Transcription Transcribed inaccurately Lack of Associate Knowledge
Transcription Non-Adherence to Policies and Procedures
Transcription Resource/Workload Constraints
Transcription Data not entered
Transcription Data Inaccurately Recorded
Transcription Non-Data Recorded
Transcription Not transcribed in a timely manner Lack of Associate Knowledge
Transcription Non-Adherence to Policies and Procedures
Transcription System Limitations
Transcription Inadequate/Undefined Timeline
Transcription Resource/Workload Constraints
Report Reported data is not timely
Lack of Associate Knowledge; Non-Adherence to Policies and Procedures; Inadequate/Undefined Timeline; Isurfficient/Unavaliable data; Lack of Service Level Agreement
Report Non-Adherence to Policies and Procedures
Report Inadequate/Undefined Timeline
Report Insufficient/Unavailable Data
Report Lack of Service Level Agreement
Report Reported data is not relevant to the operation in
question Technology Limitations
Report Lack of Associate Knowledge
Report Reported data is relevant to operation in question but
not valid Technology Limitations
Report Lack of Associate Knowledge
Report Insufficient/Unavailable Data
Report Reported data is relevant and valid, but is not
"enough" data to make decision Limited Population
Report Technology Limitations
Report Insufficient/Unavailable Data
Report Report is not produced Non-Adherence to Policies and Procedures
Report Lack of Associate Knowledge
Report System Limitations
Report Non-Adherence to Policies and Procedures
Report Lack of Service Level Agreement
18Table 3.5 (Continued)
Develop/Build/Maintain Built solution does not work Lack of Associate Knowledge
Develop/Build/Maintain Technology Limitations
Develop/Build/Maintain Financial Constraints
Develop/Build/Maintain Inadequate Testing Conducted
Develop/Build/Maintain Incorrectly Designed
Develop/Build/Maintain Built solution does not conform to requirements Inadequate Testing conducted
Develop/Build/Maintain Incorrectly Designed
Develop/Build/Maintain Technology Limitations
Develop/Build/Maintain Lack of Associate Knowledge
Develop/Build/Maintain Lack of Quality Assurance Process
Develop/Build/Maintain Built solution does not deliver required customer
value Incorrectly Designed
Develop/Build/Maintain Technology Limitations
Develop/Build/Maintain Financial Constraints
Develop/Build/Maintain Lack of Associate Knowledge
Develop/Build/Maintain Lack of Voice of the Customer
Develop/Build/Maintain Inadequate/Undefined Timeline
Develop/Build/Maintain Built solution not delivered in a timely fashion Non-Adherence to Policies and Procedures
Develop/Build/Maintain Technology Limitations
Develop/Build/Maintain Financial Constraints
Develop/Build/Maintain Lack of Associate Knowledge
Develop/Build/Maintain Inadequate/Undefined Timeline
Develop/Build/Maintain Resource Constraint
Develop/Build/Maintain Lack of Service Level Agreement
Deliver Product/Service to Customer Do not deliver at all Non-Adherence to Policies and Procedures Deliver Product/Service to Customer Lack of Associate Knowledge Deliver Product/Service to Customer Unavailable Product/Service
Deliver Product/Service to Customer Do not deliver in a timely fashion per disclosures Non-Adherence to Policies and Procedures Deliver Product/Service to Customer Lack of Associate Knowledge Deliver Product/Service to Customer System Limitations Deliver Product/Service to Customer Workload/Resource Constraints Deliver Product/Service to Customer Unavailable Product/Service Deliver Product/Service to Customer Inadequate/Undefined Timeline Deliver Product/Service to Customer Resource/Workload Constraints Deliver Product/Service to Customer Do not deliver product/service customer was
expecting Non-Adherence to Policies and Procedures
Deliver Product/Service to Customer Lack of Quality Assurance Process Deliver Product/Service to Customer Do not deliver in a timely fashion per customer
expectations Lack of Associate Knowledge
Deliver Product/Service to Customer Clear Expectations not set Deliver Product/Service to Customer Inadequate/Undefined Timeline Deliver Product/Service to Customer System Limitations Deliver Product/Service to Customer Unavailable Product/Service Deliver Product/Service to Customer Resource/Workload Constraints Deliver Product/Service to Customer Do not deliver product/service as we promised it Non-Adherence to Policies and Procedures Deliver Product/Service to Customer System Limitations
Deliver Product/Service to Customer Lack of Associate Knowledge
Monitor/Oversee/QA Monitor the wrong elements Lack of Associate Knowledge; Non-Adherence to
Policies and Procedures;
Monitor/Oversee/QA Non-Adherence to Policies and Procedures
Monitor/Oversee/QA Method for monitoring does not present an accurate
reflection of performance Lack of Governance
Monitor/Oversee/QA Lack of Associate Knowledge
Monitor/Oversee/QA Inaccurate Sampling Performed
Monitor/Oversee/QA Monitor too infrequently to provide feedback Inaccurate/Unavailable Statistical Sample
Monitor/Oversee/QA Lack of Associate knowledge
19Table 3.5 (Continued)
Communicate Communicate incorrect information Lack of Associate Knowledge
Communicate Non-Adherence to Policies and Procedures
Communicate Lack of Customer Knowledge
Communicate Communicate incomplete information Lack of Associate Knowledge
Communicate Non-Adherence to Policies and Procedures
Communicate Lack of Customer Knowledge
Communicate Communicate too much information Lack of Associate Knowledge; Non-Adherence to
Policies and Procedures; Lack of Customer Knowledge
Communicate Non-Adherence to Policies and Procedures
Communicate Lack of Customer Knowledge
Communicate Take too long to deliver communication Non-Adherence to Policies and Procedures
Communicate Lack of Service Level Agreements
Communicate Resource Constraints
Communicate Communication is unclear Lack of Associate Knowledge
Communicate Lack of Customer Knowledge
Communicate Take too long to produce communication System Limitations
Communicate Lack of Associate Knowledge
Communicate Lack of Standardized Processes
Communicate Non-Adherence to Policies and Procedures
Communicate Resource Constraints
Gather requirements from Customers Talking to the wrong customers Voice of the Customer was access accurately Gather requirements from Customers Lack of Associate Knowledge
Gather requirements from Customers Lack of Customer Knowledge Gather requirements from Customers Mis-interpret customer needs Inappropriate Sample Size Gather requirements from Customers Lack of Associate Knowledge
Gather requirements from Customers Communication gap
Gather requirements from Customers Not talking to enough customers Lack of Associate Knowledge; Inappropriate Sample
Size;
Gather requirements from Customers Takes too long to gather requirements Inadequate Policies and Procedures Gather requirements from Customers Lack of Service Level Agreements Gather requirements from Customers Lack of Associate Knowledge Gather requirements from Customers Requirements not gathered Lack of Associate Knowledge
Gather requirements from Customers Lack of Governance
20Table 3.6- Generalized Effects for all Failure Modes
Standardized Effects for all Failure Modes
Loss of sale
Loss of existing customer Rework
Negative customer experience
Regulatory violations
Reputation damage Incur extra expense