Reduction of Manufacturing Cycle Time
using Line Balancing – A Case Study
Ashwinkumar Arivoli
1, Vignesh Ravichandran
21
Bachelor of Engineering, Dept. of Mechanical Engineering, PSG College of Technology, Coimbatore, India
2Bachelor of Engineering, Dept. of Mechanical Engineering, PSG College of Technology, Coimbatore. India
ABSTRACT:This paper deals with the reduction in manufacturing cycle time of a product using line balancing algorithm. The case study was undertaken in an industry that manufactures air-oil separators for compressors. Current state value stream map was drawn to identify the problem areas. The scope of study was limited to the bottle neck stations. The bottle neck stations are dedicated to the production of the chosen product and there is no mix of products in these stations. Time study was performed to ascertain the adherence of the current process to the takt time. Various tools such as fish bone diagram and Pareto chart were used in the analysis to identify major reasons for non-adherence to takt time. The line was balanced using COMSOAL algorithm to eliminate the involvement of worker and to meet the takt time. The cycle time in the bottle neck stationwas reduced by 5% and the involvement of a worker was eliminated.
KEYWORDS:Line balancing, value stream mapping, cycle time reduction, COMSOAL, Pareto analysis.
I. INTRODUCTION
The case study discussed in this paper was conducted in a facility that manufactures air-oil separators for compressors. The facility manufactures about 60 varieties of compressors and air-oil separators. Hence there are high variations in a similar product. The facility has 14 workstations. The product variety chosen for study is a high volume air-oil separator with a monthly demand of more than 2000 nos. The facility is not able to meet the monthly demand due to high production lead time. The objective of the study was to reduce the cycle the cycle time of the product by 10%. As the product mix is high, the workstations also handle different products. The stations 4&5 are dedicated for the product chosen for study. The stations 4&5 were also identified to be the bottle neck stations, as the processing time in these two stations exceeded the processing time at the other stations. Hence the scope of our study was limited to the bottle neck stations.
II. LITERATURE REVIEW
The main objective of line balancing is to distribute the task evenly over the work station so that idle time of man of machine can be minimized. Lime balancing aims at grouping the facilities or workers in an efficient pattern in order to obtain an optimum or most efficient balance of the capacities and flows of the production or assembly processes [1]. Today’s highly competitive market influences the manufacturing industry to improve their production systems to become the optimal system in the shortest cycle time as possible The most common purposes of Computer Method for Sequencing Operations for Assembly Line (COMSOAL) are to minimize idle time, optimize production line efficiency, and minimize the number of workstations [2]. As a solution method, COMSOAL quickly generates multiple feasible solutions and uses the best solution as its random picking as its final reported result. Sequences that exceed the best solution are discarded. Better sequences become the upper bounds [3].
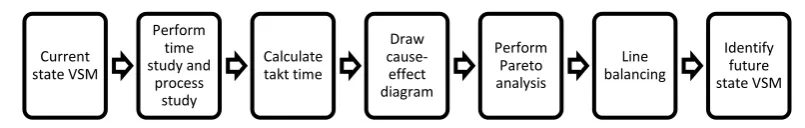
III.METHODOLOGY
Figure 1. Methodology to reduce cycle time.
IV.CURRENT STATE VALUE STREAM MAP
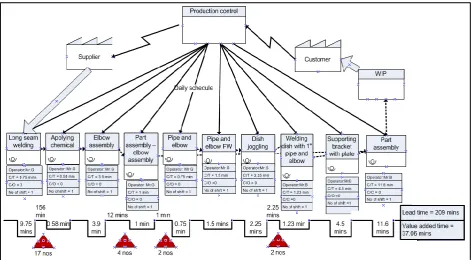
Figure 2 shows the current state value stream map for the assembly process at the bottleneck stations of the product. The edge bevelled and rolled product is brought for processing in the bottle neck stations. The rolling process is outsourced in this case. The processing undertaken includes long seam welding, chemical coating, part assembly, dish joggling and sub-assembly. With the help of current state value stream map, the process ratio was determined as 5.34%. The process ratio is defined as the ratio of value added time to the lead time. All the times considered here are with respect to the bottleneck stations. Inventory maintained between the workstations is 20 nos. The tanks are processed in batches of 20 by 3 operators.
Figure 2. Current state Value Stream Map at bottle neck stations.
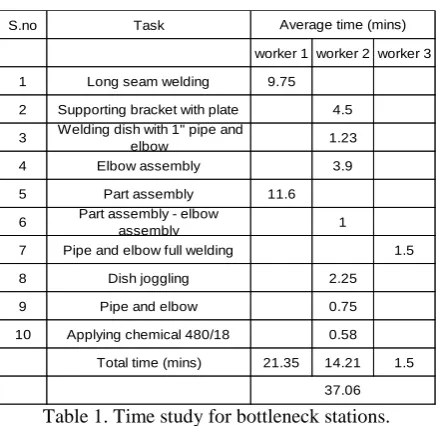
V. TIME STUDY AND WORK STUDY
Time study was done for the assembly of air-oil separator tank in bottleneck stations. Firstly, each macro processes were identified and each process was timed separately. The macro processes were observed keenly and divided into number of elemental task. The elemental tasks are listed in table 1. Time was recorded against these elemental task and 10 samples were taken for each of the macro processes. This study helps us to analyze various works with respect to time. Table 1 shows the various time studies for the workstations. From the table, it is evident that only after 21.35 minutes, a product will flow out of the bottle neck station.
Current state VSM
Perform time study and
process study
Calculate takt time
Draw cause-effect diagram
Perform Pareto analysis
Line balancing
S.no Task
worker 1 worker 2 worker 3
1 Long seam welding 9.75
2 Supporting bracket with plate 4.5
3 Welding dish with 1" pipe and
elbow 1.23
4 Elbow assembly 3.9
5 Part assembly 11.6
6 Part assembly - elbow
assembly 1
7 Pipe and elbow full welding 1.5
8 Dish joggling 2.25
9 Pipe and elbow 0.75
10 Applying chemical 480/18 0.58
Total time (mins) 21.35 14.21 1.5
Average time (mins)
37.06
Table 1. Time study for bottleneck stations.
The manufacturing process flow of air-oil separator tank is listed below. The sheets are edge bevelled before rolling. The rolling process is outsourced. The rolled shells are welded and assembled with sub components. The tanks are then full welded and subsequently sent to cleaning and hydro testing. The tested tanks are shot blast, painted, inspectedand sent to the finished goods section.
Figure 3 shows the process flow in the bottleneck stations. The processes such as long seam welding, sub assembly, part assembly, chemical coating are done in these stations. This figure also establishes the precedence requirements of each of the activities.
VI.TAKT TIME
To achieve a customer driven value stream it is important to design the production or manufacturing system to be consistent with the pace at which the customer is demanding a part or product. This pace is often referred to as the “takt time”, which is originally a German word for cadence or pace. Takt time is defined as the ratio of available time per day to the customer demand per day. It quantifies the time that is required for the production of a unit product to meet the customer demand [4].
Takt time =
Available production timeCustomer demand
(1)
Using equation (1), the takt time was found to be 20.82 minutes per unit.
VII. CAUSE AND EFFECT DIAGRAM
Figure 4 shows the cause and effect diagram, constructed after conducting a brainstorming session with core members of team and senior engineer with production department. The major factors considered were process, people, equipment, environment and material. The following were identified as possible causes:
VIII. PARETO ANALYSIS
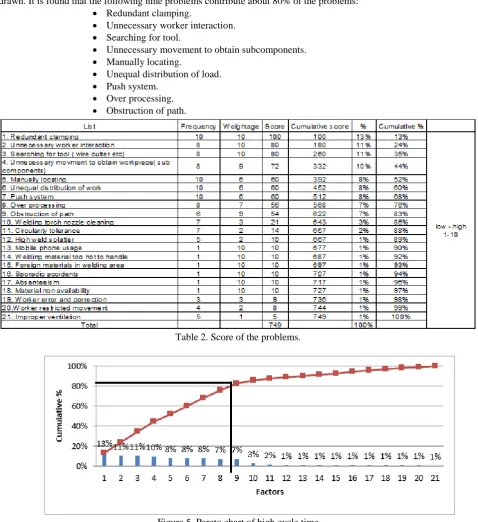
The problems identified were scored in two categories, the frequency of occurrence and how big it will impact the cycle time (weightage). Table 2 shows how the problems were scored. The scores were awarded from 1-10 (low-high). The net score is the product of the two scores. Cumulative scores and percentage were calculated and Pareto chart is drawn. It is found that the following nine problems contribute about 80% of the problems:
Redundant clamping.
Unnecessary worker interaction. Searching for tool.
Unnecessary movement to obtain subcomponents. Manually locating.
Unequal distribution of load. Push system.
Over processing. Obstruction of path.
Table 2. Score of the problems.
Figure 5 shows the Pareto chart constructed in order to determine the factors contributing to 80% of the problem. From the figure, it can be observed that almost 9 factors contribute to approximately 80% of the problem of high cycle time. The first nine factors as shown in the table 2, from redundant clamping till obstruction of path have been considered for the study.
IX.LINE BALANCING
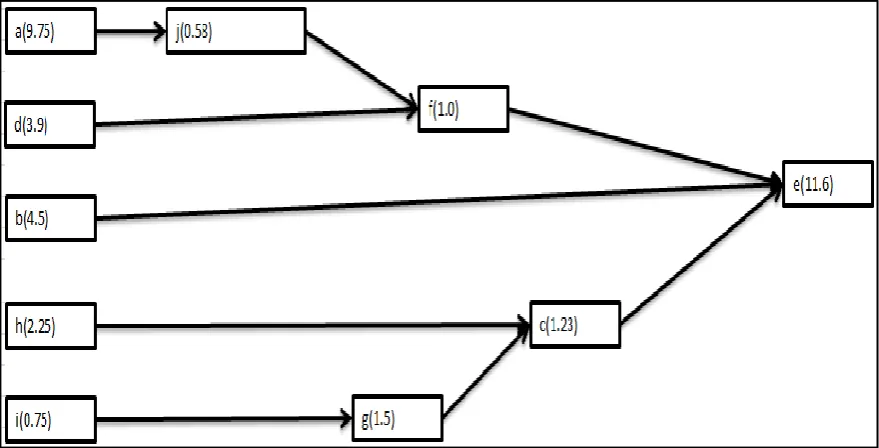
Table 3 shows the elemental task table in which the elemental tasks are mentioned along with the time and precedence requirements in order to perform line balancing. The assembly process is denoted with the alphabets from a to j.
Assy Task Time(min) Immediate predecessor
a long seam welding 9.75
---b supporting bracket with plate 4.5
---c welding dish with 1" pipe and elbow 1.23 g,h
d elbow assembly 3.9
---e part assembly 11.6 b,c,f,j
f part assembly - elbow assembly 1 a,d
g pipe and elbow full welding 1.5 i
h dish joggling 2.25
---i pipe and elbow 0.75
---j applying chemical 480/18 0.58 a
Table 3. Elemental task table of air oil separator.
The precedence diagram method (PDM) is a tool for scheduling activities in a project plan. Figure 6 shows the precedence diagram for the assembly process. It is a method of constructing a project schedule network diagram that uses boxes, referred to as nodes, to represent activities and connects them with arrows that show the dependencies. It is also called the activity-on-node (AON) method.Precedence diagram is drawn from the information provided in the elemental task table given above:
A) BEFORE LINE BALANCING IMPLEMENTATION
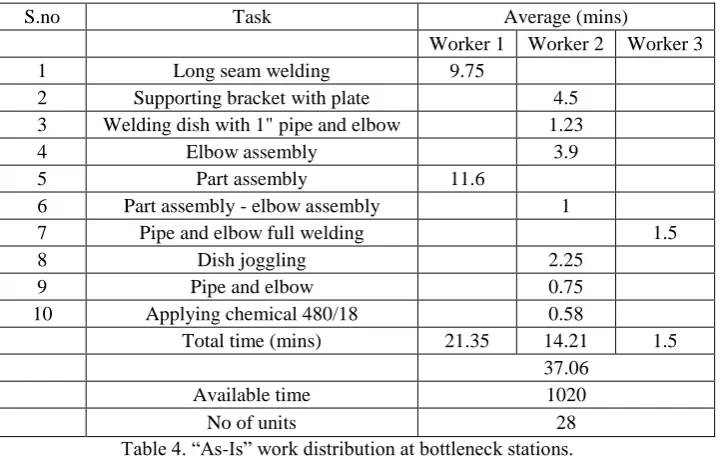
In the current scenario the workload has been distributed without any scientific basis. Table 4 shows the current distribution of work. Unequal distribution of work not only hampers the productivity but it also brings about over processing among other wastes. Therefore the current work distribution was studied and chart was drawn.
S.no Task Average (mins)
Worker 1 Worker 2 Worker 3
1 Long seam welding 9.75
2 Supporting bracket with plate 4.5
3 Welding dish with 1" pipe and elbow 1.23
4 Elbow assembly 3.9
5 Part assembly 11.6
6 Part assembly - elbow assembly 1
7 Pipe and elbow full welding 1.5
8 Dish joggling 2.25
9 Pipe and elbow 0.75
10 Applying chemical 480/18 0.58
Total time (mins) 21.35 14.21 1.5
37.06
Available time 1020
No of units 28
Table 4. “As-Is” work distribution at bottleneck stations.
From figure 7, it can be seen that the assembly line is not balanced and that the work has been unevenly distributed. Worker three apparently contributes very less towards the activities in the bottle neck stations.
Figure 7. “As-Is” Line balance graph of bottleneck stations. 0 5 10 15 20 25
Worker 1 Worker 2 Worker 3
Ti m e in m in u te s
B) COMSOAL METHOD
The COMSOAL line balancing algorithm was employed in balancing the assembly line at the bottle neck station. The table 5 shows the various calculations involved in determining the time at the various workstations involved. It also shows how the number of work stations have been arrived.
Table 5. COMSOAL Method.
C) AFTER LINE BALANCING IMPLEMENTATION
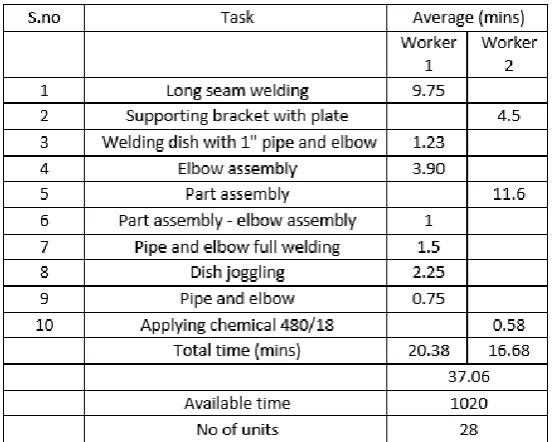
In the proposed scenario, distribution of work has been reassigned, because of this we have reduced the overall idle time at workstations 1 and 2 significantly. Table 6 shows the redistributed tasks in the bottleneck stations, in a scientific way. Moreover the cycle time at workstation 1 has been reduced below the takt time and we have reduced the total number of workers involved from 3 to 2.
From figure 8, it is clear that the takt time is now being met and the time required for assembly is less than the takt time. The involvement of a worker has been eliminated and the tasks have been redistributed. It shows the “To-Be” distribution of work.
Figure8. “To-Be” Distribution of work.
X. FUTURE STATE MAP FOR THE ASSEMBLY PROCESS IN BOTTLENECK STATIONS OF AIR-OIL SEPARATOR TANK
Figure 9. Future state VSM for the air-oil separator assembly at bottleneck stations.
Figure 9 shows the future state value stream map that was drawn after line balancing and implementing pull production. The process ratio was determined to be 10.5%. The process ratio has been improved after levelling the
0 5 10 15 20 25
Worker 1 Worker 2
Ti
m
e
in
m
in
u
te
s
workload against the takt time. In process inventory has also been reduced by setting up supermarket inventory. Inventory is replenished only after the level falls below a certain value.
XI.CONCLUSION
Thus, the bottleneck stations have been balanced to meet the takt time. The involvement of a worker has been eliminated. Prior to line balancing, a product flows out of the bottleneck stations after every 21.35 minutes, as maximum (21.35, 14.51, 1.5) is 21.35. After line balancing, the time taken for a product to flow out of the bottleneck station is 20.38 minutes. Hence the process ratio has been improved from 5.34% to 10%, which is 87% increase in existing process ratio. The cycle time at the bottleneck station has been reduced by 1 minute which is a reduction of about 5%. Hence various tools such as the fishbone diagram, Pareto chart, Value Stream Mapping and line balancing were used in the reduction of cycle time to meet the takt time at the bottleneck station.
REFERENCES
1) Naveen Kumar J and DalgobindMahto, 2013, “Assembly Line Balancing: A Review of Developments and Trends in Approach to Industrial Application,” Global Journal of Researches in Engineering Industrial Engineering, Volume 13 Issue 2 Version 1.0.
2) Lerttira, P. K.D.V. Yarlagadda, 2012, "Assembly Line Balancing the Comparison of COMSOAL and MSNSH Technique in Motorcycle Manufacturing Company", Advanced Materials Research, Vols. 605-607, pp. 166-174.
3) Li-yun XU, Loi c BELEC, Wei LIU, Qi-fang GU, Ai-ping LI, 2014, “Improved Computer Methods for Sequencing Operations for U- shaped Assembly Lines,” Proceedings of 21st International Conference on Industrial Engineering, pp.51-55.