REGRESSION BASED IMPLEMENTATION OF CREEP MODEL IN
SYS-TEM THERMAL-HYDRAULICS CODE
P. Majumdar1, Harsh Ghildiyal1, P. K. Sahoo2, B. Chatterjee1, H. G. Lele1, K. K. Vaze1
1Reactor Safety Division, Bhabha Atomic Research Centre, Mumbai, INDIA-400085
2Indian Institute of Technology, Roorkee
E-mail of corresponding author: [email protected]
ABSTRACT
In Pressurized Heavy Water Reactor (PHWR), channel creep deformation at high temperature and pressure has significant influence on the accident progression. This paper describes a methodology of developing regression based correlations for simulating the sagging creep deflection of a full scale Pressure Tube using experimental creep strain rate equations. These correlations can be efficiently used in system thermal-hydraulics codes for simulating the Pressure Tube deformation and predicting Pressure Tube (PT) and Calandria Tube (CT) contact. Regression surfaces for PT are generated from 3D finite element creep analysis of a full scale PHWR channel. Time integration of this regression surface provide PT deflection during any transient.
INTRODUCTION
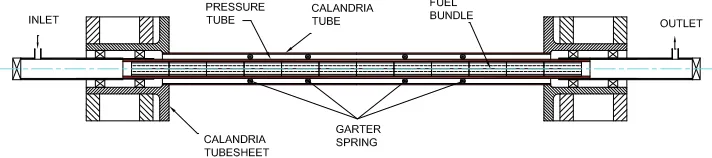
Thermal-hydraulics safety analysis codes are used in Nuclear Power Plant to model the reactor system and to analyse the process parameters during normal and abnormal transient conditions. Such codes are exhaustive in addressing the two-phase thermal-hydraulics and heat transfer in the piping components of the reactor system during accidents. PHWR core comprises number of horizontal channels submerged in relatively cold moderator. Each channel has two concentric tubes namely – Pressure Tube (PT) and Calandria Tube (CT) as shown in Fig. 1. Gap between the PT and CT is maintained through Garter Springs at four axial locations. PT houses the fuel bundles and the high pressure coolant in the Primary Heat Transport system. During loss of coolant accident along with loss of Emergency Core Cooling system, core heat dissipation would largely depend on the PT deformation. With ballooning of the PT, gap heat resistance between PT and CT reduces and after PT – CT contact, either due to sagging or ballooning, heat rapidly dissipates to the moderator through the contact area. Modelling the effect of PT creep deformation in safety analysis code would necessitate detail 3D structural analysis of the core channel and solving of creep deformation in couple with the thermal-hydraulics calculation. Such attempt would invariable load the thermal-hydraulics calculations in terms of execution and resource requirement when large number of channels are to be simulated. In this paper a method is described to generate algebraic correlations for simulating the PT creep deformation which can be easily implemented in thermal-hydraulics code for predicting the PT – CT contact.
Figure 1: PHWR Channel
METHODOLOGY IN BRIEF
deflection derivatives as a function of PT temperature and heating rates. Time integration of this equation provide PT deflection at the specific location.
FINITE ELEMENT MODELLING AND ANALYSIS
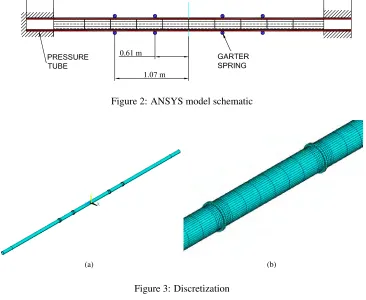
Channel Geometric Detail A typical reactor channel is shown in Fig. 1. PT holds 12 horizontal fuel bundles; how-ever, only 10 fuel bundles lie on the unsupported span of the PT. At one end, the PT is allowed to expand axially only by certain amount. The gap between PT and CT is maintained through four garter springs located at dis-tance of 61 cm and 107 cm on each side of the centre of the channel. The garter springs are tight fit on the PT and consist of a closed coiled helical spring made of Zr-Nb(2.5%)–Cu(0.5%) alloy. The CT is around 5.4 m long and each end is rolled joint to the Calandria tubesheet. The Calandria Tube is submerged into a pool of water whose temperature is maintained around 55oC. Some geometric details are given in Table 1.
Table 1: Geometric Details
1. Length of the PT 6 m
2. Length of the CT 5.4 m
3. I.D/O.D of PT 83.03/90.25 mm
4. I.D/O.D of CT 108.14/110.84 mm
5. Diameter of garter spring 6.8 mm
6. Weight of each fuel bundle 16.59 kg
Longitudinal Strain Rate Equation For simulating the sagging creep deformation of PT, strain rate equation devel-oped by Shewfelt et al. [1] for Zr-2.5wt% Nb material is used.
˙
εsg,i=8×10¹⁰σb,iexp(−26670/Ti)(K2−
εsg,i σb,i
) (1)
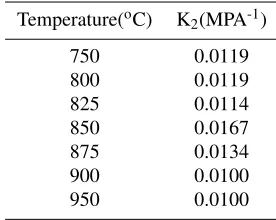
where, ‘σb’ is the bending stress in ‘MPa’ and ‘T’ is the temperature in Kelvin. The values of ‘K2’ are given in
Table 2. ‘K2’ is assumed zero for the temperature below 750oC as strain is very small. This equation is valid
upto 950oC.
Table 2: Values of ‘K2’
Temperature(oC) K2(MPA-1)
750 0.0119
800 0.0119
825 0.0114
850 0.0167
875 0.0134
900 0.0100
950 0.0100
Figure 2: ANSYS model schematic
X
Y Z
(a) (b)
Figure 3: Discretization
Boundary and Initial Conditions Following enumerates the structural and thermal-hydraulics conditions imposed on the model.
1. It was assumed that the Garter Springs were in the contact with CT due to irradiation creep of PT and therefore maximum possible PT deflection was restricted to 6.8 mm.
2. One end of the pressure tube was fixed and the other end was allowed to expand along the z-axis (Fig. 4).
3. Initial temperature of the PT was assumed 750oC and during the transient temperature of the PT was increased monotonically based on assumed heating rate.
4. Displacement boundary conditions of UY = 0 and UX = 0 were imposed on the Garter Springs as shown in Fig. 4. Garter Springs were allowed movement in z-direction along with the PT.
5. Fuel Bundle load on PT was simulated through pressure (2.48479x10⁴N/m2) on the element faces as
shown in Fig. 5.
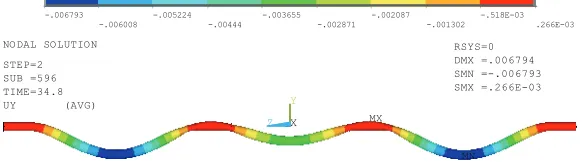
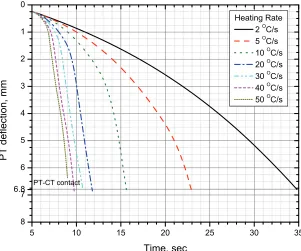
Analysis and Discussion With initial PT temperature of 750oC, transient was initiated by imposing the time v/s temperature table on each elements of the model. The solution was terminated once the maximum PT deflection reached 6.8 mm or the PT temperature reached 950 oC. Deflection data were generated for different heating rates of 2, 5, 10, 20, 30, 40 and 50oC/s. Fig. 6 shows the initial stress distribution of the PT under fuel bundle weight. PT is subjected to both tensile and compressive bending stress, however, strain due to creep is modelled to occur in the elements subject to tensile stress only. As the rate of temperature rise is constant, maximum strain would occur at the maximum stress location. PT deformation at the end of transient for the heating rate 2oC/s is shown in Fig. 7. PT – CT contact has occurred at location 1.84 m towards left from the centre. PT deflections, at contact location, for different heating rates are shown in Fig. 8. Table 3 lists the heating rates and the corresponding time taken for PT – CT contact. For the heating rate 50oC/s, PT temperature reaches
950oC/s before the contact has occurred. It is observed that contact time is not significantly effected by the heat
UX = UY = UZ = 0
(a) (b)
Figure 4: Structural constraints
Figure 5: Fuel bundle loading on Pressure Tube
X
Y
Z -.101E+08
-.866E+07 -.721E+07 -.576E+07 -.430E+07 -.285E+07 -.140E+07 54439 .151E+07 .296E+07
PATH= ND1 VALUE= L1 SCAL=10
Figure 6: Pressure Tube bottom surface stress distribution
MN MX
X
Y
Z -.006793
-.006008 -.005224 -.00444 -.003655 -.002871 -.002087 -.001302 -.518E-03 .266E-03
NODAL SOLUTION STEP=2 SUB =596 TIME=34.8 UY (AVG)
RSYS=0 DMX =.006794 SMN =-.006793 SMX =.266E-03
5 10 15 20 25 30 35 8
7 6.8 6 5 4 3 2 1 0
PT deflection, mm
Time, sec
Heating Rate 2 OC/s 5 O
C/s 10 OC/s 20 O
C/s 30 O
C/s 40 O
C/s 50 O
C/s
PT-CT contact
Figure 8: Pressure Tube deflection for different heating rates
Table 3: PT – CT contact time and temperature
Sr. Heating Rate Time duration Temperature
No. (oC/s) (sec) (K)
1. 2 29.5 1082.6
2. 5 18.0 1112.8
3. 10 10.6 1129.4
4. 20 6.8 1158.9
5. 30 5.7 1186.4
6. 40 4.8 1213.4
7. 50 – –
REGRESSION ANALYSIS
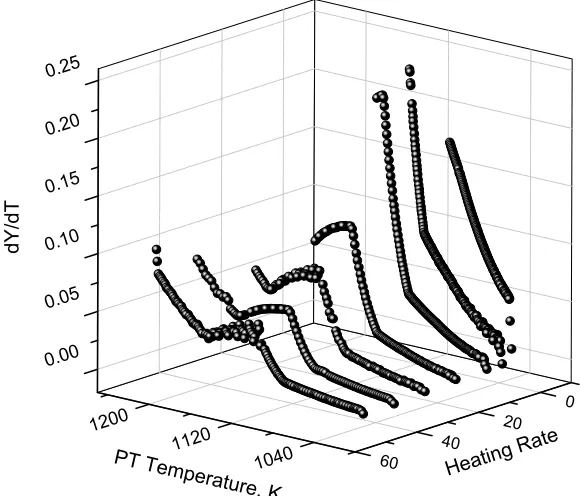
Deflection curves and its derivatives with respect to PT temperature are shown in Fig. 9. The 3D plot (Fig. 10) shows that a single surface can not be fitted to all the generated data. Three range of temperatures were identified for the regression fitting – (a) 1023 K to 1123 K (R1), (b) 1123 K to 1173 K (R2) and (c) 1173 K to 1223 K (R3). The Range R1 is further grouped into two different Heating Rates (R1H1: 2 to 10oC/s and R1H2: 10 to 50oC/s) for
smoother fitting of the surfaces. In the regression fitting, a functional form and its parameters are approximated to a set of data, so that new points in the data set can be predicted using the function rather than interpolation between points. In the present case, multivariate polynomial regression is carried out which basically minimizes the distance of a vector of dependent data points to a polynomial surface of degree ‘n’. In the present case, there are two independent variables namely – PT temperature and heating rate and one dependent variable (dY/dT). Order of the surfaces used in the analysis are different for each group. In total, four surfaces were fitted to 454 data points. A sample coefficient matrix is given in Table 4 for the group R2 and the corresponding regression surface is shown in Fig. 11. The correlations obtained through the regression analysis can be generalized as below
-derivative, dY
dT(x,y) =
nc
∑
i=0
where,
‘x’ and ‘y’ are temperature (K) and heating rate (oC/s) respectively, ‘nc’ total number of monomial terms,
‘Ci’ Coefficient vector of each monomial term,
‘I’ matrix of two columns, first column gives the power of the ‘x’ term of each monomial and second column gives power of ‘y’ term,
‘T’ Pressure Tube temperature.
DEFLECTION EQUATION
Total deflection of the Pressure Tube is calculated as below –
Z t2
t=t1 dY dt=
Z t2
t=t1
dY dT dT dt (3)
where, ‘dY/dT’ is obtained from Eq. 2.
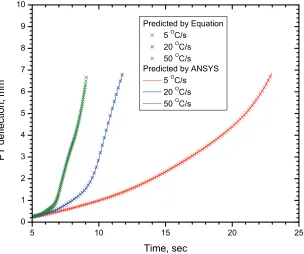
For verification, the PT defection calculated from above equation is plotted against the ANSYS results, shown in Fig. 12.
CONCLUSION
The correlations obtained through the analysis take into account the three dimensionality effect of the PT de-formation, however, the utility of such correlations are limited to specific conditions only. Execution of such equations are very fast and can be easily implemented in existing thermal-hydraulics code.
1020 1040 1060 1080 1100 1120 1140 1160 1180 1200 1220 1240 0 1 2 3 4 5 6 7 8
PT deflection, mm
Temperature, K
Heating Rate 2 O
C/s 5 O
C/s 10 OC/s
20 O
C/s 30 OC/s
40 O
C/s 50 OC/s
(a)
1000 1050 1100 1150 1200 1250
0.00 0.02 0.04 0.06 0.08 0.10 0.12 0.14 0.16 0.18 0.20 0.22 0.24 0.26 Derivative (dY/dT)
PT Temperature, K
Heating rate 2 OC/s
5 O
C/s 10 OC/s
20 O
C/s 30 OC/s
40 O
C/s 50 O
C/s
(b)
0 20 40 60 1040
1120 1200
0.00 0.05 0.10 0.15 0.20 0.25
d
Y
/d
T
PT Temperature, K Heating
Rate
Figure 10: Deflection derivative as a function heat rates and temperature
Table 4: Coefficient matrix for group R2
i I Ci
Ii,0 Ii,1
1 1 3 5.0558231x10⁻⁹
2 0 4 2.518949x10⁻⁷
3 0 3 -4.088474x10⁻⁵
4 0 2 -0.009075
5 1 2 2.003133x10⁻⁵
6 2 2 -9.185119x10⁻⁹
7 0 1 10.096912
8 1 1 -0.025532
9 2 1 2.133390x10⁻⁵
10 3 1 -5.912842x10⁻⁹
11 0 0 22719.186551
12 1 0 -79.373574
13 2 0 0.103958
14 3 0 -6.049380x10⁻⁵
15 4 0 1.319578x10⁻⁸
5 10 15 20 25 0
1 2 3 4 5 6 7 8 9 10
PT deflection, mm
Time, sec
Predicted by Equation 5 O
C/s 20 O
C/s 50 O
C/s Predicted by ANSYS
5 O C/s 20 O
C/s 50 O
C/s
Figure 12: Comparison of ANSYS prediction with the calculated values from the fitted equations
REFERENCES