Vol. 4, Issue 3, March 2015
Process Flow Improvement through 5S,
Kaizen and Visualization
Mayank Dev Singh
1, Swati Singh
2, Abhishek Chokshi
3, Harshad Chavan
4, Dhrudipsinh Dabhi
5Assistant Professor, Department of Mechanical Engineering, SIE College, Vadodara, Gujarat, India1, 2 U.G. Student, Department of Mechanical Engineering, SIE College, Vadodara, Gujarat, India3,4,5
ABSTRACT: Nowadays, manufacturing industries throughout the world are interested in lean manufacturing
philosophy. This project is based on lean manufacturing tools like 5S, Kaizen and Visualization. 5S is tool to ensuring systematic organizational environment, Kaizen is continuous improvement through small steps to obtain economical result of the organization and Visualization is technique of creating images, diagrams or animations of firm‟s activity which are helpful and effective way of communication for all people connected with firm. This project is intended to utilize these tools and come up with integrated approach. Also to reduce abnormality in organization by applying ergonomics for various working positions of employees which improve the productivity, by applying it at pipe manufacturing industry “Sandvik Asia Pvt. Ltd, Mehsana, Gujarat”. Owner of firm is also interested to implement this concept; hence as an industrial perspective this project will give us knowledge that how the practical implementations of lean concepts takes place.
KEYWORDS: 5S, Kaizen, Visualization, Abnormality, Ergonomic.
I. INTRODUCTION
Nowadays, manufacturing industries throughout the world are interested in Profit Maximization with maintaining quality to stay in competitive market. At the present time of a highly competitive market, to improve productivity with best quality and to improve market share at least cost, it is necessary to develop, improve and sustain systematic and healthy organizational place. At present scenario the industry Sandvik Asia Pvt. Ltd. is facing various types of problem due to unadapted standards and techniques. There is large scope to implement lean tools to work on these problems. This project is based on application of lean manufacturing tools like 5S, Kaizen and Visualization. The company, Sandvik Asia Pvt. Ltd., is interested to apply these tools at their place. This project also aims to reduce abnormality in organization by applying ergonomics for various working positions of employees. As an industrial perspective, this project intimates practical implementation of lean concepts
.
Objective of the project research
To improve efficiency of the Plant by using various industrial engineering techniques. To apply tools of lean manufacturing (5S, Kaizen, Visualization).
To apply ergonomics for various working positions of employees. To reduce abnormality in organization.
II. LITERATURE REVIEW
Vol. 4, Issue 3, March 2015
measure of success of TPM implementation. The losses associated with equipment effectiveness are identified. All the pillars of TPM are implemented in a phased manner eliminating the losses and thus improving the utilization of CNC machines.
Rahani et al. (2012) worked on “Production Flow Analysis through Value Stream Mapping: A Lean Manufacturing Process Case Study”. According to them the paper begins by providing a brief synopsis on the principles applied in this study followed by the background information on the work conducted in the project. In general view, Lean Manufacturing (LM) is an arrangement of techniques and activities for running a production industries or service operation. They concluded that Lean Production (LP) principles were adapted for the process sector of an automotive part manufacturing plant. Value Stream Mapping (VSM) is one of the key lean tools used to identify the opportunities for various lean techniques. An Implementation Plan then outline details of the steps needed to support the LP objectives. This paper demonstrates the VSM techniques and discusses the application in an LP initiative on a product (Front disc, D45T) case study.
Farris et al. (2008) worked on “Critical success factors for human resource outcomes in Kaizen events: An empirical study”. According to them this research contributes to the current body of knowledge by increasing the understanding of what factors most contribute to sustaining the human resource outcome work area attitude and commitment to Kaizen events. The present work represents the second phase of a multi-year Kaizen event research initiative and builds upon the first phase which identified critical success factors of initial Kaizen event outcomes, assessed immediately after the event‟s conclusion. They concluded that in the overall study, both technical system and social system outcomes are measured; however, the scope of this paper focuses only on the social system outcome, work area attitude and commitment, while Contents lists available at Science Direct results related to other technical system and social system out- comes will be presented in future works. This paper identifies the factors that most strongly influence the sustainability of work area employee attitudes and commitment to Kaizen events based on a field study of 65 events in eight manufacturing organizations. The findings also present guidelines for organizations and areas for future research. Caroly et al. (2010) worked on “Sustainable MSD prevention: Management for continuous improvement between prevention and production, Ergonomic intervention in two assembly line companies”. According to them the aim is to analyse the conditions required for this safety/production logic approach to be integrated in the „„continuous improvement‟‟ systems of French industry. Incorporating organizational level into occupational health research is an international question which could help industries to improve production/safety and preserve worker health. They concluded, to increase output and meet customer‟s needs, companies have turned to the development of production management systems: Kaizen, one piece flow, Kanban, etc. The aim of such systems is to accelerate decisions, react to environmental issues and manage various productions. Conversely, regulation and control systems focusing on work-related risks have obliged firms to implement health and safety management systems such as OHSAS 18001. The purpose of this type of system, also based on continuous improvement, is to reduce risks, facilitate work-related activities and identify solutions in terms of equipment and tools.
Dombrowski et al. (2014) worked on “Lean Leadership – 15 Rules for a sustainable Lean Implementation”. According to them implementation of a lean production system changes the way improvements are made. In order to eliminate waste continuously, employees have to question their processes and identify improvement possibilities. They concluded that Lean leadership could be the missing link between toolbox lean and a sustainable continuously improving organization. More and more enterprises realize that they have so far basically focused on the visible parts of lean production systems. The common approach can be explained by using the 4P Model. It consists of 4 levels that are all necessary for a sustainable lean implementation. The levels are: philosophy (long-term thinking), process (eliminate waste), people and partner (respect, challenge and grow them) and problem solving.
Vol. 4, Issue 3, March 2015
concluded that this paper aims to deepen our understanding of the mechanisms underlying the mutual constitution of competing institutional logics and sociomaterial entanglements by combining a sociomaterial lens with the institutional logics perspective. First, they show how the perceived affordances of a technology are created from the experience of using several different technologies and how the rejection of one technology can simultaneously constitute another. Second, they show how visualization artifacts, entangled in sociomaterial practices, can shape individual focus of attention and thus facilitate the integration of a new institutional logic in operational practice.
III. PROBLEM IDENTIFICATION
There are various types of problem occurred in this company which are described below:
Improper material handling
After extrusion and cooling processes of pipes/tubes workers manually distinguish them, hence consumes more time than ideal time.
Visualization problem
There is no indication for fluid inside the pipe and its flow direction. Also there is no visualization for type and operating range of gauge/valve throughout the plant. Plant also lacks in process visualization for pilgering, annealing and degreasing processes.
Waste of motion and time
Due to unadapted standards and techniques waste of motion and time takes place, this kind of waste affect to overall cost of product and productivity.
Ergonomics problem
The height of furnace is less than worker height at pilger machine, hence heat expelled from furnace increases surrounding temperature.
Early breakdown of machine
At extrusion press and DHDM machine there is improper preventive maintenance which results in early breakdown of machine.
Abnormality
Due to insufficient knowledge of worker, abnormality generates at their workplace.
Improper arrangement of tools and materials
Improper usage of space
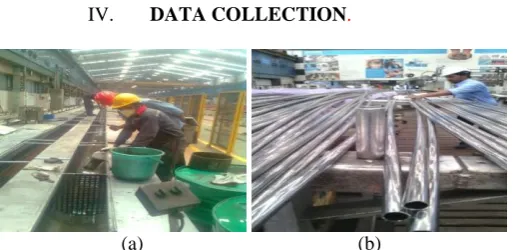
Improper communication between different departmentsIV. DATA COLLECTION.
(a) (b)
Vol. 4, Issue 3, March 2015
(c) (d)
Figure 4.2(c, d): Improper visualization of machining process at end facing machine. Due to sprinkling of oil over the glass it is not possible to examine the process.
(e) (f)
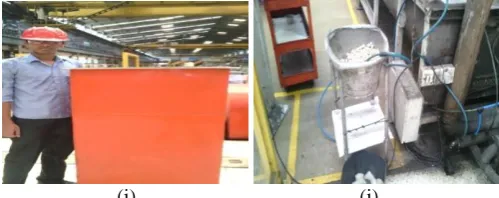
Figure 4.3(e, f): Poor maintenance of wiring and alkaline tank. As the alkaline tank is not properly maintained there is chance of tank to get bust up.
(g) (h)
Figure 4.4(g, h): Algae/Fungus on floor due to water and oil leakage from machine makes the floor slippery. There is no provision for using the leaked oil which leads in wastage.
(i) (j)
Vol. 4, Issue 3, March 2015
(k) (l)
Figure 4.6(k, l): Improper handling of scrap at scrap yard. There is no proper regulations to place scrap as per different materials.
V. DATA ANALYSIS & SUMMARY OF RESULT
Algae/Fungus on floor due to water leakage from eye washer
Improper stand to put used circular blades
Due to lack of stopper missing frequently at loading table chances of bar to fall down
Degreasing operator face problem to see valve open or not
Outer Diameter cleaning wiper has no identified place
There is no proper space to put air gun
Hard to identify the Card for mechanical and electrical check points at preventive maintenance board
No proper place to put instrument, cloth and marker
At present there is no provision for measurement of water level at cooling tower
Eccentric checking gauges difficult to find for different sizes
There is no visualization of types of fluid, flow direction and other specifications on pipelines
When start furnace, operator lot load on loading table. They have no identified space for plastic dispose
New operator not aware how much TDN 86 oil to be added in hollow bar
Scrap yard is not 5S implemented
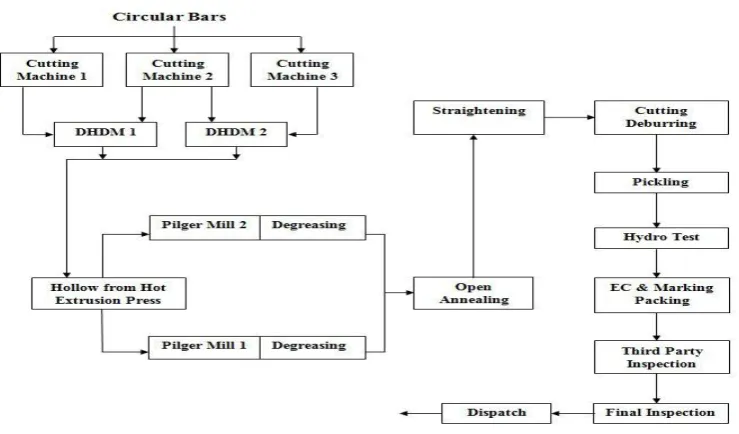
Flow Process Chart:
Vol. 4, Issue 3, March 2015
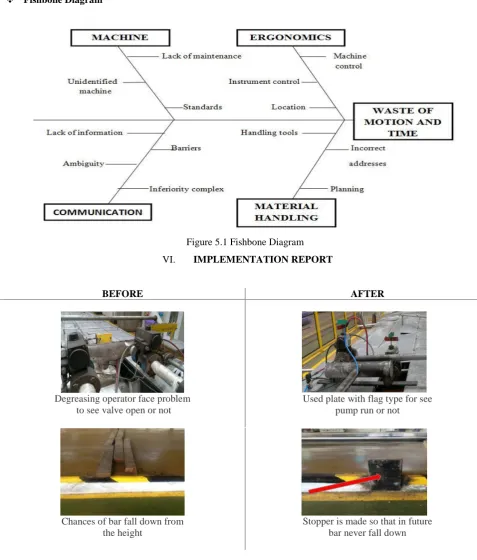
Fishbone Diagram
Figure 5.1 Fishbone Diagram
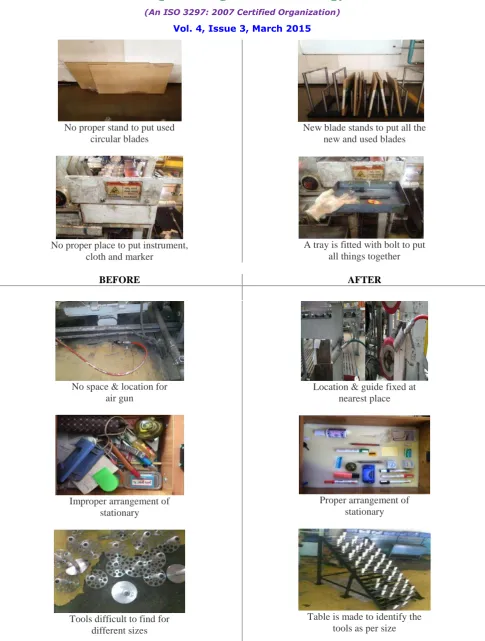
VI. IMPLEMENTATION REPORT
BEFORE AFTER
Degreasing operator face problem to see valve open or not
Used plate with flag type for see pump run or not
Chances of bar fall down from the height
Vol. 4, Issue 3, March 2015
No proper stand to put used circular blades
No proper place to put instrument, cloth and marker
New blade stands to put all the new and used blades
A tray is fitted with bolt to put all things together
BEFORE AFTER
No space & location for air gun
Improper arrangement of stationary
Tools difficult to find for different sizes
Location & guide fixed at nearest place
Proper arrangement of stationary
Vol. 4, Issue 3, March 2015
Hard to handle and identify the card for mechanical and electrical check points
Easy to handle and symbol represents mechanical check point.
VII. INNOVATION
Current state for pipelines does not show direction of the flow of fluid inside the pipe so we can use stickers which would indicate the direction of flow. There is no identification of which fluid is flowing inside the pipes so type of fluid can be indicated on the same sticker. And also it is difficult to predict the diameter of the pipes so diameter also can be written on the sticker. Sample of the sticker is shown below:-
Here, Flow Direction- towards right
Type of liquid passing into the pipeline – Oil (TDN 81) Diameter of the pipe- 3 inch
Vol. 4, Issue 3, March 2015
VIII. CONCLUSION
It has been concluded that by applying various lean manufacturing concepts at different areas following results are achieved.
Searching time reduced by 6-8 minutes.
Saved damage cost of circular blades by Rs. 1200-3600 per month. Improve safety of bars and saved them from getting damage at inventory.
Reduced searching time for tools at end facing machine by 10-12 minutes per day.
Weekly and monthly performance of maintenance activity can be easily analysed by section engineer.
Holding method for cards is replaced into t-card system which improves aesthetics of preventive maintenance board.
By providing updated preventive maintenance system, we reduce the paper work by 648 pages per year which is also helpful from the environmental aspect.
By providing PM plan with T-cards, we saved 4-5 minutes of maintenance activity for maintenance personnel. By providing proper provision for placing air gun, we reduce the fatigue of worker which improves worker
efficiency.
Reduced man motion, lead time and idle time by standardizing valves for various operations. Improved aesthetic and quality of workplace.
REFERENCES
[1] U. Dombrowski, T. Mielke, 2014, “Lean Leadership – 15 Rules for a sustainable Lean Implementation” Procedia CIRP 17 (2014) 565 – 570. [2] Prof. Girish G. Phatak, 2013, “Quality and Reliability Engineering”, Okhla Phase-II, New Delhi-110020.
[3] Lotta Hultin, Magnus Mahring, 2013, “Visualizing institutional logics in sociomaterial practices”Information and Organization 24 (2014) 129– 155.
[4] Dr. K.C. Arora, 2012, “Total Quality Management”, S. K. Kataria & Sons, Darya Ganj, New Delhi-110002.
[5] Rahani AR, Muhammad al-Ashraf, 2012, “Production Flow Analysis through Value Stream Mapping: A Lean Manufacturing Process Case Study”, Procedia Engineering 41 (2012) 1727 – 1734.
[6] Ranteshwar Singh, Ashish M Gohil, Dhaval B Shah, Sanjay Desai, 2012,” Total Productive Maintenance (TPM) Implementation in a Machine Shop: A Case Study”, Procedia Engineering 51 (2013) 592 – 599.
Vol. 4, Issue 3, March 2015
[8] S. Caroly, F. Coutarel, A. Landry, Mary-Cheray, 2009, “Sustainable MSD prevention: Management for continuous improvement between prevention and production. Ergonomic intervention in two assembly line companies”Applied Ergonomics 41 (2010) 591–599.
[9] Jennifer A. Farris, Eileen M. VanAken, Toni L. Doolen, June Worley, 2008,” Critical success factors for human resource outcomes in Kaizen events: An empirical study”, Int. J. Production Economics 117 (2009) 42–65.