ISSN: 2319-8753
International Journal of Innovative Research in Science,
Engineering and Technology
(An ISO 3297: 2007 Certified Organization) Vol. 3, Issue 11, November 2014
Separation of EMG Signals from the Mixture
of ECG-EMG Signals by Using Polynomial
Coefficients Estimation
K. Elamathi
1, M.Bhuvaneswaran
2Assistant Professor, Department of ECE, Muthayammal Engineering College, Namakkal, Tamil Nadu, India1,2
ABSTRACT: This paper presents a compact approach for removing the presence of electrocardiograms (ECG) in surface electromyography (EMG) signals. Electromyography (EMG) is a technique used to evaluate the activity of muscles to extract accurate information. Recording of a clean and undistorted electromyography (EMG) signal is a must for that. ECG can be significantly suppressed from the mixture by preserving most of the EMG signal content at low frequencies. Some of the artefacts that could affect EMG signals, such as crosstalk, can be avoided or minimized by a correct placement of the surface electrodes on the skin. While recording the EMG signal, it is often contaminated by the ECG signal. This artefact can hardly be avoided. So in order to extract valid information of the EMG signal, it is necessary to process the EMG signal to remove the ECG signal. The proposed method outperforms reference methods as it causes smallest distortion and the preservation of EMG at low frequencies (bandwidth 0–20 Hz).
KEYWORDS:ECG,EEG,EMG,frequency
.
I. INTRODUCTION
Electrocardiography (ECG or EKG from German: Electrocardiogram) is a transthoracic (across the thorax or chest) interpretation of the electrical activity of the heart over a period of time, as detected by electrodes attached to the outer surface of the skin and recorded by a device external to the body. The recording produced by this non-invasive procedure is termed as electrocardiogram (also ECG or EKG). An ECG test records the electrical activity of the heart. ECG is used to measure the rate and regularity of heartbeats, as well as the size and position of the chambers, the presence of any damage to the heart, and the effects of drugs or devices used to regulate the heart, such as a pacemaker. Most ECGs are performed for diagnostic or research purposes on human hearts, but may also be performed on animals, usually for diagnosis of heart abnormalities or research.
ELECTROMYOGRAPHY (EMG)
Electromyography (EMG) is a technique for evaluating and recording the electrical activity produced by skeletal muscles.EMG is performed using an instrument called an electromyography, to produce a record called an
electromyogram. An electromyography detects the electrical potential generated by muscle cells when these cells are electrically or neurologically activated. The signals can be analysed to detect medical abnormalities, activation level, and recruitment order or to analyze the biomechanics of human or animal movement. At best case a free selection of any electrode type is supported by an EMG – (pre-) amplifier. The selection of an electrode type strongly depends on the given investigation and condition, one electrode type cannot cover all possible requirements
ISSN: 2319-8753
International Journal of Innovative Research in Science,
Engineering and Technology
(An ISO 3297: 2007 Certified Organization) Vol. 3, Issue 11, November 2014
For surface electrodes, silver/silver chloride pre-gelled electrodes are the most often used electrodes and recommended for the general use (SENIAM). Besides easy and quick handling, hygienic aspects are not a problem when using this disposable electrode type. The electrode diameter (conductive area) should be sized to 1cm or smaller.Commercial disposable electrodes are manufactured as wet gel electrodes or adhesive gel electrodes.
II. EXISTING SYSTEM
There are different methods to remove the ECG components from the EMG signal “Elimination of electrocardiogram contamination from electromyogram signals: An evaluation of currently used removal technique’’ .The simplest method consists of high-pass filtering EMG signal with a fourth order Butterworth filter at a cut-off frequency of 30Hz . The existing technique use 1.FILTERS 2.WICA
III. LITERATURE SURVEY
The selection of an appropriate wavelet shapes and corresponding decision thresholding are major drawbacks from the users. The main problem with “Changes in the action potential and contraction of isolated frog muscle after repetitive stimulation,” method is that an important part of the EMG signals concerning the changes of negative after potentials is removed as well. It is known that the negative after potentials increase during fatigue and these changes could affect the amplitude of the EMG signal.Interferencecancellation is widely used in a numberof application such as acoustic and speech signal processing, data communication, biological signal acquisitionetc. Many papers with different approaches have been reported to cancel interferences in biosignals. This chapter provides a survey of existing methods for interference cancellationin ECG signal, FECG signal,EEGsignal,and EMG signal, and alsoincludes the survey of interference cancellationusingsome AI techniques.The outline of the methods used for interference cancellation. Interference cancellation in biosignals can be implemented using non-adaptive and adaptive methods. Techniques based on prior knowledge of the signal and the noise characteristics such as averaging, correlation etc have
been widely used for interference cancellation in biosignals. But the drawback of non-adaptive techniques is that they are time invariant in nature. This problem has been overcome by the adaptive methods, which comprise the AI techniques. The following sections providethe detailed survey of interference cancellation in different biosignals.
IV. PROPOSED SYSTEM
In this paper, we present an approach that addresses the issue of explicit nonstationary harmonic modeling of the ECG signal component. The motivation behind this approach arose from audio signal processing, where a similar scenario featuring a mixture of a quasi-harmonic signal component and a stochastic perturbation is often dealt. Herein, we model simultaneously both amplitude and frequency changes in the ECG signal component by means of a time-variant harmonic structure whose mean fundamental frequency is kept constant in the analysis window.The ECG model parameters are efficiently estimated from a linear system of equations by means of QR factorization.
It is shown that the time changes in an ECG harmonic are correctly captured by two constant-coefficients cubic polynomials each modulating a sine and a cosine function, respectively
ISSN: 2319-8753
International Journal of Innovative Research in Science,
Engineering and Technology
(An ISO 3297: 2007 Certified Organization) Vol. 3, Issue 11, November 2014
V. METHODOLOGIES
MODULE NAMES
ECG signal generation
EMG-ECG mixture
Sine/Cosine approximation
Polynomial coefficients estimation
MODULE DESCRIPTIONS
MODULE 1
ECG SIGNAL GENERATION
Using an electrocardiogram (ECG) is an invaluable way to identify various physical ailments. To conduct an ECG, medical personnel place leads on a patient’s skin and measure the electrical activity of the heart over one beat cycle. The outputs of the leads are combined to create an ECG signal. Variations in the signal amplitude and timing provide indications of various ailments such as myocardial infarction, hypocalcaemia, and emphysema. Today there is a wide array of cardiac equipment that displays and interprets ECG signal patterns. Medical equipment designers need a flexible way to seamlessly generate accurate ECG signal patterns to verify and test their designs.
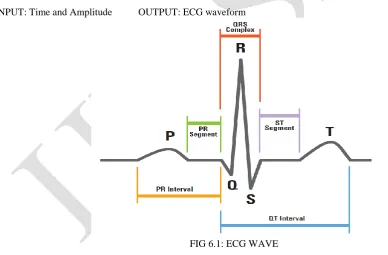
The ECG signal can by generated by the principle of Fourier series.we may notice that a single period of a ECG signal is a mixture of triangular and sinusoidal wave forms. Each significant feature of ECG signal can be represented by shifted and scaled versions one of these waveforms as shown below.QRS, Q and S portions of ECG signal can be represented by triangular waveformsP and T portions can be represented by triangular waveforms Once we generate each of these portions, they can be added finally to get the ECG signal.
INPUT: Time and Amplitude OUTPUT: ECG waveform
FIG 6.1: ECG WAVE
MODULE 2
ECG - EMG MIXTURE WAVEFORM
ISSN: 2319-8753
International Journal of Innovative Research in Science,
Engineering and Technology
(An ISO 3297: 2007 Certified Organization) Vol. 3, Issue 11, November 2014
closely match the ones of the real ECG-free surface EMG signals. This is typically achieved by calculating the filter coefficients in such a way that its frequency response fits the spectral envelope of the EMG signal. The EMG contribution to the mixture was determined by the signal-to-noise ratio (SNR), which we defined as the energy ratio between the EMG and ECG component in the analysis time window. In this way, we could simulate any segment of an EMG burst by simply adjusting the corresponding SNR. For the sake of illustration, we calculated the spectrum of the 20000- sample-simulated mixture signal by means of the 80000-point fast Fourier transform for two scenarios: SNR = 0 dB and SNR = –30 dB. INPUT: ECG & EMG signal OUTPUT: Mixture of ECG & EMG signal with noise
MODULE 3
SINE/COSINE APPROXIMATION:
𝒔𝑬𝑪𝑮 𝒕 = 𝜶 𝒌 𝒕 𝒔𝒊𝒏 𝟐𝝅𝒌𝒇𝟎𝒕 + 𝜷 𝒌 𝒕 𝒄𝒐𝒔 𝟐𝝅𝒌𝒇𝟎𝒕 𝑲
𝒌=𝟏
The harmonic stationary f0 -basis modulated by the third-order time polynomials. Both amplitude and frequency time variations are compactly characterized by the polynomial coefficients. As a result, the above equation is linear in parameters, and can be easily estimated by solving a linear system of equations. In order to check the Validity of the small-argument approximation, we have evaluated the sine/cosine approximation quality as a function of T in the following way: 𝜺𝒔= 𝒔𝒏 𝒏𝟐 (𝒔𝒏 𝒏− 𝒙𝒏)𝟐 𝜺𝒄= 𝒄𝒏 𝒏𝟐 (𝒄𝒏 𝒏− 𝟏)𝟐 Where 𝒔𝒏= 𝒔𝒊𝒏 (𝒙𝒏), 𝒄𝒏= 𝒄𝒐𝒔 𝒙𝒏 , 𝒙𝒏= 𝟐𝝅𝒇𝟏𝒕𝒏𝟐,
𝒕𝒏are uniformly distributed time instants in the range [–T/2, T/2]. The error terms 𝜺𝒔and 𝜺𝒄 are evaluated in decibels. INPUT: ECG-EMG mixture signal OUTPUT: Sine/Cosine approximation graph
MODULE 4
POLYNOMIAL COEFFICIENTS ESTIMATION:
𝜶 𝒌 𝒕 = 𝜶 𝒊 (𝒌) 𝒕𝒊 = 𝑨 𝒐 (𝒌) + 𝑨𝟏(𝒌)𝒕 − 𝟐𝝅𝒌𝒇𝟏 𝟑 𝒊=𝟎 𝑩𝒐 (𝒌) 𝒕𝟐− 𝟐𝝅𝒌𝒇 𝟏𝑩𝟏 (𝒌) 𝒕𝟑 𝜷 𝒌 𝒕 = 𝜷 𝒊 (𝒌) 𝒕𝒊 = 𝑩 𝒐 (𝒌) + 𝑩𝟏(𝒌)𝒕 − 𝟐𝝅𝒌𝒇𝟏 𝟑 𝒊=𝟎 𝑨𝒐(𝒌)𝒕𝟐− 𝟐𝝅𝒌𝒇 𝟏𝑨𝟏 (𝒌) 𝒕𝟑
The coefficients 𝛼𝑖(𝑘)and 𝛽𝑖(𝑘)are efficiently estimated by means of the linear least-squares (LS) algorithm applied to above equation in the matrix form,
𝒔 = 𝑴𝜆 + 𝜺
ISSN: 2319-8753
International Journal of Innovative Research in Science,
Engineering and Technology
(An ISO 3297: 2007 Certified Organization) Vol. 3, Issue 11, November 2014
VI. SIMULATION RESULTS
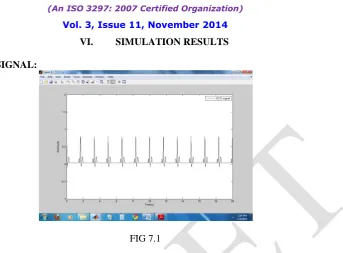
GENERATED ECG SIGNAL:
FIG 7.1
The aim of the ECG simulator is to produce the typical ECG waveforms of different leads and as many arrhythmias as possible. My ECG simulator is a matlab based simulator and is able to produce normal lead II ECG waveform.The use of a simulator has many advantages in the simulation of ECG waveforms. First one is saving of time and another one is removing the difficulties of taking real ECG signals with invasive and noninvasive methods. The ECG simulator enables us to analyze and study normal and abnormal ECG waveforms without actually using the ECG machine. One can simulate any given ECG waveform using the ECG simulator.
EMG SIGNAL WITH NOISE:
FIG 7.2
ISSN: 2319-8753
International Journal of Innovative Research in Science,
Engineering and Technology
(An ISO 3297: 2007 Certified Organization) Vol. 3, Issue 11, November 2014
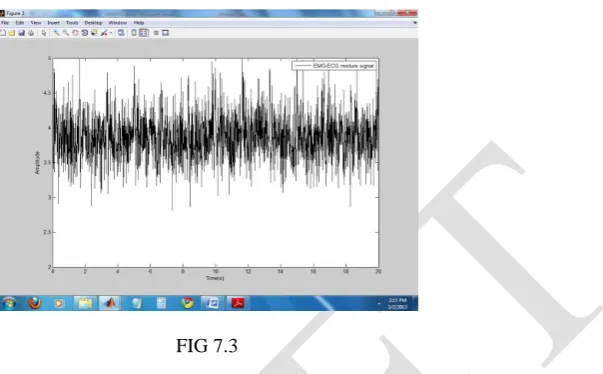
ECG-EMG MIXTURE SIGNAL:
FIG 7.3
Electromyography (EMG) is a technique used to evaluate the activity of the muscles. For extracting accurate information, it is required to record a clean and undistorted electromyography (EMG) signal. There are many artifacts that couldaffect EMG signals, such as crosstalk, which can be avoided or minimized by a correct placement of the surface electrodes on the skin. However, when the EMG signal is recorded on some specific muscles it is often contaminated by the ECG signal and significantly increasing the power of the EMG signal. This artifact can hardly be avoided; therefore, to extract valid information of the EMG signal, it is necessary to process the EMG signal to remove the ECG signal.
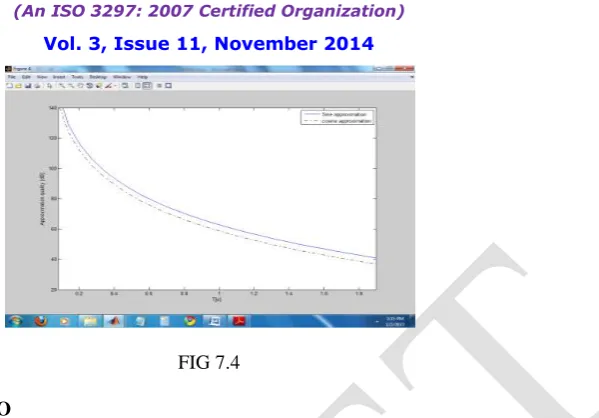
SINE/COSINE APPROXIMATION:
The primary aim of a general approximation is to represent non-arithmetic quantities by arithmetic quantities so that the accuracy can be ascertained to a desired degree. Secondly, we are also concerned with the amount of computation required to achieve this accuracy. These general notions are applicable to functions f(x) as well as to functional F(f) (A functional is a mapping from the set of functions to the set of real or complex numbers). Typical ex-amples of quantities to be approximated are transcendental functions, integrals and derivatives of functions, and solutions of differential or algebraic equations. Depending upon the nature to be approximated, different techniques are used for different problems.
A complicated functionf(x) usually is approximated by an easier functionof the formφ(x;a0,...,an)wherea0,...,anare parameters to be determinedso as to characterize the best approximation off. Depending on the sense inwhich the approximation is realized, there are three types of approaches:
1.Interpolatory approximation: The parametersaiare chosen so that on afixed prescribed set of pointsxi,i=0,1,...,n,wehaveφ(xi;a0,...,an)=f(xi):=fi.
ISSN: 2319-8753
International Journal of Innovative Research in Science,
Engineering and Technology
(An ISO 3297: 2007 Certified Organization) Vol. 3, Issue 11, November 2014
FIG 7.4
EMG- TO – RESIDUAL RATIO
Residual neuromuscular block is defined as a mechanomyography (MMG) orelectromyography (EMG) train-of-four (TOF) ratio <0.90, and is common in patients receivingneuromuscular blocking drugs. Objective neuromuscular monitoring is the only reliable way todetect and exclude residual neuromuscular block. Acceleromyography (AMG) is commerciallyavailable and easy to use in the clinical setting. However, AMG is not interchangeable with MMGor EMG. Currently, it is unclear what value must be reached by AMG TOF ratio to reliably excluderesidual neuromuscular block.
FIG 7.5
VII. CONCLUSION
This paper has proposed an approach for recovering EMG signals from the mixture of ECG-EMG signals. Time variant harmonic modelling of ECG signal component is an adequate tool for removing cardiac artefacts in surface EMG signals. The strength of the proposed approach is founded in a correct characterization of instantaneous amplitude and frequency changes in the ECG. ECG can be described by a simple analytical formulation containing low-order polynomials and harmonically related stationary Sins and cosines. The ECG model parameters are efficiently estimated from a linear system of equations by means of QR factorization. The proposed method has been compared to two reference methods based on high-pass filtering and wavelet independent component analysis (WICA), respectively. The experimental comparison results show that in the analysis bandwidth 0–20 Hz, the proposed method outperforms the reference methods, as it introduces the smallest distortion in the EMG signal component.
REFERENCES
[1] C. J. De Luca, “The use of surface electromyography in biomechanics,” J. Appl. Biomech., vol. 13, no. 2, pp. 136–163, 1997.
ISSN: 2319-8753
International Journal of Innovative Research in Science,
Engineering and Technology
(An ISO 3297: 2007 Certified Organization) Vol. 3, Issue 11, November 2014
[3] M. S. Redfern, R. E. Hughes, and D. B. Chaffin, “High-pass filtering to remove electrocardiographic interference from torso EMG recordings,” Clin.Biomech., vol. 8, pp. 44–48, 1993.
[4] J.Hanson and A. Persson, “Changes in the action potential and contraction of isolated frogmuscle after repetitive stimulation,” Acta. Physiol. Scand., vol. 81, pp. 340–348, 1971.
[5] J. Hanson, “The effects of repetitive stimulation on the action potential and the twitch of rat muscle,” Acta. Physiol. Scand., vol. 90, pp. 387–400, 1974.
[6] N. A. Dimitrova and G. V. Dimitrov, “Interpretation of EMG changes with fatigue: Facts, pitfalls, and fallacies,” J. Electromyogr. Kinesiol., vol. 13, no. 1, pp. 13–36, 2003.
[7] Z. C. Lateva and K. C. McGill, “The physiological origin of the slow after wave in muscle action potentials,” Electroencephalogram. Clin.Neurophysiol., vol. 109, no. 5, pp. 462–469, Oct. 1998.
[8] Y. Deng, W. Wolf, and R. Schnell, “New aspects to event-synchronous cancellation of ECG interference: An application of the method in diaphragmatic EMG signals,” IEEE Trans. Biomed. Eng., vol. 47, no. 9, pp. 1177–1184, Sep. 2000.
[9] G. Lu, J. S. Brittain, P. Holland, J. Yianni, A. L. Green, J. F. Stein, T. Z. Aziz, and S. Wang, “Removing ECG noise from surface EMG signals using adaptive filtering,” Neurosci. Lett., vol. 462, no. 1, pp. 14–19, Oct. 2009.
[10] C. Marque, C. Bisch, R. Dantas, S. Elayoubi, V. Brosse, and C. Perot, “Adaptive filtering for ECG rejection from surface EMG recordings,” J. Electromyogr. Kinesiol., vol. 15, no. 3, pp. 310–315, Jun. 2005.
[11] J. N. Mak, Y. Hu, and K. D. Luk, “An automated ECG-artifact removal method for trunk muscle surface EMG recordings,” Med. Eng. Phys., vol. 32, no. 8, pp. 840–848, Oct. 2010.