ROBLES POBLETE, FELIPE. Rate-dependent Interfacial Mechanics in Advanced Material Systems. (Under the direction of Dr. Yong Zhu).
An important branch of applied mechanics involves the category of problems which examines the mechanical behavior of contact regions. There are an extensive number of engineering applications that require one material to be bonded to another. Examples of these applications include adhesive joints, composite materials, protective coatings, and thin films used in the fabrication of microelectronics devices. A great deal of research has been devoted in order to develop techniques to predict the strength of the bond by endowing the interface with its own characteristic constitutive response, rather than plainly assuming it to be frictionless or perfectly bonded. In this dissertation, rate-dependent contact problems in different advanced materials systems were studied in order to better understand their behaviour at certain loading conditions.
First, the interlayer mechanical properties and adhesion between glass and SaflexTM polyvinylbutyral (PVB) was studied. The adhesion characterization was accomplished by carrying out mode 1 and mode 2 fracture mechanics experiments of laminated glass-PVB specimens. The traction-separation laws for modes 1 and 2 obtained were used in the development of a finite element model of the crack initiation. The results presented were important to determine the resistance of laminated glass under certain loading conditions and contribute to a better understanding of the mechanism involved on the failure of laminated glass.
quantify the adhesion between SiNW and nontreated PDMS COMPOSITE, which is characterized by weak and time-independent dispersion forces (type of van der Waals force). In contrast, cohesive shear-lag model was adopted to study the adhesion between SiNW and UVO-treated PDMS COMPOSITE, which is explained by a strong and time-dependent chemical (condensation) reaction. Similar analysis was used in the interfacial characterization between silver nanowire (AgNW) and PDMS COMPOSITE substrate, which is applied in the study of not only the stretching, but also the buckling and fracture of AgNWs. The information presented contributes to a better understanding of the mechanics behind the adhesion between 1D nanomaterials and elastomeric substrates as well as provide relevant information to help in the assembly of NW-based flexible/stretchable electronic devices.
by
Felipe Robles Poblete
A dissertation submitted to the Graduate Faculty of North Carolina State University
in partial fulfillment of the requirements for the degree of
Doctor of Philosophy
Mechanical Engineering
Raleigh, North Carolina 2018
APPROVED BY:
_______________________________ _______________________________ Yong Zhu Jan Genzer
Committee Chair
ii DEDICATION
iii BIOGRAPHY
iv ACKNOWLEDGMENTS
I would like to thank my PhD advisor, Dr. Yong Zhu, for his guidance and support through my PhD career. I also thank all my colleagues in Dr. Zhu’s group: Dr. Guangming Cheng, Dr. Jimmy Chang, Dr. Shanshan Yao, Dr. Qijin Huang, Dr. Jianxun Cui, Chengjun Li, and Zheng Cui. Thank you for all your help with experiments.
I’m thankful to Professors Fuh-Gwo Yuan, Chih-Hao Chang, and Jan Genzer for kindly serving as my Committee members. I’m also thankful to Dr. Michael Dickey for serving as a Committee member during my Prelim exams. Thank you for the comments and suggestions, which help greatly to improve this dissertation.
v TABLE OF CONTENTS
LIST OF TABLES ... viii
LIST OF FIGURES ... ix
CHAPTER 1: Measuring the Traction-Separation Law for PVB/Glass Interface ... 1
1.1 Introduction ... 1
1.2 Experimental methods ... 4
1.2.1 Test setup ... 4
1.2.2 Test procedures ... 9
1.3 Results ... 10
1.3.1 Mode 1 fracture - experimental... 10
1.3.2 Mode 2 fracture - experimental... 13
1.3.3 Mode 1 fracture – FEA simulation ... 15
1.3.4 Mode 2 fracture – FEA simulation ... 15
1.4 Discussion ... 16
1.5 Conclusion ... 19
Supplementary Information (SI) ... 21
1.S1 Failure mode prediction ... 21
References ... 23
CHAPTER 2: Study of stress transfer between SiNW and PDMS COMPOSITE ... 29
2.1 Introduction ... 29
2.2 Experimental setup... 31
2.3 Theoretical analysis ... 33
vi
2.3.2 Integrated cohesive zone model with shear-lag analysis ... 35
2.3.3 Mechanism of NW Alignment ... 37
2.4 FEA model ... 38
2.5 Results and discussion ... 40
2.6 Conclusion ... 51
Supplementary Information (SI) ... 53
2.S1 Adhesion tests ... 53
2.S2 FEA parametric study ... 55
References ... 58
CHAPTER 3: Study of stress transfer between AgNW and PDMS COMPOSITE ... 66
3.1 Introduction ... 66
3.2 Experimental setup... 68
3.3 AgNW/PDMS COMPOSITE experiments and FEA modeling ... 69
3.3.1 Stretching of AgNWs on top of nontreated PDMS COMPOSITE ... 69
3.3.2 Buckling of AgNWs on top of nontreated PDMS COMPOSITE ... 73
3.3.3 Fracture of AgNWs on top of UVO-treated PDMS COMPOSITE ... 79
3.3.4 Fracture of AgNWs embedded UVO-treated PDMS COMPOSITE ... 85
3.4 Conclusion ... 88
Supplementary Information (SI) ... 91
3.S1 SEM images of buckled and fractured AgNWs ... 91
References ... 92
CHAPTER 4: Study of Al2O3 and ZnO nanopillars under nanoindentation ... 99
vii
4.2 Compressive experiments by nanoindentation ... 100
4.3 FEA modeling of nanoindentation ... 105
4.4 Anelasticity experiment ... 110
4.5 FEA modeling of anelasticity experiments ... 111
4.6 Conclusion ... 114
viii LIST OF TABLES
Table 1.1 Parameters of the mode 1 traction-separation law as a function of the
loading rate ... 12 Table 1.2 Parameters of the mode 2 traction-separation law as a function of the
loading rate ... 14 Table 1.3 Fracture energy values at different peel rates ... 19 Table 2.1 Interfacial property values found from the analytical solution and FEA
for the nontreated PDMS COMPOSITE ... 45 Table 2.2 Interfacial property values found from the analytical solution and FEA
ix LIST OF FIGURES
Figure 1.1 Schematics of the DCB test configuration and specimen (𝐿 = 240 𝑚𝑚,
𝐵 = 36 𝑚𝑚, 𝑎 = 90 𝑚𝑚, ℎ𝑆𝑡𝑒𝑒𝑙 = 25.4 𝑚𝑚, ℎ𝐺𝑙𝑎𝑠𝑠 = 8 𝑚𝑚, 𝑡𝑃𝑉𝐵 = 0.3 𝑚𝑚) ... 8
Figure 1.2 Stress concentration along the Steel/Glass beam length for the different
Steel beam thicknesses ... 8 Figure 1.3 Schematics of the modified ARCAN test fixture and shear sample,
including (a) the circular grips, (b) the coupling with specimen attachment, and (c) an optical image of the setup mounted in the Instron testing
machine. All dimensions are in millimeters ... 9 Figure 1.4 (a) J-integral vs. normal separation curve for the loading rate of
0.3 mm/min − 𝛿𝑛 and (b) traction-separation law obtained through
differentiation and after applying the Savitzky-Golay method for the
loading rate of 0.3 mm/min ... 11 Figure 1.5 (a) Side view of the DCB specimen before testing and (b) Side view
of the DCB specimen during testing showing the interfacial
delamination. (c) Postmortem DCB specimen showing PVB film adhered
to one of the substrates ... 12 Figure 1.6 (a) J-integral vs. normal separation curve and (b) normal traction vs. normal
separation curves for loading rates ranging from 0.01 to 1.8 mm min ... 12 Figure 1.7 (a) Front view of the ARCAN Shear specimen before testing and (b)
front view of the ARCAN Shear specimen during testing showing the interfacial delamination. (c) Postmortem ARCAN Shear specimen
showing PVB film adhered to one of the substrates ... 14 Figure 1.8 (a) J-integral vs. shear separation curve and (b) shear traction vs. normal
separation curves for loading rates ranging from 0.01 to 1.2 mm min ... 14 Figure 1.9 (a) Force-extension curves comparison between experiment and simulation
for mode 1 fracture and (b) force-extension curves comparison between
experiment and simulation for mode 2 fracture ... 16 Figure 1.10 Glass-PVB laminate subjected to a peel test ... 19 Figure 1.S1 Parametric study of the traction-separation law constants for mode 2 and
3 that was used to predict the failure mode of a glass-PVB structure
subjected to a quasi-static three-point bending test ... 22 Figure 2.1 SiNW/PDMS COMPOSITE stretching experiments for (a) nontreated
x Figure 2.2 SiNW/PDMS COMPOSITE interfacial phases and traction-separation laws
for (a) nontreated PDMS COMPOSITE and (b) 45 min UVO treated
PDMS COMPOSITE ... 37 Figure 2.3 Schematics showing the mechanism of NW alignment: (a) a NW transferred
to a strained PDMS COMPOSITE with a rectangle of PDMS COMPOSITE bounding the NW; (b) the NW position after release of strained PDMS COMPOSITE, which is analogous to a longitudinal compressive
displacement ... 38 Figure 2.4 (a) Comparison between experiment and FEA results of the average SiNW
strain versus the applied PDMS COMPOSITE strain for (a) nontreated
PDMS COMPOSITE and (b) 45 min UVO-treated PDMS COMPOSITE ... 44 Figure 2.5 Comparison between analytical and FEA results of the SiNW strain
distribution along its length for (a) nontreated PDMS COMPOSITE and (b) 45 min UVO-treated PDMS COMPOSITE ... 46 Figure 2.6 FEA and experimental results relating the new skew angle to the initial skew
angle after release of a strain of 80% in PDMS COMPOSITE ... 47 Figure 2.7 SiNW average strain dependence on (a) shear stiffness and (b) shear strength
using the bilinear cohesive law in Figure 2(a) ... 49 Figure 2.8 SiNW average strain dependence on (a) shear stiffness, (b) shear strength,
and (c) shear fracture energy using the bilinear cohesive law in Figure 2(b) ... 49 Figure 2.9 SiNW maximum strain variation on top of nontreated PDMS COMPOSITE
for a range of (a) SiNW diameters (𝐿=15 µ𝑚) and (b) SiNW lengths
(𝐷=20 𝑛𝑚) ... 51 Figure 2.10 SiNW maximum strain variation on top of 45 min UVO-treated PDMS
COMPOSITE for a range of (a) SiNW diameters (𝐿 = 15 µ𝑚) and (b)
SiNW lengths (𝐷 = 20 𝑛𝑚) ... 51 Figure 2.S1 Sample mounted in the Delaminator v8.2 Adhesion Test System ... 54 Figure 2.S2 Adhesion force recorded for (a) nontreated PDMS COMPOSITE sample
and (b-c) two different 20 min UVO-treated PDMS COMPOSITE samples ... 55 Figure 2.S3 (a) Comparison between the experiment average SiNW strain for the
nontreated PDMS COMPOSITE with the average SiNW strain calculated in FEA by varying the interface parameters of the traction-separation law employed in the case of UVO-treated PDMS COMPOSITE and (b)
xi Figure 2.S4 (a) Comparison between the experiment average SiNW strain for the
UVO-treated PDMS COMPOSITE with the average SiNW strain calculated in FEA by varying the interface parameters of the traction-separation
law employed in the case of nontreated PDMS COMPOSITE and (b)
R squared curve ... 57 Figure 3.1 NW#1 and NW#3 placed on top of pristine PDMS COMPOSITE substrate
subjected to the tensile strain shown in the pictures ... 72 Figure 3.2 (a) Traction-separation law used in the FEA cohesive model for AgNW
on top of pristine PDMS COMPOSITE , (b) experimental results for the average strain in three different AgNWs, and (c) experimental vs. FEA
results for the average strain in NW #1 ... 73 Figure 3.3 NW #3 transversally placed on top of pristine PDMS COMPOSITE
substrate subjected to the tensile strain shown in the pictures ... 77 Figure 3.4 (a) Experimental vs. FEA results for the average strain in three different
AgNWs on top of pristine PDMS COMPOSITE and (b) strain distribution along NW #3 length before buckling happens and (c) strain distribution along NW #3 length after buckling happens ... 78 Figure 3.5 Buckling evolution of NW #3 obtained by FEA simulation at specific strain
values applied to the PDMS COMPOSITE substrate ... 79 Figure 3.6 NW#1 and NW#2 placed on top of UVO-treated PDMS COMPOSITE
substrate subjected to the tensile strain shown in the pictures ... 83 Figure 3.7 Traction-separation law used in the FEA cohesive model for AgNW on top
of UVO-treated PDMS COMPOSITE and (b) experimental vs. FEA results for the average strain in two different AgNWs on top of UVO-treated
PDMS COMPOSITE ... 84 Figure 3.8 (a) Experimental vs. FEA results for the average strain for the left segment
of AgNW #1 on top of UVO-treated PDMS COMPOSITE and (b)
experimental vs. FEA results for the average strain for the right segment of
AgNW #1 on top of UVO-treated PDMS COMPOSITE ... 85 Figure 3.9 AgNW embedded in UVO-treated PDMS COMPOSITE substrate subjected
to the tensile strain shown in the pictures ... 87 Figure 3.10 Experimental vs. FEA results for the average strain in an AgNW embedded
xii Figure 3.11 (a) Experimental vs. FEA results for the average strain for the left segment
of an AgNW embedded in UVO-treated PDMS COMPOSITE and (b) experimental vs. FEA results for the average strain for the right segment of
the same AgNW ... 88 Figure 3.S1 (a) SEM image of a post-buckled AgNW on top of a pristine PDMS
COMPOSITE and (b) SEM image of a fractured AgNW on top of a
UVO-treated PDMS COMPOSITE ... 91 Figure 4.1 Scanning electron micrographs of samples used for mechanical testing.
(a-c) Cross-sectional image of ZnO nanolattices with thicknesses 95 nm, 58 nm, and 45 nm respectively. (d-f) Cross-sectional SEM image of Al2O3 nanolattices with thicknesses 19 nm, 10 nm, 4 nm respectively. The thinnest nanolattice tested for mechanical properties had a shell thickness of 4 nm. Cross-sectional image of 4 nm nanolattice shows the structure is
free-standing and does not collapse during template removal process ... 103 Figure 4.2 (a) Mechanical testing of nanolattice using nanoindentation. (a) Typical
cyclic load-displacement curve for 30 nm Al2O3 nanolattice. ‘Pop-in’ indicates first instance of mechanical failure of nanolattice film. Inset shows post-indent SEM image with residual indentation imprint,
showing brittle fracture of top planar layer (b) Load-displacement curve for 15 nm Al2O3 nanolattice showing similar loading-unloading behavior as 30 nm Al2O3 nanolattice. This is the thinnest sample tested which failed by fracture of top planar layer. (c) Load-displacement curve for 4 nm Al2O3 nanolattice showing gradual ‘pop-in’ event. Inset shows post-indent SEM with no residual indentation imprint. Non-zero adhesion force from van der Waal’s attraction between the diamond indent and Al2O3 nanolattice indicate near-complete recovery post indentation. (d) Load-displacement curve for 45 nm ZnO nanolattice showing ‘pop-in’ event similar to thicker Al2O3 nanolattice. Inset shows post indent SEM image with
brittle fracture around holes ... 104 Figure 4.3 Specific energy dissipation for Al2O3 and ZnO nanolattice plotted against
relative density. The Al2O3 nanolattice shows more favorable power law
scaling ... 105 Figure 4.4 Nanolattice indentation modeled in FEA showing (a) the indenter tip
positioned over the entire nanolattice, (b) actual nanolattice model analyzed considering a quarter symmetry, and (c) basic structure
xiii Figure 4.5 Maximum principal strain for the 10 nm and 40 nm thick Al2O3 structure. (a)
Strain distribution across the entire 10 nm thick structure. (b) Part of the structure above the critical strain value for the 10 nm thick structure. (c) Strain distribution across the entire 40 nm thick structure. (d) Part of
the structure above the critical strain value for the 40 nm thick structure ... 108 Figure 4.6 Hysteresis loops for 4 nm Al2O3 nanolattice ... 109 Figure 4.7 Loading history applied during the nanoindentation experiment to
investigate the anelasticity behaviour of Al2O3 nanolattice films ... 110 Figure 4.8 (Average force-displacement resultant from the nanoindentation experiment
to investigate the anelasticity behaviour of Al2O3 nanolattice films. Results show the average loading indentation displacement (a) was 14.6 nm, the average instant recovery displacement (b) was 63.6 nm, and the average
unloading relaxation displacement (c) was 9.1 nm ... 111 Figure 4.9 Deformed configuration of a 30 nm Al2O3 nanolattice structure subjected to
a 90 nm indentation displacement ... 113 Figure 4.10 Force-displacement curve comparison between nanoindentation experiment
and FEA model ... 113 Figure 4.11 Concentration evolution of a defect type across the thickness of one of the
1 CHAPTER 1 Measuring the Traction-Separation Law for PVB/Glass Interface 1.1 Introduction
Laminated safety glass is manufactured by bonding a polymeric layer to two or more glass plies under high pressure and temperature1. Under these conditions, a strong bonding between the polymer’s hydroxyl groups and the glass’ silanol groups2 is developed. In applications such as in automotive windshields, the shear coupling generated by the interlayer3 prevents the glass laminate from shattering once it’s impacted as the glass fragments remain connected to it. Thus, the interlayer greatly improves the post-glass fracture phase while reducing the possibility of injury that could be caused by scattered glass shards. Glass laminates are also commonly used in architectural glazing, in which long term stability is a key factor to be evaluated taking into account the presence of visual defects and delamination. Polyvinyl butyral (PVB) is the most frequent used interlayer material in industry due to its high adhesive power and enhanced optical qualities. Another recent application of glass-PVB laminates is in the car roofs, improving the habitability of the vehicle. This situation requires the laminate to sustain higher loads at considerable lower rates.
2 In recent years, there has been several studies on glass-PVB adhesion through the investigation of fractured laminate deformation and delamination. The current framework of linear elastic fracture mechanics (LEFM) is difficult to be implemented due to large localized deformation of the interlayer polymer10-11 and the impossibility of finding a defect large enough to be considered a crack11. In view of this limitation, other methods had to be applied. Several researchers have used an energy balance method12-14, which equates the external work done to the strain energy stored in the interlayer and the energies dissipated by interlayer viscous deformation and interface delamination. Through cracked tension (TCT) specimens are predominantly used12,14-16 to evaluate the interfacial shear fracture toughness (Mode 2) between glass and PVB. Other configurations also used are the double lap shear test17 and the compression shear test10. Although it’s claimed that pure Mode 2 fracture toughness can be obtained from these methods; there is a concern, especially for the last two configurations, that they may cause compression of and friction on the crack faces.
Moreover, the main limitation of the energy balance approach is that usually only one interfacial parameter, namely the interfacial energy release rate (fracture toughness), is obtained. On the other hand, cohesive zone modeling introduces a second fracture parameter: the cohesive strength, relating the fracture toughness to the critical crack-tip opening displacement required for crack propagation.
3 Needleman, 199019-20 of void nucleation, growth and coalescence through the modeling of the crack plane using springs with a built-in traction-separation law. Tvergaard and Hutchinson, 1993; Tvergaard and Hutchinson, 199421-22 expanded this model in order to investigate interfacial debonding under mixed-mode conditions. More recently, Roe and Siegmund, 200323 developed a cohesive zone model that described the failure of adhesive-bonded composite under cyclic loading. In this case, the traction-separation behavior does not follow a predetermined traction-separation path and the damage evolution can vary from point to point.
The characterization of several interface problems have been carried out using cohesive zone modeling. Yang et al, 200124 modeled fatigue damage and crack growth in quasibrittle materials. Li and Chandra, 200325 studied the influence of crack-tip plasticity in the crack initiation and propagation in ductile elasto-plastic material. Yang and Cox, 200526 modeled the mixed mode damage evolution of cracks in laminated composites. Ji et al., 201027 studied the effect of adhesive thickness on the Mode 1 fracture of low carbon Steel plates bonded with epoxy. Traction- separation law rate dependency in quasi-static experiments has also been reported. Recently, Iwasaki et al, 200728 measured the traction-separation law for glass-PVB laminates at high loading rate. Karac et al., 201129 tested a tapered double cantilever beam composed of aluminum alloy bonded with epoxy at different loading rates. Rosa et al., 201230 adopted a time dependent cohesive model while studying the effect of loading rate in concrete failure.
4 separation laws for polyurea/Steel interfaces. Dastjerdi et al, 201335 employed a rigid DCB technique in order to directly obtain the traction-separation law for polyurethane, epoxy, and silicone adhesives. Gowrishankar et al, 201236 compared direct and iterative methods for determining the mode 1 traction-separation law for silicon-epoxy interface and concluded that the direct method provided more accurate results with the ease of parameter extraction.
The present paper has the objective of characterizing the interface between glass and PVB by directly obtaining traction-separation laws for modes 1 and 2 at different loading rates. First, we describe the experiment methods used to test the fracture behavior of the laminate. Next, we report the mode 1 and mode 2 traction-separation laws obtained for glass/PVB interface. These extracted laws are then directly input into finite element models, when the calculated force-extension curves are compared to the ones obtained through the experiments as a way to validate the models. Finally, the results and possible limitations encountered are discussed.
1.2 Experimental methods
This section describes the experiment procedures employed to obtain the modes 1 and 2 traction-separation laws for the glass/PVB interface. The glass-PVB sandwich specimens were provided by EASTMAN Chemical Company.
1.2.1 Test methods
5 between them. The backing beam thickness necessary to achieve this goal was found through FEA. In the FEA model, it was considered the bonding between glass and PVB to be perfect. Then, the structure was loaded as in the DCB test by applying a vertical displacement at the end of one of the beams while keeping the other beam fixed. Figure 1.2 shows the maximum principal stress distribution along the length of the glass beam when a Steel backing beam with different thicknesses is attached to it. From the plot, it’s noticed that the stress concentration is localized in the glass region just above where the PVB film starts (crack front). By increasing the Steel backing beam thickness to 1”, it’s possible to decrease the stress concentration in that region to about 100 MPa which is below the tensile and compressive strength reported37. Because the DCB arm thickness was considerably large, their effect could not be neglected so that the J-integral was calculated based on a beam with elastic foundation38.
𝐽 = 12𝑃2𝑎2
𝐸𝑓𝑥𝐵2ℎ3[1 + 1.28 ( ℎ 𝑎) (
𝐸𝑓𝑥 𝐸𝑧)
1 4⁄
+ 0.41 (ℎ
𝑎) 2
(𝐸𝑓𝑥
𝐸𝑧) 1 2⁄
] (1.1)
In the equation above, P is the applied load, a is the crack length, h is the adherent thickness, B is the specimen width, Efx is the specimen longitudinal elastic modulus and Ez is the specimen transverse elastic modulus. The longitudinal and transverse elastic moduli for the bimaterial beam were estimated by the composite theory of the rule of mixtures39.
𝐸𝑓𝑥 = ℎ̅𝐸𝑔𝑙𝑎𝑠𝑠+ ℎ̅𝐸𝑆𝑡𝑒𝑒𝑙 (1.2)
𝐸𝑧 = (ℎ̅𝐸𝑔𝑙𝑎𝑠𝑠+ ℎ̅/𝐸𝑆𝑡𝑒𝑒𝑙)−1 (1.3)
ℎ̅ = ℎ𝑔𝑙𝑎𝑠𝑠
ℎ𝑔𝑙𝑎𝑠𝑠+ℎ𝑆𝑡𝑒𝑒𝑙 (1.4)
where 𝐸𝑔𝑙𝑎𝑠𝑠 and 𝐸𝑆𝑡𝑒𝑒𝑙 are the Young’s modulus of glass and Steel, respectively.
6 elastic material. Because all the materials involved presented an elastic stress-strain behavior, the J-integral approach could be applied. The J-integral along a path just outside the failure process zone is given by:
𝐽 = ∫ 𝜎(𝛿𝑛)𝑑𝛿𝑛 𝛿
̃𝑛
0 (1.5)
where 𝛿𝑛 and 𝛿̃𝑛 are the normal opening and normal end-opening of the cohesive zone, respectively, and 𝜎 is the normal traction. When 𝛿̃𝑛 achieves a critical normal end-opening value 𝛿𝑁𝐶, the J-integral reaches a steady state value. Because the J-integral is path independent, the relationship given by Equation (1.5) should yield the same result as equation Equation (1.1) and the entire failure process zone can be described by a cohesive law. Digital images of the normal end-opening 𝛿̃𝑛 yielding the differentiation of Equation (1.5) with respect to 𝛿̃𝑛 as follows:
𝜎(𝛿̃𝑛) = 𝜕𝐽
𝜕𝛿̃𝑛 (1.6)
Thus, the mode 1 traction-separation law was obtained by simultaneously measuring the applied load, which leads to the J-integral calculation, and the normal end-opening displacement 𝛿̃𝑛.
In the case of mode 2 fracture, a modified ARCAN shear mode testing technique40 was adopted. Figure 1.3 shows the loading apparatus and the specimen geometry for the test. The fixture was composed by a circular plate cut into half along the diameter with a square window in the center. Glass-PVB sandwich specimens were glued to the butterfly-shaped coupling by using the same epoxy resin adopted for the DCB tests. Figure 1.3(a), (b), and (c) show, respectively, schematics of the circular grip plate and the loading coupling with the specimen and an optical image of the entire setup.
7 𝐽 = 𝜂 𝐴
𝐵𝑏 (1.7)
where η is a constant that depends on the ratio between the crack length and the specimen
length, A is the area under the local load-displacement curve where the local shear displacement is the one accounted for, B is the specimen out-of-plane width, and b is the length of the uncracked ligament. For a a/W ratio equaling 0.5, the constant η is assumed to be 0.9.
The J-integral evaluation along a path just outside the failure process zone yields the following:
𝐽 = ∫ 𝜎(𝛿𝑡)𝑑𝛿𝑡 𝛿
̃𝑡
0 (1.8)
where 𝛿𝑡 and 𝛿̃𝑡 are the tangential opening and shear end-opening of the cohesive zone, respectively, and 𝜏 is the tangential traction. Differentiating Equation (1.7) with respect to 𝛿𝑡
gives:
𝐽 = 𝜎(𝛿̃𝑡) = 𝜕𝐽
𝜕𝛿̃𝑡 (1.9)
8 Figure 1.1 Schematics of the DCB test configuration and specimen (𝐿 = 240 𝑚𝑚, 𝐵 = 36 𝑚𝑚, 𝑎 = 90 𝑚𝑚, ℎ𝑆𝑡𝑒𝑒𝑙 = 25.4 𝑚𝑚, ℎ𝐺𝑙𝑎𝑠𝑠 = 8 𝑚𝑚, 𝑡𝑃𝑉𝐵 = 0.3 𝑚𝑚).
9 Figure 1.3 Schematics of the modified ARCAN test fixture and shear sample, including (a) the circular grips, (b) the coupling with specimen attachment, and (c) an optical image of the setup mounted in the Instron testing machine. All dimensions are in millimeters.
1.2.2 Test procedures
10 camera, making it possible to monitor the initiation of separation and crack propagation. The analysis of the images taken of the exact end-opening displacement was important in order to quantify the fracture process in terms of traction-separation laws. The adherent deformation for both modes 1 and 2 was considered to be small compared to the bulk deformation of PVB and the separation across the glass-PVB interface. The image analysis took place after the experiments were conducted.
1.3 Results
1.3.1 Mode 1 fracture – experimental
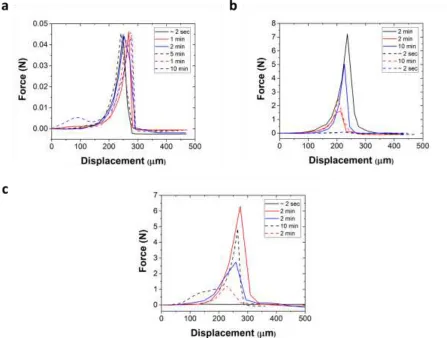
DCB tests were conducted at seven loading rates ranging from 0.01 to 1.8 mm/min. Tests conducted at a speed higher than 1.8 mm/min caused the glass substrate to fracture due to high stress. At least three samples were tested at a given loading rate. For each case, the J-Integral value was recorded along with the end-opening displacement. Figure 1.4(a) shows the increase of the J-integral with respect to the end-opening up to a steady-state value. The curve was then differentiated in order to obtain the traction-separation law. The derivative at a given point was computed by taking the average of the slopes between the points and its two closest neighbors. As the X data (end-opening displacement) was evenly distributed, the derivative curves were accurately smoothed using the Savitzky-Golay method (Figure 1.4(b)).
11 The loading speed considerably affected the traction-separation law for glass-PVB. The peak cohesive stress, which is equivalent to the bond strength, was about 3.1 MPa for the slowest loading rate tested (0.1 mm/min). For the faster rate used (1.8 mm/min), the peak cohesive stress was about 12.6 MPa which is more than four times the value obtained for the first case. There was also an increase in the fracture energy (toughness), that is given by the area under the traction-separation law, with an increase in the loading rate. Figure 1.6(a) and (b) shows the J-integral and traction-separation law curves while Table 1.1 has the important traction-separation law parameters for each loading rate tested.
Figure 1.4 (a) J-integral vs. normal separation curve for the loading rate of 0.3 mm/min − 𝛿𝑛 and
12 Figure 1.5 (a) Side view of the DCB specimen before testing and (b) Side view of the DCB specimen during testing showing the interfacial delamination. (c) Postmortem DCB specimen showing PVB film adhered to one of the substrates.
Figure 1.6 (a) J-integral vs. normal separation curve and (b) normal traction vs. normal separation curves for loading rates ranging from 0.01 to 1.8 mm min.
13 1.3.2 Mode 2 fracture – experimental
As previously mentioned, a modified version of the Arcan configuration34 was used in the mode 2 experiments. The experiment was conducted at several loading rates, ranging from 0.01 to 1.2 mm/min. The application of higher loading rates was precluded by the brittleness of the glass.
The J-integral curves presented the same trend as the one found for the mode 1 fracture regarding the loading rate, as 𝐽 increased with increasing shear end-opening 𝛿𝑡 until reaching a steady-state value. The traction-separation laws were obtained following the same method presented for mode 1 fracture. The crack initiation and propagation were recorded at the same time the test was being carried out. The images in Figure 1.7(a) and (b) shows that the crack propagates at the interface between glass and PVB, which characterizes an adhesive type of failure. This fact was further corroborate by observing that most, if not all, of the PVB film stuck to one of the glass substrates at the end of the test (Figure 1.7(c)).
Like it was seen for mode 1, the loading speed also affected the response of mode 2. As the loading rate increase from 0.01 to 1.2 mm/min, the shear bonding strength ranged from 0.45 to 0.75 MPa. A lower increase if compared to mode 1. In the same way, the fracture energy increased
14 Figure 1.7 (a) Front view of the ARCAN Shear specimen before testing and (b) front view of the ARCAN Shear specimen during testing showing the interfacial delamination. (c) Postmortem ARCAN Shear specimen showing PVB film adhered to one of the substrates.
Figure 1.8 (a) J-integral vs. shear separation curve and (b) shear traction vs. normal separation curves for loading rates ranging from 0.01 to 1.2 mm min.
15 1.3.3 Mode 1 fracture – FEA simulation
A FEA model of the DCB test was carried out in Abaqus 6.14. Cohesive elements were used to model the PVB layer and its constitutive response was given directly in term of traction versus separation. In this manner, the traction-separation laws obtained experimentally were input into the model by means of a user material subroutine (UMAT) written in FORTRAN language. The DCB test was analyzed as a 2D model. Both, glass and Steel, were modeled with 2D structural plane strain elements (8-node biquadratic – CPE8) while PVB was modeled with 2D cohesive elements (4-node – COH2D4). The substrate constitutive properties were assumed to be linear elastic. The Young’s modulus and Poisson’s ratio of Steel were taken as 190 GPa and 0.305, respectively. For glass, a Young’s modulus of 72 GPa and a Poisson’s ratio of 0.23 were adopted. Different loading rates were considered in the simulation. The traction-separation law obtained experimentally was interpolated by a high-order polynomial function, resulting in a equation that relate stress (traction) and strain (separation). This equation could then be input into the UMAT. The subroutine was validated by testing and an one-element model. In order to evaluate the accuracy of the model representation and validate it, the FEA simulated force-extension curves were compared to the ones obtained experimentally. Figure 1.9(a) shows a very good agreement between these results for three different loading rates.
1.3.4 Mode 2 fracture – FEA simulation
16 ratio for glass and Steel are the same values as used in the DCB model. Also, similarly to the mode 1 fracture model, UMAT subroutines were employed in order to input the traction-separation laws obtained experimentally at different loading rates. A good agreement between experiment and simulation force-extension curves were also achieved, as shown in Figure 1.9(b), which validated the mode 2 fracture model.
Figure 1.9 (a) Force-extension curves comparison between experiment and simulation for mode 1 fracture and (b) force-extension curves comparison between experiment and simulation for mode 2 fracture.
1.4 Discussion
The traction-separation law for mode I was obtained at loading rates varying from 0.01 to 1.8 mm/min, while for mode II the loading rates varied from 0.01 to 1.2 mm/min. The range applied
17 The traction-separation laws obtained for both modes 1 and 2 portray a same trend. The fracture energy gradually increases with increasing loading rates. The strength (normal and shear) and the stiffness (slope of ascending curve) of the interface also increases at higher loading rates, which led to the increase in fracture energy. The fracture energy dependency on the loading rate may be attributed to the ductile properties of the PVB adhesive as it changes from visco-elastic to glassy behavior at higher loading rates28.41. In other words, at low loading rates the energy depends only on the work of adhesion, but at higher loading rates the energy is governed by the work of deformation42.
As mentioned previously, an unaided eye inspection of both modes 1 and 2 postmortem specimens revealed that the PVB was almost totally stuck to one of the glass substrates leaving the other one apparently clean. This observation was further corroborated by the postmortem sample analysis under the microscope and because any PVB trace could be identified at the apparently clean glass substrate, more expensive analysis such as FTIR or XPS were not pursued. This characterizes an interfacial rather than cohesive type of failure both modes 1 and 2 fracture occurred at the interface between the glass substrate and PVB, characterizing an interfacial type of failure. In fact, cohesive failure strength of an adhesive is usually higher than the polymer-metal interfacial strength43. Likewise, the smooth surface of the glass substrates contributes to a lower interfacial strength44. Another factor that may contribute to an interfacial failure is due to a surface being excessively basic, since good adhesion bonding usually favors a slightly acidic surface.
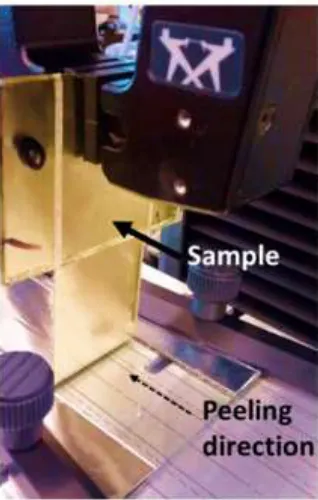
18 rates ranging from 0.01 to 20 mm/min. Although this type of test provides limited information on the interfacial adhesion when compared to the DCB test aforementioned, it does enable the employment of higher loading rates as the glass substrate, placed at the bottom of the testing apparatus shown in Figure 1.10, is not subjected to any loading during the test. In Table 1.3, a similar trend is observed (in 90o peel test experiment) regarding the increase of the fracture energy with the loading rate growth, even though the values obtained at lower loading rates differ from the ones derived from the DCB test. This can be explained by the fact that the peel test may not subject the specimen to a pure mode I state as shear and sliding may be involved during the test. Also, the asymmetry in the material properties of both arms could also contribute to a mixed-mode type of fracture46. Moreover, it was observed PVB residue in both substrates at loading rates higher than 1.8 mm/min, which suggested that the failure may have transitioned to a cohesive type due to the increase in fracture toughness and strength with the loading rate.
The mode II fracture energy reported in the present paper compares well with the values reported by other researchers. Muralidhar et al, 200012 found values between 280 and 930 J/m2 at a fixed loading rate of 1 mm/s. Sha et al, 199747 reported values in the range of 100-300 J/m2 from experiments conducted 8.47x10⁻³ mm/s. Jagota et al, 200010 found values in the range of 150-600 J/m2 for loading rates in the rage of 10-5-100 s-1. Iwasaki et al, 200728 reported a fracture toughness ranging from 400 to 800 J/m2 at loading rates ranging from 1.67x10⁻⁴ m/s to 2.96 m/s. Even though
19 Figure 1.10 (a) Glass-PVB laminate subjected to a peel test.
Table 1.3 Fracture energy values at different peel rates.
1.5 Conclusion
20 characterized in more detail though parameters such as stiffness, normal and shear strength, and fracture energy.
The mode I traction-separation law was achieved by a double cantilever beam test. Chosen by its simple design and ability to provide a pure mode I fracture test, the DCB sample had to have a Steel backing beam attached to it in order to reduce the stress concentration near the crack front in the glass during the test. The fracture energy values obtained in the DCB test compared well with the ones found in peel tests. At the loading rates tested in the DCB tests, the failure occurred at the interface between glass and PVB. However, peels test at higher loading rates revealed the presence of PVB residue in the opposite glass substrates which may characterize a change in failure type from interfacial to cohesive at higher loading rates.
The mode II traction separation law was obtained via a modified ARCAN shear test. This setup was chosen as it’s known to reduce the friction between the specimen elements, which in turn would result in a pure mode II fracture test. Fracture energy values compared reasonably with the ones reported in literature. Similarly to what was found in the mode I tests, the failure occurred at the glass-PVB interface.
Finite element simulations coupled with user material subroutines were able to reproduce similar force-displacement response obtained experimentally. The traction-separation laws could be directly input into the model to make it more precise.
21 Supplementary Information (SI)
1.S1 Failure mode prediction
The failure mode of the glass-PVB samples under certain loading conditions was predicted by FEA using Abaqus 6.14. A three-point bending test was modeled in which a cylinder was used to load a rectangular glass-PVB structure (10 x 5 mm and 3 mm thick) at 0.01 mm/min loading rate. Glass compressive strength was assumed to be 300 MPa and tensile strength to be 30 MPa. Modes 1, 2, and 3 were considered for interfacial failure between glass and PVB. The Mode 1 traction-separation law constants were simply taken from the obtained results at a loading rate of 0.01 mm/min. Modes 2 and 3 traction-separation laws used were bilinear and their constants were
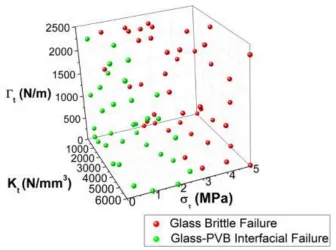
considered to be the same and were varied in order to study the effect of each one on the glass-PVB failure mode. The interfacial shear stiffness (𝐾𝑡), shear strength (𝜎𝑡), and fracture energy (𝛤𝑡) were varied to see which failure mode occurs first: glass breakage or interfacial failure. The result is shown in Figure 1.S1 where the red points in the 3D graph indicate glass brittle failure while the green points correspond to glass-PVB interfacial failure. From the plot, it’s possible to conclude that the variable that most affects the failure mode is the shear strength. This behavior is expected as 𝜎𝑡 greatly controls when interfacial damages starts. A high value of 𝜎𝑡 means that the stress necessary to initiate interfacial damage must be high and the glass-PVB interface can be assumed as perfectly bonded as 𝜎𝑡 increases. In this situation, the glass is more likely to fail first.
Interfacial stiffness and fracture energy have little influence on the failure mode. Low 𝐾𝑡 values
tend to increase the possibility of glass brittle failure due to it causes a lower interfacial stress as it’s less stiff while high 𝛤𝑡 values prompt the same behavior as amount of energy necessary to
22 anyone who wishes to control the damage mode of given structure under certain loading conditions by tailoring its interfacial properties.
23 REFERENCES
1. ASTM C1172 – 14. Standard Specification for Laminated Architectural Flat Glass;
2. Keller, U., & Mortelmans, H., 1999, Adhesion in laminated safety glass–what makes it work. In Glass processing days (Vol. 8, pp. 353-356);
3. Galuppi, L., & Royer-Carfagni, G., 2013, The design of laminated glass under time-dependent loading. Int. J. Mech. Sci., 68, 67-75;
4. Flocker, F. W., & Dharani, L. R., 1997, Stresses in laminated glass subject to low velocity impact. Eng. Struct., 19(10), 851-856;
5. Flocker, F. W., & Dharani, L. R., 1998, Low velocity impact resistance of laminated architectural glass. J. Archit. Eng., 4(1), 12-17;
6. Behr, R. A., Karson, M. J., & Minor, J. E., 1991, Reliability analysis of window glass failure pressure data. Struct. Saf., 11(1), 43-58;
7. Du Bois, P. A., Kolling, S., & Fassnacht, W., 2003, Modelling of safety glass for crash simulation. Comput. Mater. Sci., 28(3-4), 675-683;
8. Timmel, M., Kolling, S., Osterrieder, P., & Du Bois, P. A., 2007, A finite element model for impact simulation with laminated glass. Int. J. Impact Eng., 34(8), 1465-1478;
24 10. Jagota, A., Bennison, S. J., & Smith, C. A., 2000, Analysis of a compressive shear test for adhesion between elastomeric polymers and rigid substrates. Int. J. Fract., 104(2), 105-130;
11. Li, S., Thouless, M. D., Waas, A. M., Schroeder, J. A., & Zavattieri, P. D., 2005, Use of mode-I cohesive-zone models to describe the fracture of an adhesively-bonded polymer-matrix composite. Compos. Sci. Technol., 65(2), 281-293;
12. Muralidhar, S., Jagota, A., Bennison, S. J., & Saigal, S., 2000, Mechanical behaviour in tension of cracked glass bridged by an elastomeric ligament. Acta Mater., 48(18-19), 4577-4588;
13. Delincé, D., Sonck, D., Belis, J., Callewaert, D., & Van Impe, R., 2008, Experimental investigation of the local bridging behaviour of the interlayer in broken laminated glass. In International Symposium on the Application of Architectural Glass ISAAG 2008 Conference Proceedings, Munich, October 27-28, 2008 (pp. 41-49);
14. Bati, S. B., Fagone, M., & Ranocchiai, G., 2009, Analysis of the post-crack behaviour of a laminated glass beam. Glass Performance Days 2009, 349-352;
15. Ferretti, D., Rossi, M., & Royer-Carfagni, G., 2012, Through-cracked-tensile delamination tests with photoelastic measurements. Challenging Glass, 3, 641-652;
16. Butchart, C., & Overend, M., 2012, Delamination in fractured laminated glass. In engineered transparency international conference at glasstec (pp. 249-257);
25 18. Dugdale, D. S., 1960, Yielding of steel sheets containing slits. J. Mech. Phys. Solids, 8(2),
100-104;
19. Needleman, A., 1987, A continuum model for void nucleation by inclusion debonding. J. Appl. Mech., 54(3), 525-531;
20. Needleman, A., 1990, An analysis of tensile decohesion along an interface. J. Mech. Phys. Solids, 38(3), 289-324;
21. Tvergaard, V., & Hutchinson, J. W., 1993, The influence of plasticity on mixed mode interface toughness. J. Mech. Phys. Solids, 41(6), 1119-1135;
22. Tvergaard, V., & Hutchinson, J. W., 1994, Toughness of an interface along a thin ductile layer joining elastic solids. Philos. Mag. A, 70(4), 641-656;
23. Roe, K. L., & Siegmund, T., 2003, An irreversible cohesive zone model for interface fatigue crack growth simulation. Eng. Fract. Mech., 70(2), 209-232;
24. Yang, B., Mall, S., & Ravi-Chandar, K., 2001, A cohesive zone model for fatigue crack growth in quasibrittle materials. Int. J. Solids Struct., 38(22-23), 3927-3944;
25. Li, H., & Chandra, N., 2003, Analysis of crack growth and crack-tip plasticity in ductile materials using cohesive zone models. Int. J. Plast., 19(6), 849-882;
26. Yang, Q., & Cox, B., 2005, Cohesive models for damage evolution in laminated composites. Int. J. Fract., 133(2), 107-137;
26 28. Iwasaki, R., Sato, C., Latailladeand, J. L., & Viot, P., 2007, Experimental study on the interface fracture toughness of PVB (polyvinyl butyral)/glass at high strain rates. Int. J. Crashworthiness, 12(3), 293-298;
29. Karac, A., Blackman, B. R. K., Cooper, V., Kinloch, A. J., Sanchez, S. R., Teo, W. S., & Ivankovic, A., 2011, Modelling the fracture behaviour of adhesively-bonded joints as a function of test rate. Eng. Fract. Mech., 78(6), 973-989;
30. Rosa, A. L., Yu, R. C., Ruiz, G., Saucedo, L., & Sousa, J. L. A. O., 2012, A loading rate dependent cohesive model for concrete fracture. Eng. Fract. Mech., 82, 195-208;
31. Mello, A. W., & Liechti, K. M., 2006, The effect of self-assembled monolayers on interfacial fracture. J. Appl. Mech., 73(5), 860-870;
32. Banea, M. D., Da Silva, L. F. M., & Campilho, R. D. S. G., 2011, Mode I fracture toughness of adhesively bonded joints as a function of temperature: experimental and numerical study. Int. J. Adhes Adhes, 31(5), 273-279;
33. Sorensen, L., Botsis, J., Gmür, T., & Humbert, L., 2008, Bridging tractions in mode I delamination: Measurements and simulations. Compos. Sci. Technol., 68(12), 2350-2358;
34. Zhu, Y., Liechti, K. M., & Ravi-Chandar, K., 2009, Direct extraction of rate-dependent traction–separation laws for polyurea/steel interfaces. Int. J. Solids Struct., 46(1), 31-51;
27 36. Gowrishankar, S., Mei, H., Liechti, K. M., & Huang, R., 2012, A comparison of direct and iterative methods for determining traction-separation relations. Int. J. Fract., 177(2), 109-128;
37. Azo Materials, 2001. Retrieved September 29, 2017, from https://www.azom.com/properties.aspx?ArticleID=89
38. Shokrieh, M. M., & Heidari-Rarani, M., 2011, A comparative study for beams on elastic foundation models to analysis of mode-I delamination in DCB specimens. Struct. Eng. Mech., 37(2), 149-162;
39. Tsai, S., 2018, Introduction to composite materials. Routledge;
40. Banks-Sills, L., & Sherman, D., 1991, J II fracture testing of a plastically deforming material. Int. J. Fract., 50(1), 15-26;
41. Yamagata, Y., Lu, X., Sekiguchi, Y., & Sato, C., 2017, Experimental investigation of mode I fracture energy of adhesively bonded joints under impact loading conditions. Appl. Adhes. Sci., 5(1), 7;
42. Benedek, I., 2004, Pressure-sensitive adhesives and applications. CRC Press;
43. Yao, Q., & Qu, J., 2002, Interfacial versus cohesive failure on polymer-metal interfaces in electronic packaging—effects of interface roughness. J. Electron. Packag., 124(2), 127-134;
44. von Fraunhofer, J. A., 2012, Adhesion and cohesion. Int. J. Dent., 2012;
28 46. Padhye, N., Parks, D. M., Slocum, A. H., & Trout, B. L., 2016, Enhancing the performance of the T-peel test for thin and flexible adhered laminates. Rev. Sci. Instrum., 87(8), 085111;
29 CHAPTER 2 Study of stress transfer between SiNW and PDMS COMPOSITE
2.1 Introduction
In recent years, one-dimensional nanomaterials have received great attention mainly because of their outstanding length-scale dependency on the mechanical properties. One-dimensional structures including nanowires (NWs) have been employed as building blocks in composite materials used in several applications1-4. Transparent devices combining excellent electrical performance with high flexibility have relied on metal NWs as an alternative to ITO5-6. Based on the increased need for electronic devices to be used in conformity with the human skin, not only flexible but stretchable structures have to be designed. Carbon nanotubes (CNTs) and nanowires are among the materials that have been increasingly used in such structures7-8 and, especially, Si NWs have been widely explored for stretchable electronics9-11. CNTs have been commonly used in nanocomposite structures in order to enhance their mechanical and other multifunctional properties12-13, while crystalline NWs, known by their exceptional mechanical properties14, are also being incorporated in highly conductive and stretchable nanocomposite conductors15. As nanostructures including NWs can endure a higher level of elastic strain when compared to their bulk counterparts, they are being used to adjust the fundamental properties of semiconductor materials in what is called elastic strain engineering. So far, the methods being used to introduce strain in the NW includes buckling9 or bending16 it on a stretchable substrate and stretching17 a freestanding NW.
31 The experimental methods aforementioned require either the 1D material to be directly loaded or that it breaks in the case of fragmentation measurement. Shear-lag models have been employed to quantify the shear stress transfer between graphene and substrate40-41. Such an analysis approach can be extended to NWs and substrate as well. In this paper, we present the study of the interfacial shear stress transfer between a single SiNW and PDMS COMPOSITE in tension using nonlinear and cohesive shear-lag models. The experimental method conducted in AFM, which consists of applying a tensile strain to the PDMS COMPOSITE with Si NWs on its top, has already been successfully employed to analyze the interface interactions between a 2D nanomaterial (monolayer graphene) and an elastomeric substrate (PET)41. Different cohesive law models were used to analyze two different cases: untreated PDMS COMPOSITE and 45 min. UVO-treated PDMS COMPOSITE. FEA was used to quantify the interface parameters, mainly interfacial shear strength and fracture energy, by fitting the average strain in the NW from the experiments. Strain distribution on the NW were provided by both FEA and analytical solutions. The cohesive models adopted were also used to study the case when the SiNW is tilted with respect to the direction of applied strain on the PDMS COMPOSITE substrate via parametric study. Moreover, a parametric study was conducted in order to predict the fracture of the SiNWs with different lengths and diameters, which could provide some guideline for future applications of this nanomaterial.
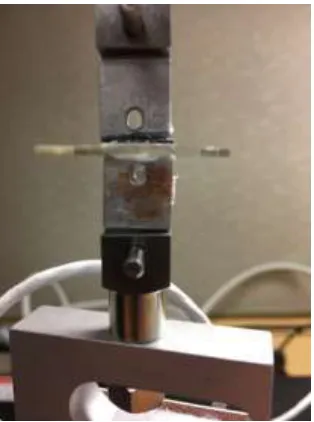
2.2 Experimental setup
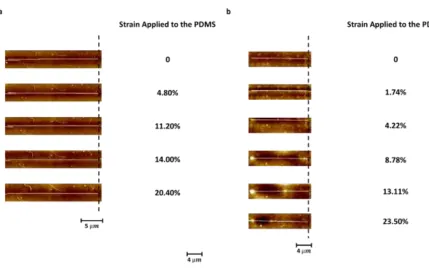
32 horizontal SiNW could be chosen for each case. In both cases, the SiNW chosen to be analyzed had a diameter of approximately 20 nm. The SiNW on top of the nontreated PDMS COMPOSITE sample had a length of about 22.40 µm while the length of the SiNW that was on top of the UVO-treated sample was about 16.40 µm. The stretching experiments were conducted under AFM microscope where an uniaxial tensile load was applied to PDMS COMPOSITE at a constant strain rate. The average strain on the nanowire was measured in ImageJ with the images obtained from Raman spectroscopy. Figure 2.1 shows that for the nontreated sample, five different strain levels applied to PDMS COMPOSITE were recorded (from 0 to 20.4%) while for the UVO-treated sample, six different strain levels were recorded (from 0 to 23.5%).
33 2.3 Theoretical analysis
2.3.1 Nonlinear shear-lag model
Based on information gathered in experiments, a PDMS COMPOSITE substrate that has not been UVO-treated bonds with the SiNW only through van der Walls interactions. The nonlinear shear-lag analysis was used to study this case. When uniaxial tension is applied to the substrate, the SiNW first deforms concurrently with the substrate due to the interfacial shear stress transfer. Once the interfacial stress reaches a critical value, the SiNW may slide along the interface. Taking advantage of the symmetry of the problem, only half of the NW/substrate system in the horizontal (x) direction is considered. The SiNW has a half-length L in the x-direction with x = 0 at the center of the NW. SiNWs with a diameter of 20 nm has a Young’s modulus of 𝐸𝑁𝑊 (=
120 𝐺𝑃𝑎), so its constitutive equation can be given as 𝜎 = 𝐸𝑁𝑊𝜀, where 𝜎 and 𝜀 denote the axial
stress and strain in the SiNW, respectively.
More details on the derivation of the equations are provided elsewhere40. Based on the early shear-lag model developed by Cox42 for a fiber embedded in a matrix, the equilibrium equation between the axial stress in the SiNW on top of PDMS COMPOSITE and the interfacial shear stress between them can be calculated as follows:
(3√3
2 𝑎 2) 𝜎
𝑓+ (𝑎𝑑𝑥)𝜏 = (3√32 𝑎2) (𝜎𝑓+ 𝑑𝜎𝑓) (2.1)
The contact width between SiNW and PDMS COMPOSITE was estimated43 as the side length of the hexagonal cross section44-45 of the SiNW. The indentation depth was found to be negligible46. Reducing Equation (2.1) with respect to 𝑑𝑥 the following relation is obtained.
𝑑𝜎𝑓 𝑑𝑥 =
2𝜏
3√3𝑎 (2.2)
34 Finally, the relation between shear stress with sliding displacement can be found to be
𝜏 = 𝐸𝑁𝑊(𝜆) 𝑑2𝛿
𝑑𝑥2 (2.3)
where 𝜆 = 3√3𝑅
2𝜋 .
As the applied displacement in the first stage is relatively small, the sliding displacement in the entire SiNW is smaller than the critical sliding displacement (𝛿𝑖), which characterizes the
SiNW/substrate interface as perfectly bonded. Knowing that the shear traction (𝜏) is linearly related to the sliding displacement (𝛿) by a stiffness constant (𝐾0), Equation (2.3) yields the following ordinary differential equation:
𝑑2𝜎 𝑑𝑥2 =
𝐾0
𝐸𝑁𝑊(𝜆)𝛿 (2.4)
Applying the pertinent boundary conditions, Equation 2.4 can be solved and the axial strain in the SiNW is obtained as
𝜀 = 𝜀𝑚(1 −cosh(𝛽𝑥)
cosh(𝛽𝐿)) (2.5)
where 𝛽 = √𝐾0⁄𝐸𝑁𝑊(𝜆) is the shear-lag parameter.
The maximum shear stress occurs at the ends of the SiNW (𝑥 = ±𝐿) with the magnitude 𝜏𝑚𝑎𝑥 = 𝛽𝐸𝑁𝑊(𝜆)𝜀𝑚tanh (𝛽𝐿) (2.6)
Interface sliding between SiNW and substrate occurs when the maximum interfacial shear stress equals a critical value (𝜏𝑚𝑎𝑥 = 𝜏𝑐). The critical strain for onset of sliding is thus
𝜀𝑐 = 𝜏𝑐
𝛽𝐸𝑁𝑊(𝜆)coth (𝛽𝐿) (2.7)
35 𝜎 = ±𝜏𝑐(𝑥 ± 𝐿) (2.8)
In the no-sliding zone (|𝑥| < 𝐿 − 𝑠), the stresses are
𝜏 = 𝐴𝑠𝑖𝑛ℎ(𝛽𝑥) (2.9)
𝜎 = 𝐸𝑁𝑊(𝜆)𝜀𝑚+ 𝐴𝑐𝑜𝑠ℎ(𝛽𝑥)/𝛽 (2.10)
The term 𝐴 can be found by requiring the shear stress to be continuous at 𝑥 = ±(𝐿 − 𝑠). Finally, an equation for the sliding zone size 𝑠 can be obtained by requiring the axial force in SiNW to be continuous at 𝑥 = ±(𝐿 − 𝑠)
coth[𝛽(𝐿 − 𝑠)] + 𝛽𝑠 =𝛽𝐸𝑁𝑊(𝜆)𝜀𝑚
𝜏𝑐 (2.11)
Equation (2.11) can then be applied to calculate the sliding zone size 𝑠 once 𝜀𝑚 > 𝜀𝑐.
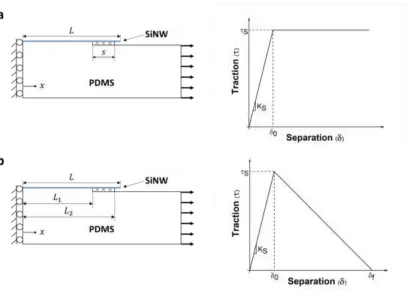
Once 𝑠 is known, the shear stress at the interface and the axial force in the SiNW can be calculated from Equations (2.9)-(2.10). Figure 2.2(a) shows the interfacial phases (bonded and damaged) that arise when the nontreated PDMS COMPOSITE is further stretched. The traction-separation law used for this case is also shown.
2.3.2 Integrated cohesive zone model with shear-lag analysis
36 Again, further details about the derivation of the equations were published elsewhere41. As mentioned before, when the substrate is stretched in the uniaxial direction, the sliding displacement increases between SiNW and substrate. In this analysis, it’s assumed that shear stress, after the initial linear increase, will decrease linearly till vanishing according to the bilinear cohesive zone model. Hence, it’s possible to characterize three stages of the interface behavior: first part – bonded (0 < 𝑥 < 𝐿1), second part – damaged (𝐿1 < 𝑥 < 𝐿2), and third part – debonded (𝐿2 < 𝑥 < 𝐿).
The analysis of the first stage when SiNW and substrate are perfectly bonded is identical to the one presented at the nonlinear shear-lag model and calculated by Equations (2.3)-(2.6). As the applied strain increases, sliding starts to occur from the edges of the SiNW dividing the interface into two parts. The axial strain in the bonded part can be obtained as
𝜀 = 𝜀𝑚− 𝛿𝑖𝛽 cosh (𝛽𝑥)
sinh (𝛽𝐿1) (2.12)
where here again 𝛽 = √𝐾0⁄𝐸𝑁𝑊(𝜆). In the second stage, the sliding displacement exceeds 𝛿𝑖 causing damage at the interface. The axial strain in the damaged part takes the form of
𝜀 = 𝜀𝑚+ 𝐴𝛼 sin(𝛼(𝑥 − 𝐿1)) − 𝐵𝛼cos (𝛼(𝑥 − 𝐿1)) (2.13)
where 𝛼 = √𝜏𝑚𝑎𝑥⁄(𝐸𝑁𝑊(𝜆)(𝛿𝑓− 𝛿𝑖)).
By applying the pertinent boundary conditions, both the critical value for 𝐿1 (𝐿1𝑐) and the
37 Figure 2.2 SiNW/PDMS COMPOSITE interfacial phases and traction-separation laws for (a) nontreated PDMS COMPOSITE and (b) 45 min UVO treated PDMS COMPOSITE.
2.3.3 Mechanism of NW Alignment
As previously reported, the motion of the SiNW placed on top of the PDMS COMPOSITE substrate under tensile strain can be attributed to geometric compatibility with the substrate and the static friction between NW and substrate51. An schematic showing the mechanism of NW alignment is shown in Figure 2.3. Assuming a NW with initial length 𝐿0 and skew angle 𝜃0, the width, height and area of the rectangle bounding the NW are 𝐿0𝑠𝑖𝑛𝜃0, 𝐿0𝑐𝑜𝑠𝜃0, and 𝐴0 = 𝐿20 𝑠𝑖𝑛𝜃
0𝑐𝑜𝑠𝜃0, respectively. When the strain is released, assuming linear elasticity, the width,
height, and area of the rectangle change to 𝐿0𝑠𝑖𝑛𝜃0⁄(1 + 𝜀𝑝𝑟𝑒), 𝐿0𝑐𝑜𝑠𝜃0⁄(1 − 𝜐𝜀𝑝𝑟𝑒), and 𝐴1 = 𝐴0⁄((1 + 𝜀𝑝𝑟𝑒)(1 − 𝜐𝜀𝑝𝑟𝑒)), respectively, where 𝜀𝑝𝑟𝑒 is the strain and 𝜐 is the Poisson's
38 COMPOSITE as the static friction is not large enough to hold the axial strain. NW sliding may affect differently the strain in the NW depending on which initial angle the NW is placed. Instead of assuming a perfect bond between SiNW and PDMS COMPOSITE, the analysis described previously (nonlinear and cohesive shear-lag analysis) can be employed to model the interface between the two structures. Also, varying interface parameters helps better understand how the model works when the NW is at different angles.
Figure 2.3 Schematics showing the mechanism of NW alignment: (a) a NW transferred to a strained PDMS COMPOSITE with a rectangle of PDMS COMPOSITE bounding the NW; (b) the NW position after release of strained PDMS COMPOSITE, which is analogous to a longitudinal compressive displacement.
2.4 FEA model
39 PDMS COMPOSITE with and without UVO treatment, was carried out in a similar way. Only half of the PDMS COMPOSITE/SiNW system was considered by taking advantage of the symmetry of the problem in the horizontal direction as can be seen in Figure 2.2. The SiNW was modeled with hexagonal cross-section44-45 and having one of its faces in contact with PDMS COMPOSITE. C3D8R reduced linear brick elements were used to model PDMS COMPOSITE and SiNW. It was adopted an isotropic linear elastic material behavior for both structures. Young’s modulus of 120 GPa and Poisson ratio of 0.3 was used for the SiNW44. For the PDMS COMPOSITE substrate, it was assigned a Young’s modulus of 2 MPa and a Poisson ratio of 0.4852. To be consistent, the SiNW dimensions were chosen to be the same as in the experiments. The diameter of the SiNW for both cases was set as 20 nm. The nontreated SiNW length used was 22.40 µm while the UVO treated had a length of 16.40 µm. The interfacial shear stress is
responsible for transferring the effect of uniaxial loading applied to the PDMS COMPOSITE substrate to the SiNW and with the model developed, it’s possible to evaluate the mode II fracture toughness and the strain distribution along the SiNW. The interface between SiNW and PDMS COMPOSITE was modeled using cohesive contact properties given in terms of a bilinear traction-separation law, which parameters were obtained through comparison with experiment results.
40 law between an UVO-treated PDMS COMPOSITE and SiNW as can be seen by the linear decrease in traction to zero after its maximum value due to the irreversible breaking of some of the interfacial chemical bonds. In this case, not only the shear strength 𝜏𝑚𝑎𝑥 but also the fracture toughness 𝐺𝐶, which is given by the area under the traction-separation plot, must be obtained. Eventually both, the SiNW average strain and the strain distribution along the SiNW obtained by FEA were compared to experimental and analytical results, respectively.
In order to study the effect of the interface properties for SiNW at different angles, a 3D finite element analysis using the same software was employed. The schematic of the model was shown in Figure 2.3. The SiNW was placed on top of the PDMS COMPOSITE substrate at several different angles with respect to the PDMS COMPOSITE stretching direction while a compressive strain was applied in the transverse direction resulting in 80% substrate stretch in the longitudinal direction. The angles studied varied from 0 to 90ᵒ equally spaced by 5°. C3D8R brick elements were used to model PDMS COMPOSITE and SiNW. The material properties adopted for PDMS COMPOSITE and SiNW were the same as for the previous model. The diameter of the SiNW was 20 nm while the length was 10 µm. Similarly, the interface between SiNW and PDMS
COMPOSITE was modeled using cohesive contact properties given in terms of a bilinear traction-separation law. Both laws described previously were tested and its respective parameters were varied in order to study its effect.
2.5 Results and discussion
41 to the simple Coulomb friction law applied by Snozzi and Molinari54 and recently by Nian et al55 for fiber-reinforced composites.
When it comes to the traction-separation law used for the case of UVO-treated PDMS COMPOSITE (Figure 2.2(b)), it’s possible to see that although the shear strength value is higher than nontreated PDMS COMPOSITE case because of the strong nature of the chemical reactions, the traction decreases as it passes that point. This bilinear model of traction-separation law was first presented by Geubelle and Baylor56 and applied in the study of delamination in composites cause by impact. This relationship is already implemented in Abaqus. For the chemical bonding type of interface, there have been studies showing softening at the traction-separation laws obtained through interfacial shear tests or molecular dynamics (MD) shear simulations.
MD simulations have been widely used in order to obtain the traction-separation law for a range of different interfaces. Dandekar et al57 used this method to describe the Al-SiC interface mechanics. This type of material, which is called metal matrix composite material, is characterized by the formation of a chemical bond between the reinforcement and molten metal. Chemical bonding occurs when the atoms of matrix and reinforcement are in direct contact and is accomplished by exchange of electrons. This type of bonding can be metallic, ionic or covalent57,58. Rahman and Haque59 characterized the interface between crosslinked graphene and epoxy through molecular mechanics and molecular dynamics simulations. The research shows a considerable increase in the interfacial strength by chemical bonding.
42 curve for the chemically bonded interface clearly shows a softening region after the traction strength is reached. Bianchi and Zhang62 developed a cohesive zone model to describe the shear delamination resistance of z-pin reinforcements in a double cantilever beam sample. The cohesion between the z-pins and the DCB matrix is due to interfacial chemical bonding.
43 without the necessity of them being charged. Even though a non-polar atom has a zero average dipole moment, the constant movement of the electrons around its nuclear protons may create an instantaneous dipole moment. This instantaneous dipole generates an electric field that polarizes any nearby atom, inducing a dipole moment in it. The interaction between the two dipoles gives rise to an instantaneous attractive force between the two atoms. Dispersion forces are relatively weak and depends only on the distance between the atoms to occur63.
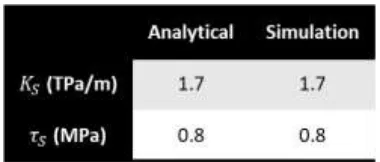
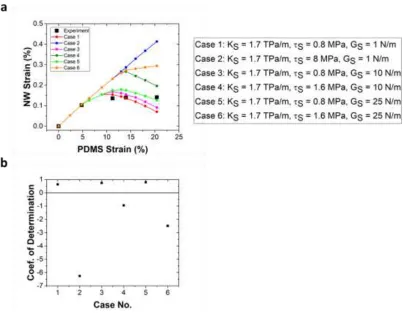
44 Based on the SiNW average strains, interface parameters were found for each case. Tables 2.1 and 2.2 show the interface parameters that best fit the experimental results for the nontreated and UVO-treated PDMS COMPOSITE, respectively. The FEA results agreed very well with the analytical case when it’s assumed that only one side of the SiNW touches the substrate. The interface stiffness value for the UVO-treated PDMS COMPOSITE is higher when compared to the nontreated as the static friction increases due to hydrophobic-to-hydrophilic conversion of the PDMS COMPOSITE surface under UVO treatment18. As discussed before, the UVO-treated PDMS COMPOSITE also presented a higher shear strength value due to the stronger nature of the chemical bonding that takes place between SiNW and PDMS COMPOSITE18.