ABSTRACT
Freese, Robert Carl. Soil Development in Created Salt Marshes, Its Spatial Patterns, and Implications for Subsurface Water Flow. (Under the direction of Stephen W. Broome). We examined soil development trends in a 28-year chronosequence of created salt marshes. Our objective was to determine whether created marshes reach ecological equivalence with natural marshes. Therefore, we studied soil properties that are likely indicators for ecological function. Marsh age is a good predictor of soil carbon and nitrogen levels, bulk density, macro-organic matter dry weight and nitrogen content of the 0 to 10 cm soil depth. Levels equivalent to the average natural marsh are predicted to occur within 22 years. Soil textural changes occur more slowly and are less closely predicted by marsh age. The 10 to 30 cm soil depth of created marshes does not change much with time and does not become equivalent to natural marshes within the time frame of this study.
We examined spatial patterns by comparing soil properties 1 m inland from the marsh edge with soil properties 15 m inland. There were no significant differences in the 4-year old marsh but the 11- and 29-year old marshes had higher levels of soil carbon and nitrogen, silt, clay, porosity at the 1 m position than at the 15 m position. Geomorphologic characteristics of created marshes appear to account for this trend. The 29-year old marsh has a gradient in soil morphology and classification from a weakly developed Typic Psammaquent soil 30 m from marsh edge to a Mollic Psammaquent at 15 m to a Mollic Endoaquent at 1 m.
Reshaping created marshes to more closely resemble natural marshes would likely enhance soil development and ecological function of the inland part of these marshes.
SOIL DEVELOPMENT IN CREATED SALT MARSHES, ITS SPATIAL PATTERNS, AND IMPLICATIONS FOR SUBSURFACE WATER FLOW
by
Robert C. Freese
A dissertation submitted to the Graduate Faculty of North Carolina State University
In partial fulfillment of the Requirements for the degree of
Doctor of Philosophy
DEPARTMENT OF SOIL SCIENCE RALEIGH
2003
APPROVED BY:
____________________ _____________________
Aziz Amoozegar Theodore H. Shear
____________________ _____________________ Michael J. Vepraskas Stephen W. Broome
BIOGRAPHY
I was born in Worcester, Massachusetts on August 26, 1962. After high school, I vowed never to take another math or science class again. So as an undergraduate, I devoted myself to the study of humanities and social sciences and earned a Bachelor of Arts degree from Vassar College with a major in Anthropology. After living in New York City for several months, I longed to be outdoors and to understand the natural world better. Soil had long intrigued me for its ability to sustain life and human society and it seemed like a worthy subject of study. So in 1985, I moved to North Carolina, took classes and worked in various jobs until I was admitted to the Masters program in Soil Science at N.C. State University. There I studied the effects of tillage methods on infiltration and related soil physical properties. Afterwards, I mapped soil with SCS (now NRCS), mostly in the Piedmont and Coastal Plain of North Carolina. The patterns of soil on the landscape fascinated me for their effects on vegetation and land use and I found that work very satisfying and enjoyable. However, I wanted to see more of the world and to put my knowledge to greater use. So I volunteered with the U.S. Peace Corps in Thailand and worked as a Soil Conservation Extension Agent, an experience both satisfying and frustrating. I returned to work as a Soil Survey Project Leader in Duplin County, NC. Delineation of wetlands became a large part of my job and wetland restoration appealed to my desire to create a more harmonious relationship between our society and the natural world. I returned to graduate school in Soil Science at NCSU in 1998 but this time with a focus on salt marsh restoration under the direction of Dr. Stephen Broome. Upon completion of my Ph.D., I accepted a position with A.F. Clewell, Inc. restoring mined phosphate land in the Tampa, FL area.
ACKNOWLEDGEMENTS
I’d like to thank the chairman of my program committee, Dr. Stephen Broome, for his support in this project and for his patience in allowing me the time and freedom to explore the many intriguing aspects of salt marsh ecology, regardless of whether they were directly useful to me. It has been a satisfying process! I’d like to thank Dr. Ted Shear for inspiring me to pursue a career in restoration ecology, for his advice and input at various points in my program, and for his ability to see implications beyond a narrow frame of study. Dr. Michael Vepraskas has inspired me with his willingness to speak his mind and argue with others when it’s something important. His advice on organization and interpretation of data were helpful in framing my study. Dr. Aziz Amoozegar has inspired me with his thorough, meticulous analysis of soil physical processes and he has helped me at several points in my handling of hydrologic data.
I’d like to thank Dr. Chris Craft for securing funding for this project and for his advice and encouragement over the past four years. Roberta Miller-Haraway helped me become computer literate and her help was essential in preparing many of my graphics. Dr. Marcia Gumpertz has been very helpful and patient with my many questions on statistical analysis and interpretation. Carleton Campbell was of great help in collection of field data and operation of the boat. I’d like to thank Andy Knapp, Ross Andrews, Eric Severson for their labor in the field, their companionship, and for reminding me not to take anything too seriously.
This research was supported by a grant from the U.S. Environmental Protection Agency’s Science To Achieve Results (STAR) program through grant #8261111-01-0. Although the reseach described in this document has been funded wholly or in part by the
U.S. Environmental Protection Agency’s Science To Achieve Results (STAR) program through grant #8261111-01-0, it has not been subjected to any EPA review and therefore does not necessarily reflect the views of the Agency, and no official endorsement should be inferred.
TABLE OF CONTENTS page
List of Tables ……….………. viii
List of Figures ………. x
1. Soil Development in a Chronosequence of Created Salt Marshes. Abstract ……….…. 1
Introduction ………. 2
Objectives ………..…. 4
Materials and Methods ……….. …. 5
Statistical Analysis ……….…. 6
Results ………. 7
Soil Properties ………. 7
Macro-organic Matter Properties ……….. …. 13
Carbon/ Nitrogen Ratio Trends ………. …. 15
Discussion ………. …. 16
References ……….…. 18
Tables ………. 21
Discussion ………. …. 24
2. Spatial Patterns of Soil and Vegetation in Created Spartina Alterniflora Loisel Marshes. Abstract………..…. 31
Introduction ………. 32
Materials and Methods ………..…. 36
Statistical Analysis ………..…. 39
Results ………. 40
Comparison of Edge and Inland Positions for Each Marsh ………. 40
The Single Natural Marsh ……….…. 40
The 4-year old DOT Marsh ……….…..…. 41
The 11-year old Port Marsh ……….. …. 41
Comparison of Properties of the Composite Natural Reference Marsh with those of the Edge and Inland Positions from
Created Marshes ……….…….…. 43
Soil Nutrient Pools……….…. 43
Soil Texture ………..…. 45
MOM-N, -C/N, -P ………. …. 45
Soil Bulk Density and MOM Dry Weight ……… …. 46
Soil Morphology and Classification of Salt Marsh Soils …………. 47
The Single Natural Marsh ……….…. 47
The 4-year old DOT Marsh ………..…. 49
The 11-year old Port Marsh ……….….…. 50
The 29-year old Marine Lab Marsh ……….…. …. 52
Geomorphology ………. 54
The Single Natural Marsh ……….………. 54
The 4-year old DOT Marsh ………..…. 55
The Port and Marine Lab Marshes ..……….…. …. 56
Discussion ……….…. 57
References ………. …. 62
Tables ……….……. 65
Figures ………. 71
3. Hydrologic Patterns in Created and Natural Salt Marshes. Abstract ………. …. 78
Introduction………. 79
Materials and Methods ……….…. 83
Sites ……….…. 83
Water Table Monitoring Wells and Hydraulic Gradients …………. 83
Soil Water Flux ………. 86
Piezometers and Pore Water Sampling ………. 87
Drainage Volume and Nutrient Export Determinations ………..…. 87
Results ………. 89
Water Table Fluctuations and Hydraulic Gradients ………. 89
The Natural Marsh ……….…. 89
The Created DOT Marsh ………. 91
The Created Port Marsh ……….…. 95
The Created Marine Lab Marsh ……….…. 96
Soil Water Flux ………. 97
Drainage Volume on Selected Tidal Cycles ………. 98
Nutrient Export ………. 99
Discussion ……….…. 101
References ……….…. 104
Tables ………. 105
Figures ………..…. 110
LIST OF TABLES page Table 1-1. Relationship of ecological functions with potential soil indicators …… 21 Table 1-2. Site characteristics of created and natural
Spartina alterniflora marshes………. 22 Table 1-3. Comparison of the results of three methods to estimate years
required for created marshes to become equivalent to natural marshes ……… 23 Table 2-1. Some characteristics of study marshes and positions within marshes …. 65 Table 2-2. Means and standard errors (SE) for soil properties
of Natural marsh………. 66
Table 2-3. Means and standard errors (SE) for soil properties of DOT marsh……. 67 Table 2-4. Means and standard errors (SE) for soil properties of Port marsh……… 68 Table 2-5. Means and standard errors (SE) for soil properties
of Marine Lab marsh……….. 69
Table 2-6. Comparison of foliar characteristics between positions in 4 marshes…. 70 Table 2-7. Redox potential at positions in three marshes……….. 70 Table 3-1. Characteristics of selected tidal cycles……… 105 Table 3-2. Maximum water table depth (WTD) below marsh surface (cm)
and discharge volume ……… 105
Table 3-3. Mean nutrient concentration (mg l-1) in pore water samples
taken in April 2001………. 106
Table 3-4. Mean nutrient concentration (mg l-1) in pore water samples
taken in August 2000………. 107
Table 3-5. Mean nutrient concentration (mg l-1) in pore water samples
taken in November 2000………. 108 Table 3-6. Carbon, Nitrogen and Phosphorous Pools (g m-2) in the 0-30 cm
depth of three Marshes……… 109 Table 3-7. Total Carbon, Nitrogen and Phosphorous exported from two
marshes on an annual basis expressed as a percent of the total C, N, P
Table A-1. Maximum water table drop (cm) below soil surface on
selected dates……….… 125
Table A-2. Sample calculation of soil water profile………. 125 Table B-1. Hourly averages of hydraulic head used to calculate
lateral discharge………. 127
LIST OF FIGURES
Figure 1-1. Locations of study sites……… 24 Figure 1-2. Trends in mean (+ SE) soil carbon (a-c), nitrogen (d-f),
and phosphorous (g-i) content with age of created marshes……… 26
Figure 1-3. Trends in mean (+ SE) sand (a, b), silt (c, d), and
clay (e, f) contents with age of created marshes. ……… 27
Figure 1-4. Trends in bulk density (a, b), and MOM dry weight (c, d)
with age of created marshes……… 28
Figure 1-5. Trends in MOM nitrogen and phosphorous content with age
of created marshes……… 29
Figure 1-6. Trends in MOM C/N ratio (a) and soil C/N ratio (b)
of 0-10 cm layer……… 30
Figure 2-1. Locations of four study marshes……… 71 Figure 2-2. Upper confidence intervals (UCI) for soil C,N,P of
three created marshes relative to the lower confidence interval (LCI)
of the composite natural marsh……… 72
Figure 2-3. Lower/ upper Confidence Intervals (LCI/ UCI) for mean sand, silt, clay of created marshes relative to LCI/ UCI
for composite natural marsh……… 73 Figure 2-4. Upper/ lower confidence intervals for MOM-N, C/N, P of
created marshes relative to LCI/ UCI of composite natural marsh. ……….. 74 Figure 2-5. Lower/ upper confidence intervals for bulk density
and MOM dry weight of created marshes relative to upper/ lower
confidence interval of composite natural marsh ……… 75 Figure 2-6. Overlay of contour and surface maps for study site
in Natural marsh……… 76
Figure 2-7. Overlay of contour and surface maps for study site
in DOT marsh……… 76
Figure 2-8. Overlay of contour and surface maps for study site
in Port marsh ………. 77
Figure 2-9. Overlay of contour and surface maps for study site
in Marine Lab marsh ……… 77
Figure 3-1. High and Low Tide Levels during
first Monitoring Period (3/16/00 - 4/18/00) ……… 110 Figure 3-2. Water Levels (a) and Hydraulic Gradients (b)
in Natural Marsh on March 20, 2000 Tidal Cyle……… 111 Figure 3-3. Water Levels (a) and Hydraulic Gradients (b)
in Natural Marsh on April 12-13 Tidal Cycle……… 112 Figure 3-4. Water Levels (a) and Hydraulic Gradients (b)
in Natural Marsh on June 13 Tidal Cycle……… 113
Figure 3-5. Water Levels (a) and Hydraulic Gradients (b)
in Natural Marsh on July 1 Tidal Cycle……….. 114 Figure 3-6. Water Levels (a) and Hydraulic Gradients (b)
in DOT Marsh on March 20, 2000 Tidal Cyle……… 115 Figure 3-7. Water Levels (a) and Hydraulic Gradients (b)
in DOT Marsh on April 12-13 Tidal Cycle……… 116 Figure 3-8. Water Levels (a) and Hydraulic Gradients (b)
in DOT Marsh on June 13 Tidal Cycle ……… 117
Figure 3-9. Water Levels (a) and Hydraulic Gradients (b)
in DOT Marsh on July 1 Tidal Cycle……… 118 Figure 3-10. Water Levels (a) and Hydraulic Gradients (b)
in Natural Port Marsh on August 27, 2000 Tidal Cycle……… 119 Figure 3-11. Water Levels (a) and Hydraulic Gradients (b)
in Created Port Marsh on August 27, 2000 Tidal Cycle……… 120 Figure 3-12. Water Levels (a) and Hydraulic Gradients (b)
in Marine Lab Marsh on December 11-12, 2001 Tidal Cycle……… 121 Figure 3-13. Average Hourly Soil Water Flux Between 0.5 and 15 m Wells
in Two Marshes on March 20, 2000 (a) and April 12 - 13 (b) Tidal Cycles….. 122 Figure 3-14. Average Hourly Soil Water Flux from
Figure 3-15. Seasonal Variation in Nutrient Export from Edge
and Inland Positions within DOT and Natural Marshes……… 124 Figure 3-A. Soil Water Release Curves for 0-20 cm layer (a),
and 20+ cm Layer (b)……… 128
Chapter 1. SOIL DEVELOPMENT IN A CHRONOSEQUENCE OF CREATED SALT MARSHES
ABSTRACT
Impacts to salt marsh wetlands are mitigated by creation of new salt marshes, often on sandy dredged material that lacks the characteristics of natural marsh soils. Soil
indicators can be used to assess development of ecological functions in created marshes. We use a chronosequence of 10 created marshes from the North Carolina coast to examine long- term (28 year) trends in soil carbon, nitrogen and phosphorous pools, bulk density, particle size distribution and macro-organic matter (MOM) dry weight, N and P content, and
INTRODUCTION
Coastal salt marsh wetlands are valuable because they stabilize shorelines, provide wildlife habitat, and are used by commercially important fish. Ecological functions are processes that characterize and sustain an ecosystem. Some important salt marsh functions are high levels of primary and secondary production, sediment and nutrient accumulation, and biogeochemical transformations such as denitrification and sulfate reduction (Mitsch and Gosselink, 1993; Vernberg, 1993). These functions can contribute to the health of the larger estuarine ecosystem. Thus, when salt marshes are disrupted by road construction and other forms of development, there is a loss of function that potentially has wide impacts. Direct impacts to marshes are often mitigated by creation of new wetlands (Broome et al., 1988). However, it is unclear whether created marshes develop the full range of functions of natural marshes and what time scale is necessary for functional equivalency to occur.
Ecosystem development in created marshes is essentially a case of primary succession, a process generally limited by the absence of soil (Bradshaw, 1983). Created marshes in North Carolina are often established on dredged material which is a dense substrate that lacks the organic matter, silt, clay, nutrients and biological activity
characteristic of natural marsh soils (Lindau and Hossner, 1981; Craft et al., 1988). Marsh soils develop by accretion of sediment and in situ biomass and thereby maintain their
elevation as sea levels rise (Frey and Basan, 1978). Soil and ecological functions develop in tandem. For example, a dense plant canopy of Spartina alterniflora Loisel forms in as few as 3-5 years (Broome et al., 1986). The stems trap fine sediment (Gleason et al., 1979) and the roots add organic matter to the soil. These inputs increase the capacity of the soil to retain nutrients. It is likely that increased availability of soil nutrients also increases nutrient levels
of the root-rhizome mat. This material is sometimes referred to as macro-organic matter (MOM). The MOM nutrient content in created salt marshes of North Carolina has been estimated comparable to natural marshes after 15 years (Craft et al., 1988) while total soil C, N, and P pools of these marshes develop more slowly. By contrast, soils of created salt marshes in southern California show little development 11 years after marsh creation (Zedler and Calloway, 1999) and are highly nitrogen deficient (Langis et al., 1991).
Soil invertebrates (infauna) are a particularly crucial aspect of marsh function because they sustain fish and shorebird populations. Development of the infaunal community in created marshes also follows a sequence related to soil formation. Invertebrate communities in newly created marshes have low densities composed mainly of surface dwelling organisms (Moy and Levin, 1991; Levin et al.,1996). However, the community becomes more
abundant and diverse as soil detrital sources become available. This is demonstrated by the close correlation of infaunal densities with soil C, N, and MOM biomass (Craft, 2000). While infaunal densities similar to natural marshes can develop in as little as 8-15 years (Craft, in review), in other cases differences persist longer (Sacco et al., 1994). Soil physical factors such as texture also influence the distribution and abundance of various taxa (Sanders, 1958, Sarda et al., 1995).
The previous discussion suggests that there are soil prerequisites for ecological functions and these relationships are summarized in Table 1. While functions refer to processes, these soil properties are structural in the sense that they are measures taken at a single point in time. The relationship between the structure and function is not necessarily linear (Zedler and Lindig-Cisneros, 2000). A further limitation to the use of soil indicators is that there are functions unrelated to soil. Nonetheless, the relationship of soil to multiple functions and the
ease with which these soil properties are measured makes them potentially useful indicators (Craft, 2000). The functions of created marshes may be evaluated by tracking the
development of structural soil indicators toward a target level defined by natural marsh soil. Nearby natural marshes are ideal reference sites since they are likely to have a similar tidal regime, salinity, exposure and substrate type. Selection of a nearby reference marsh can eliminate confounding factors and reveal more clearly the progress of the created marsh toward maturity.
Objectives
Our first objective is to examine trends in soil properties of created marshes as a function of time since marsh creation. These trends show whether soil properties follow trajectories as the marsh develops and indicate whether marsh age can predict soil
development. In lieu of measuring soil properties at a single site over an extended period, we studied a chronosequence of several created salt marshes of various ages.
A second objective is to compare created marshes with natural marshes to determine if soil properties reach equivalence with natural marsh soils and what length of time is needed for equivalence. Reference targets are necessary to infer equivalency and we compare two such targets: 1) a series of natural marshes, each of which is paired with one nearby created marsh, and 2) a single average of all natural marshes against which all created marshes are compared. In the latter case, we use two statistical approaches to compare means of created and natural marshes: 1) a difference test involving contrasts of means, and 2) a bioequivalence test. Bioequivalence procedures are applicable to research in which the main interest is whether two means are equal instead of the magnitude and significance of
their difference (Berger and Hsu, 1996). Although developed originally for use in the pharmaceutical industry, they are used in the life sciences as well (Garrett, K.A., 1997).
MATERIALS AND METHODS
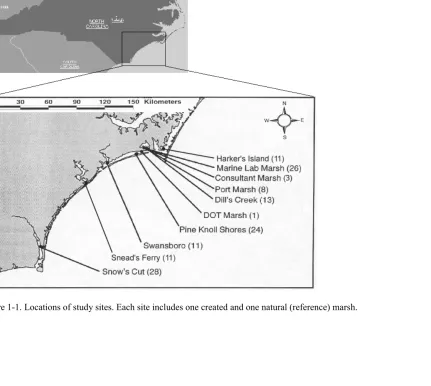
We selected ten created salt marshes from the North Carolina coast (Figure 1) that varied in age but had similar physiography (Table 2). For each site, we identified the nearest natural marsh. These ten natural marshes comprised our sample of reference marshes. For most created and natural marshes, we collected ten soil cores from the 0 to30 cm layer. We sectioned each core into surface (0 to10 cm) and subsurface (10 to 30 cm) layers. The 0 to 10 cm layer contains most of the plant roots and rhizomes and represents the zone where soil forming processes are most active. The 10 to 30 cm layer represents a relatively unaltered zone of soil. After the soil was air dried and sieved to remove large (> 2 mm diameter) roots, soil carbon and nitrogen content were determined using a Perkin-Elmer CHN elemental analyzer. Soils with a high content of shell fragments were treated with dilute HCl to remove inorganic carbon. Total phosphorous was measured in perchloric acid digests (Sommers and Nelson, 1972) using the method of Murphy and Riley (1962). The soil samples were
analyzed for particle size distribution by the pipette method (Gee and Bauder, 1986) and bulk density by the core method (Blake and Hartge, 1986). Analysis of the soils of two 11-year old marshes (Harkers and Sneads Ferry sites) was limited to bulk density, soil C and N content. A second set of 10 cores was collected from the other 8 marshes for analysis of MOM dry weight and MOM-C, N and P by the above listed methods. However, MOM of the 1- and 3-year old marshes was insufficient for analysis of C and N.
Statistical analysis
We used SAS software (SAS, 1990) to perform regression analysis of mean soil properties of the created marshes against marsh age. We used the student’s t-test to compare the soil and MOM properties of the paired created and natural marshes. We used the contrast option for general linear models (GLM) to determine the significance of the difference between the predicted values for the created marshes and the average value for all natural marshes. Use of predicted values rather than actual values makes it possible to test differences at ages for which actual data are not available. However, this comparison is meaningful only if the soil properties are closely related to marsh age (r2 > 0.5, p < 0.05). Those soil properties having a non-linear relationship to marsh age (soil C and N) were first log transformed in order to linearize this relationship and to stabilize variances.
Bioequivalence testing requires selection of a maximum difference from the reference that can be tolerated yet still be considered equivalent. A difference of one standard
deviation from the mean of all natural marshes was arbitrarily selected as a tolerance level. While that may appear to be a short coming of the approach, the use of 95% confidence coefficients in difference testing is similarly arbitrary. This t-test procedure is one sided since deficiency of a property with respect to the reference is of concern while excess is generally not. For soil properties that increase over time to approach the average natural marsh, t-tests are constructed in the following way:
t = (Ŷc - Ŷn) + δ S(Ŷc - Ŷn)
Where: Ŷc - Ŷn = estimate of difference between the created and natural marshes δ = tolerance level
S(Ŷc - Ŷn) = standard error of estimate
The estimates of difference and standard error are obtained from the estimate option in the GLM procedure and are thus based on predicted rather than actual values for a given marsh age. The hypothesis tested is: Ho: µc < µn – δ (non-equivalence) vs. Ha: µc > µn – δ
(equivalence) where µc =mean for the created marsh and µn = mean for the natural marsh.
For properties that decrease with time to approach the average natural marsh, the sign of δ is reversed. The decision criterion is to reject Ho if t > t.95, df and conclude in favor of Ha. The
t-tests are conducted for different marsh ages beginning at year = 28, the age of the oldest marsh in the chronosequence and the one most likely to be equivalent. If the test does not reject Ho, then there is no basis for concluding equivalence and no further testing is
necessary. If the test rejects Ho then equivalence of the created and natural marshes for that
age is concluded and the test is repeated for a slightly younger marsh. By testing
sequentially younger ages in two year increments we determine the youngest age for which equivalence of the created and natural marshes occurs.
RESULTS
Soil Properties
Soil organic carbon/ total nitrogen content: The trends of C and N with marsh age are similar and may be discussed together. Most N in these marshes is present in the organic form, as indicated by the close correlation of C and N (r = 0.98). In the 0 to10 cm layer, the increase in C and N on a weight basis with marsh age (Figure 2a, d) is highly predictable (r2 > 0.75) and significant (p < 0.05). The relationship best fits a quadratic equation and
suggests an initially slow period of increase in C and N followed by an accelerating rate after about 15 years. The initial lag in C and N accumulation may be related to the gradual
development of the root-rhizome mat, a major source of C and N to marsh soils. Although C and N levels must stabilize at some point, they do not appear to do so within the time frame of this study. However, when C and N on a volume basis (0-10 cm depth) are graphed against marsh age, the regression line appears to approach and level out near the asymptote suggested by the average natural marsh (Figures 2c, f).
In the 0 to10 cm layer, t-tests of paired created and natural marshes show that those marshes aged 1 to 13 and 28 years have significantly lower C and N levels than their references. The 24- and 26-year old marshes exceed or are not significantly different from their references. Although the 28-year old marsh actually has higher C and N levels than all other created marshes, it appears deficient with respect to its reference, a marsh with high organic matter soil (Histosol). In this case, it is more instructive to compare the created marshes with the entire sample of the population of natural marshes. Contrasts of predicted values of created marshes against the average natural marsh are significant for marshes aged 1 to18 years and not significant for older marshes. The bioequivalence test concludes equivalence at 22 years (Table 3).
In the 10 to 30 cm layer, there is a moderately predictable (0.50 > r2 > 0.75) and significant trend of C and N accumulation on a weight basis (Figures 2b, e) but total pools are low relative to the 0 to10 cm layer. Since there are relatively few roots at this depth, substantial C and N accumulations are unlikely to occur until accretion buries the current C and N enriched surface layer. The t-tests of paired created and natural marshes show most created marshes have significantly lower C and N levels than their references except for the 8-, 11H- and 24-years old marshes which are not significantly different. The references for these three marshes are relatively young natural marshes with a thin capping of marsh soil
over the basal sand. Contrasts of predicted levels of soil N in created marshes against that of the average natural marsh are significant for all ages. Contrasts for soil C are significant for ages 1-24 and not significant for older marshes. The bioequivalence test does not reject the null hypothesis of different mean C and N levels at 28 years (Table 3).
Soil total phosphorous: In the 0 to10 cm layer, the trend of phosphorous accumulation is moderately predictable and significant when graphed on a weight basis (Figure 2g), though the relationship is absent when graphed on a volume basis (Figure 2i). The t-tests of paired created and natural marshes show that the 3- and 8-year old created marshes have
significantly lower P levels than their references while the 1- and 11-28-year old marshes are not significantly different. A flock of seagulls (Larus spp.) commonly feeds and nests at the 1-year old marsh. The resulting guano inputs may account for the slightly elevated P levels and the lack of significant difference from the reference. Phosphorous levels for the 8-year old reference site are very high. It is adjacent to the port of Morehead City (NC), a facility which receives barges carrying processed rock phosphate. This fertilizer material may have impacted the marsh and therefore, the site is not used to estimate P levels of the average natural marsh. Contrasts are significant for marshes aged 1-18 years but not significant for older marshes. The bioequivalence test does not reject the null hypothesis of different mean P content for year 28 (Table 3).
In the 10 to 30 cm layer, soil P content is poorly related to marsh age (Figure 2h). Two likely inputs of P to created marshes are deposition of clay particles with adsorbed P and deposition of guano from birds. These materials are added to the soil surface and accumulation of P below the surface occurs only as roots decay and as infauna burrow and mix the soil. However, since most roots and infauna are concentrated in the surface 0 to 10
cm, there is little opportunity for transport of P to the 10 to 30 cm layer. The t-tests of paired created and natural marshes show that the marshes aged 13-26 years are not significantly different from their references but in general there is little pattern with age. Soil P levels at this depth are variable and probably reflect parent material differences rather than soil development processes.
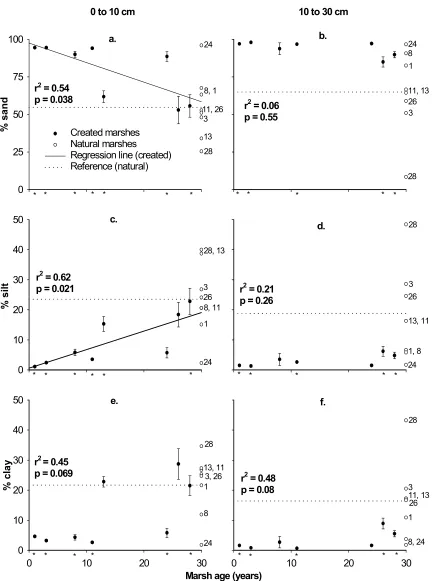
Sand content: In the 0 to10 cm layer, the decrease in sand content with marsh age is moderately predictable and significant (Figure 3a). The t-tests of paired created and natural marshes show that created marshes aged 1-13 and 28 years have significantly more sand than their references while the 24- and 26- year old marshes are not significantly different or lower in sand content. Contrasts are significant for ages 1-21 years and not significant for older marshes. The bioequivalence test does not reject the null hypothesis of different mean sand content at year 28 (Table 3).
In the 10 to 30 cm layer, sand content is poorly related to created marsh age (Figure 3b). The 13-year old marsh is excluded from analysis of particle size trends at this depth since it is on a graded upland with a sandy clay loam subsurface texture. The sand content of all other created marshes is > 85%. This shows that the texture of the subsurface layer of the created marshes undergoes little change from the original parent material. The t-tests
comparing the paired created and natural marshes indicate that the 1-, 3-, 11-, 26-, 28- year old marshes have significantly greater sand content than their references while the 8-, 13- and 24-year old marshes are not significantly different.
Silt content: In the 0 to 10 cm layer, silt accumulation over time in created marshes is moderately predictable and significant (Figure 3c). The t-tests of paired created and natural marshes indicate the created marshes aged 1-13 and 28 years have significantly less
silt than their references while the 24- and 26-year old created marshes are not significantly different. The 28-year old marsh has the highest mean silt content of any created marsh yet it appears deficient relative to its reference, a natural marsh in the Cape Fear estuary. This river has historically carried a high silt load, however, construction of a large dam about 30 years ago has undoubtably reduced the river’s silt load. Thus, potential silt accumulation in the 28-year old marsh may be limited relative to its reference. Contrasts are significant for ages 1-22 years and not significant for older marshes. The bioequivalence test does not reject the null hypothesis of different mean silt contents at year 28 (Table 3).
In the 10 to 30 cm layer, silt content is poorly related to marsh age (Figure 3d). Like soil P, silt is added only to the soil surface and accumulation at the 10-30 cm depth is unlikely to occur until accretion buries the current silt enriched surface layer. The t-tests of paired created and natural marshes show most created marshes have significantly lower silt levels than their reference marshes. However, the 8- and 24-year old marshes are not significantly different from their references.
Clay: Relative to sand and silt, clay content is weakly related to marsh age and the relationship is not significant for either depth (Figures 3e, f). In the 0 to 10 cm layer, t-tests of paired created and natural marshes show that most created marshes have significantly lower clay content than their reference marshes with the exception of the 13- and 26-year old marshes which are not significantly different and the 24-year old marsh which has higher clay content. In the 10 to 30 cm layer, most created marshes have significantly lower clay content than their references except the 8- and 24-year old marshes which are not
significantly different.
Soil Bulk Density: In the 0 to 10 cm layer, the decrease in bulk density with age of the created marshes is highly predictable and significant (Figure 4a). The regression equation predicts a 0.03 g cm-3 decrease per year. While newly created marshes have mean bulk densities typical of upland soils (1.4 g cm-3), the 26- and 28-year old marshes have mean bulk densities less than the average for all natural marshes (0.73 g cm-3). Some factors likely to cause this decrease are the development of a root-rhizome mat, increases in soil organic matter and activities of large numbers of fiddler crabs, Uca spp. The t-tests of paired created and natural marshes show significantly higher bulk densities for created marshes aged 1-13 years. Exceptions are the Sneads Ferry and Harkers marshes (11F and 11H) which are paired to reference marshes with unusually dense substrates. Bulk densities in the 24 to 28 year old marshes are lower or not significantly different from their references. Contrasts are
significant for marshes aged 1-16 years and not significant for older marshes. The bioequivalence test concludes equivalence at 18 years (Table 3).
In the 10 to 30 cm layer, the trend of decreasing bulk density (Figure 4b) is also highly predictable and significant although the rate of decrease (0.017g cm-3 yr-1) is only half that predicted for the 0 to 10 cm layer. In general, t-tests comparing the paired created and natural marshes indicate that the soils of created marshes at the 10 to 30 cm depth remain denser than those of their reference marshes. However, due to the variability of reference marshes, the 8-, 11-(Sneads Ferry and Harkers sites) and 24-year old marshes have bulk densities not significantly different from their references. Contrasts are significant for years 1-22 and not significant for older marshes. The bioequivalence test does not reject the null hypothesis of different means (Table 3).
Macro-Organic Matter Properties
MOM dry weight: In the 0 to10 cm layer, the increase in MOM biomass with marsh age is highly predictable and significant (Figure 4c). The t-tests of paired created and natural marshes show that the 1-, 3-, 11-, and 28-year old marshes accumulate significantly less MOM than their references while the other marshes are not significantly different from (ages 8, 13 and 24 years) or exceed (age 26 years) their references. Contrasts are significant for ages 1-8 years and not significant for older marshes. The bioequivalence test concludes equivalent MOM accumulation by year 22 (Table 3).
In the 10 to 30 cm layer, the increase in MOM biomass with marsh age is also highly predictable and significant (Figure 4d). The t-tests of paired created and natural marshes show that the created marshes aged 1, 3, 11, and 13 years produce significantly less MOM than their references while those aged 8 and 24-28 years are not significantly different. Contrasts are significant for ages 1-11 years and not significant for older marshes. The bioequivalence test concludes equivalent MOM accumulation by year 26.
MOM total nitrogen: The increase in MOM-N levels with marsh age is significant and highly predictable in the 0 to 10 cm layer and moderately predictable in the 10 to 30 cm layer (Figures 5a, b). In both layers, t-tests of paired created and natural marshes show that MOM-N levels of the 8-, 11-, and 13-year old marshes are significantly lower than the references while those of the 24- to 28-year old marshes are not significantly different. Contrasts are significant for marshes aged 1-19 years (0 to 10 cm layer) or 1-20 years (10 to 30 cm layer) but non-significant for older marshes. In the 0 to 10 cm layer, the
bioequivalence test does not reject the null hypothesis of different means at year 28 while in the 10 to 30 cm layer it concludes equivalence at 26 years.
MOM total phosphorous: In the 0 to 10 cm layer, the decrease in MOM-P content with age of the created marshes is moderately predictable and significant (Figure 5c). This could reflect increased availability of N in the maturing marshes which increases plant growth, thereby diluting the MOM-P concentration. It could also reflect the greater proportion of live roots in the MOM of newly created marshes relative to that of mature marshes. Live roots of some marsh plants have higher P levels than dead root material, an observation confirmed by Craft et al. (1988). MOM-P levels in the reference for the 8-year old marsh are highly elevated relative to other natural marshes possibly due to deposition of P fertilizer material from the adjacent Morehead City port. Thus, this site is not used to estimate a value for the average natural marsh. Even with this site removed, MOM-P trends relative to the average natural marsh are ambiguous. Created marshes initially appear to have higher levels than the average natural marsh but over time decline to a level lower than the reference. Natural marshes of the area may not be suitable references with respect to MOM-P, possibly due to a longer history of anthropogenic impacts. While excess N is readily removed by denitrification, excess P accumulates in marsh soils. In the 10 to 30 cm layer, MOM-P levels are not related to age of the created marshes (Figure 5d) and appear to reflect site differences rather than soil development processes. The average for the created marshes is similar to the average for the natural marshes.
Results of t-tests of paired created and natural marshes are similar for the two layers. MOM-P levels in the 8-, 13-, and 24-year old created marshes are significantly lower than their references while the 1(10 to 30 depth), 3-, 11-, 26-, and 28-year old created marshes are
not significantly different. Only the 0 to 10 cm layer of the 1-year old created marsh has significantly greater MOM-P levels than its reference. Again, this may be related to heavy seagull use of this marsh.
Carbon/ Nitrogen ratio trends
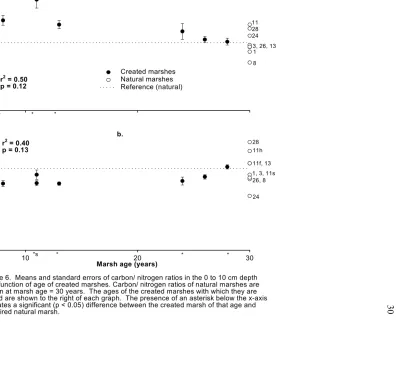
MOM Carbon/ Nitrogen ratio: In the 0 to 10 cm layer, the decrease in MOM C/N with marsh age is moderately predictable but not significant (Figure 6a). The t-tests of paired created and natural marshes show that the marshes aged 8-, 11-, and 13-years have
significantly higher MOM C/N levels than their references while older marshes are either not significantly different or less than their references.
Soil Carbon/Nitrogen ratio: In the 0 to 10 cm layer, mean soil C/N of the created marshes ranges from 8.9 in the 1-year old marsh to 16.9 in the 28-year old marsh (Figure 5b). Snead’s Ferry marsh (11 years old) has an unusually high value of 24.5 due to the presence of woody debris, and this marsh was removed from the trend analysis. The 1- and 3-year old marshes were also removed from the trend analysis because all soil samples were at the detection limit for nitrogen and the C/N estimates were thus skewed. Even after removing these three sites from the analysis, there was little relationship between soil C/N and marsh age. This reflects the fact that carbon and nitrogen are accumulating at approximately the same rate in the soils of created marshes. The t-tests of paired marshes show that the 1-, 3-, 11-(Swansboro), 13- and 28-year created marshes have significantly lower soil C/N than their references. The 8-, 11-(Harkers), 24- and 26-year old created marshes exceed or are not significantly different than their references.
DISCUSSION
Soil development in the 0 to 10 cm layer of created marshes follows clear trajectories with time. Most soil and MOM properties approach and eventually equal the levels
characteristic of natural marshes. In the 0 to 10 cm layer, age is a particularly good predictor of soil C and N, bulk density, MOM-N and biomass. In the 10-30 cm layer, trends in these properties are generally weaker but still significant. Significant trends in soil-P, sand, silt and MOM-P also occur in the 0 to 10 cm layer but not in the 10 to 30 cm layer.
These findings differ from some previous studies that indicated created marshes do not become similar to natural marshes with time. Some researchers suggest that site
differences such as substrate and salinity account for more variation among created marshes than does marsh age (Moy and Levin, 1991, Sacco et al., 1994). In some cases, the short time frame hampers these studies. In other cases, there are regional differences in rates of soil development that lead Zedler and Calloway (1999) to reject the idea that soil properties of created marshes in California converge over time with those of natural marshes. On the other extreme, Lindau and Hossner (1981) predict that created marshes in Texas can develop soil properties comparable to natural marshes in just 2-5 years. Regional differences may explain why Streever (2000) did not find evidence that created marshes become similar to natural marshes with time since his study combined data sets from across a large region. Therefore, the findings of this study can be extended to regions outside the southeastern U.S. only with caution. But while rates of soil development are likely to differ between regions, the
existence of trajectories on some time scale is probably constant across regions. In some cases, the use of paired reference marshes can explain variation among created marshes. Though the soil of the Pine Knoll marsh (24 years old) appears deficient in
C, N, and silt relative to other older created marshes, it is paired with a nearby natural marsh which also fails to accumulate C, N and silt due to its exposure to frequent, high energy waves. In this case, the created marsh compares favorably with the reference. However, in another case, the Snows Cut marsh (28 years old) bears little resemblance to its reference and is actually more similar to other created marshes. Thus, the use of average values from several natural marshes can be a better reference when assessing soil development trends and predicting time to equivalence. Table 3 summarizes the results of three methods of assessing time to equivalence and lists soil/MOM properties in the approximate chronological order in which equivalence occurs. The paired t-tests provide information about specific marshes but tell us little about overall trends. Relative to the other statistical approaches, they
underestimate time to equivalence for soil-P and bulk density and overestimate it for soil C and N. The use of contrasts of predicted values for the created versus the hypothetical average natural marsh provides more precise estimates of time to equivalence. The
theoretical basis for bioequivalence tests is more appropriate than that of standard difference testing. Our bioequivalence test generally confirms the results of the contrasts but produces slightly more conservative estimates of time to equivalence. However, its failure to conclude equivalence in some cases is due to large standard errors for those models.
In the 0 to 10 cm layer, bulk density is the first soil property to reach equivalence and this occurs in 17-18 years. Soil nutrient pools are slower to develop. Carbon and nitrogen reach equivalence in 19-22 years. Soil P levels are more difficult to predict and are highly affected by site characteristics. Nonetheless, equivalent P levels may be predicted to occur in about 20-30 years. Soil texture changes more slowly than soil nutrient pools with sand reaching equivalence in 22-30 years and silt taking somewhat longer. In the 10 to 30 cm layer, soil
properties do not change much with time. Bulk density is the only property at this depth that shows a strong trend toward convergence with natural marsh soils and equivalence may be predicted to occur in 23-30+ years. In contrast to soil properties, MOM dry weight and N content develop toward convergence with the natural marsh with similar rapidity in both the 0 to 10 and 10 to 30 cm layers. This occurs within 20-26 years.
This study confirms that total (0-30 cm) soil nutrient pools are slow to develop and are probably dependent on accretion in response to rising sea levels. However, when the 0 to 10 and 10 to 30 cm layers are considered separately, we find that soil nutrient pools of the 0 to 10 cm layer develop about as quickly as MOM dry weight and N levels. Since most functions involve the biological activity concentrated in the 0 to 10 cm soil layer, persistent differences in the soils of the 10 to 30 cm layer are not likely to affect ecological function. Indeed, if young natural marshes (references for 8-, 11H-, and 24-year marshes) are used as the standard, then it is likely that the 10 to 30 cm layer of created marshes would be
equivalent.
A previous study of soil development in created marshes indicated that soil C/N ratio declines with time (Craft, 2001), however, this study finds no change in soil C/N with time. The MOM C/N ratio decreases sharply (from 80 to 50) as created marshes age. Although this trend is not significant (p > 0.05), it suggests that the Spartina alterniflora plants become less N stressed over time and that the nutritional quality of the MOM increases. Presumably, the capacity of these created marshes to sustain deposit feeding infauna increases as well.
REFERENCES
Berger, R.L. and J.C. Hsu. 1996. Bioeqivalence trials, intersection-union tests, and equivalence confidence sets. Statistical Science. 4:283-319.
Blake, G.R. and K.H. Hartge. 1986. Particle size analysis. p. 363-376. In A. Klute (ed.) Methods of soil analysis: physical and mineralogical methods. Agron. Monogr. 9. ASA, CSSA and SSSA, Madison, WI.
Bradshaw, A.D. 1983. The reconstruction of ecosystems. Journal of Applied Ecology. 20:1-17.
Broome, S.W., E.D. Seneca and W.W. Woodhouse, Jr. 1986. Long-term growth and development of transplants of the salt-marsh grass Spartina alterniflora. Estuaries 9:63- 74.
Broome, S.W., E.D. Seneca and W.W. Woodhouse, Jr. 1988. Tidal salt marsh restoration. Aquatic Botany 32:1-22.
Craft, C.B. 2000. Co-development of wetland soils and benthic invertebrate communities following salt marsh creation. Wetlands Ecology and Management. 8:197-207.
Craft, C.B. 2001. Soil organic carbon, nitrogen and phosphorous as indicators of recovery in restored Spartina marshes. Ecological Restoration. 19(2):87-91.
Craft, C.B., S.W. Broome and E.D. Seneca. 1988. Nitrogen, phosphorus and organic carbon pools in natural and transplanted marsh soils. Estuaries 11:272-280.
Craft, C., P.M. Megonigal, S.W. Broome, J. Cornell, R.C. Freese, J. Stevenson, L. Zheng, J.N. Sacco. The pace to ecosystem development of constructed Spartina alterniflora marshes. Ecol. Appl.(In press).
Frey, R.W. and P.B. Basan. 1978. Coastal salt marshes. P.101-170. In R.A. Davis (ed.)Coastal sedimentary environments. Springer-Verlag, New York.
Garrett, K.A.. 1997. Use of statistical tests of equivalence (bioequivalence tests) in plant pathology. Phytopathology 87(4): 372-374.
Gee, G.W. and J.W.Bauder. 1986. Particle size analysis. p. 383-412. In A. Klute(ed.) Methods of soil analysis: physical and mineralogical methods. Agron. Monogr. 9. ASA, CSSA and SSSA, Madison, WI.
Gleason, M.L., D.A. Elmer, N.C. Pien, J.S. Fisher. 1979. Effects of stem density on sediment retention by salt marsh cord grass, Spartina alterniflora Loisel. Estuaries 2(4): 271-273.
Langis, R., M. Zalejko and J.B. Zedler. 1991. Nitrogen assessments in a constructed and a natural salt marsh of San Diego Bay. Ecological Applications 1:40-51.
marsh. Marine Ecology Progress 141:67-82.
Lindau, C.W. and L.R.Hossner. 1981. Substrate characterization of an experimental marsh and three natural marshes. Soil Science Society of America Proceedings 45:1171-1176. Mitsch, W.J. and J.G. Gosselink. 1993. Wetlands. 2nd edition. Van Nostrand Reinhold, New York.
Moy, L.D. and L.A. Levin. 1991. Are Spartina marshes a replaceable resource? A functional approach to evaluation of marsh creation efforts. Estuaries 14(1):1-16.
Murphy, J. and J.P.Riley. 1962. A modified single solution method for the determination of phosphate in natural waters. Analytica Chimica Acta 27:31-36.
Sacco, J.N., E.D.Seneca and T.R. Wentworth. 1994. Infaunal community development of artificially established salt marshes in North Carolina. Estuaries 17(2): 489-500.
Sanders, H.L. 1958. Benthic studies in Buzzards Bay. I. Animal-sediment relationships. Limnology and Oceanography 3(3):245-258.
Sarda, R., K. Foreman and I. Valiela. 1995. Macroinfauna of a southern New England salt marsh: seasonal dynamics and production. Marine Biology 121:431-445.
SAS Institute. 1990. SAS user’s guide. SAS Institute, Cary, North Carolina, USA. Sommers, L.E. and D.W. Nelson. 1972. Determination of total phosphorous in soils: a rapid perchloric acid digestion procedure. Soil Science Society of America Proceedings 36:902-904.
Streever, W.J. 2000. Spartina alterniflora marshes on dredged material: a critical review of the ongoing debate over success. Wetlands Ecology and Management 8:295-316.
Vernberg, F.J. 1993. Salt marsh processes: a review. Environmental Toxicology and Chemistry 12:2167-2195.
Zedler, J.B. and J.C. Calloway. 1999. Tracking wetland restoration: do mitigation sites follow desired trajectories? Restoration Ecology 7(1):69-73.
Zedler, J.B and R. Lindig-Cisneros. 2000. Functional equivalency of restored and natural salt marshes. Pp565-582. In M.P. Weinstein and D.A. Kreeger (ed.) Concepts and controversies in tidal marsh ecology. Kluwer Academic Publishers, Dordrecht, The Netherlands.
Table 1-1. Relationship of ecological functions with potential soil indicators.
Ecological Function Soil Based Indicator
Plant productivity Soil reserves of N and P
Nutrient retention Clay, humus content, CEC
Infaunal productivity Soil and MOM organic C and N
Habitat suitability for infauna Bulk density, soil texture
Rates of nutrient mineralization Carbon/ Nitrogen ratio
Denitrification, SO4- reduction Soil organic carbon
Table 1-2. Site characteristics of created and natural Spartina alterniflora marshes.
Site1 Size2 Age2 Tidal range3 Salinity range3 Geomorphic position3 Soil Classification4
(ha) (years) (meters) (ppt)
1. DOT 0.9 1 1 20-30 back barrier flats Typic Psammaquent
2. Consultant 1.0 3 1 17-32 back barrier flats Typic Hydraquent
3. Port 1.0 8 1 18-30 back barrier flats Typic Hydraquent
4. Swansboro (S) 0.4 11 1.1 20-30 riverine Typic Psammaquent
5. Harkers Is. (H) 0.4 11 1 20-30 back barrier flats Typic Hydraquent
6. Snead Ferry (F) 0.4 11 1.1 20-30 back barrier flats Typic Psammaquent
7. Dill's Creek 0.3 13 1 14-33 submerged upland Typic Hydraquent
8. Pine Knoll 0.3 24 1 20-30 back barrier flats Typic Psammaquent
9. Marine Lab 0.2 26 1 20-30 back barrier flats Typic Hydraquent
10.Snow's Cut 0.8 28 1.2 5-20 riverine Typic Medisaprist
1 Marshes were constructed for shoreline stabilization (8), dredge spoil stabilization (9, 10), research (3 – 6), mitigation on dredge
spoil (1, 2) and mitigation on graded upland soil (7). 2 Created marshes only
3 Both created and natural reference marshes
4 Natural reference marshes only. Soils of created marshes classify as Typic Psammaquents (Carteret series), except Dills Creek
which classifies as a fine-loamy, Aquic Udorthent (series unknown).
Table 1-3. Comparison of the results of three methods to estimate years required for created marshes to become equivalent to natural marshes. ne = not bioequivalent or bioequivalence not detected
0-10 cm depth 10-30 cm depth
t-tests1 contrasts2,3 bioequivalence2 t-tests1 contrasts2,3bioequivalence2
MOM dry weight 8 8 22 MOM dry weight 8 12 26
Bulk density 11 17 18 Bulk density 8 23 ne
Soil-C 24 19 22 Soil-C 8 25 ne
Soil-N 24 19 22 Soil-N 8 >28 ne
Soil-P 1 19 ne Soil-P 1 . .
Soil C/N 8 17 28 Soil C/N 3 18 ne
MOM-N 24 20 ne MOM-N 24 21 26
MOM C/N 24 . . MOM C/N 24 . .
Sand 24 22 ne Sand 8 . .
Silt 24 24 ne Silt 8 . .
1 t-tests compare means of paired created and natural marshes. Year shown is the age of the youngest marsh for which non-significant differences (p > 0.05) are found.
2 contrasts and bioequivalence tests compare the predicted values for the created marshes with the average for all natural marshes. Estimates are omitted for those properties which do not have a predictable (r2 > 0.50) and significant (p < 0.05) relation to age of created marsh.
3 Year shown is the age of the youngest marsh for which non significant differences (p > 0.05) are found.
Figure 1-1. Locations of study sites. Each site includes one created and one natural (reference) marsh.
Figure 1-2. Means and standard errors for soil carbon (a-c), nitrogen (d-f), and phosphorous (g-i) content as a function of age of created marshes. Due to scale limitations, the carbon levels of the reference marsh paired with the 28-year old marsh are not shown. This marsh soil had 6570 mmol kg-1 in the 0 to 10 cm layer and 7920 mmol kg-1 in the 10 to 30 cm layer. The means of the natural reference marshes are shown at year 30. Numbers to the right of each graph show the age of the created marsh with which that reference marsh is paired. The presence of an asterisk below the x-axis indicates a significant (p < 0.05) difference between the created marsh of that age and its paired natural marsh.
d. mmo l N k g -1 0 100 200 300 a. mm o l C k g -1 0 1000 2000 3000 4000 5000 g.
0 10 20 30
mm o l P k g -1 0 10 20 30 b. Created marshes Natural marshes Regression (created) Reference (natural)
10 to 30 cm 0 to 10 cm
e.
h.
0 10 20 30
c.
mo
l P m
-3 0 500 1000 1500 2000 2500 f. mo l N m -3 0 40 80 120 i.
0 10 20 30
mo l P m -3 0 10 20
0 to 10 cm (volumetric)
r2 = 0.86
p = 0.0001
r2 = 0.85
p = 0.0001
r2 = 0.61
p = 0.02
r2 = 0.013
p = 0.79 r2 = 0.55
p = 0.014 r2 = 0.52
p = 0.02
r2 = 0.77
p = 0.003
r2 = 0.65
p = 0.002
r2 = 0.10
p = 0.43
11s
13
3, 1, 26 11f 8, 11h 24 11s 28 13
3, 26, 1
11f, 8 11h 24 8 11 28
3, 26, 13 1
24 8, 24
28 11 1, 13 3 28 3, 11s 13 11h 8, 24 11f 26 3, 11s 1, 13 11h 24, 8 26 28 11f 13 1, 3 8 24 11s 11h 28 26, 11f 13 11s 1, 3 8 11h 24 8 24 26 1 28, 11 3, 13 11f * * * ** * * * *
* * * *s
*f *
* * * * * * *
* * *s
*f * * *
* * * *s
*f * * * * * *** * * *
* * * *
** * *
* * * * *
a. % s a n d 0 25 50 75 100 Created marshes Natural marshes
Regression line (created) Reference (natural) b. c. % s ilt 0 10 20 30 40 50 d. f.
Marsh age (years)
0 10 20 30
e.
0 10 20 30
% c la y 0 10 20 30 40 50
0 to 10 cm 10 to 30 cm
Figure 1-3. Means and standard errors of sand, silt, and clay as a function of age of created marshes. Mean sand, silt, and clay of reference marshes are shown at marsh age = 30 years. The ages of the created marshes with which they are paired are shown to the right. The presence of an asterisk below the x-axis indicates a significant (p < 0.05) difference between the created marsh of that age and its paired natural marsh.
24 8, 1 11, 26 3 13 28 28, 13 3 26 8, 11 1 24 28 13, 11 3, 26 1 8 24 28 3 11, 13 8, 24 1 26 28 3 26 13, 11 1, 8 24 24 8 1 11, 13 26 3 28
r2 = 0.54 p = 0.038
r2 = 0.62 p = 0.021
r2 = 0.45
p = 0.069 r2 = 0.48
p = 0.08 r2 = 0.21 p = 0.26 r2 = 0.06 p = 0.55
a. g soi l cm -3 0.0 0.4 0.8 1.2 1.6
Created m arshes Natural m arshes
Regression line (created) Reference (natural)
b.
c.
M arsh age (years)
0 10 20 30
g MOM m -3 0 10000 20000 30000 d.
0 10 20 30
0 to 10 cm 10 to 30 cm
Figure 1-4. Means and standard errors for soil bulk density and MOM dry weight as a function of age of created marshes. Mean bulk density and MOM dry weight for natural marshes are shown at marsh age = 30 years. The ages of the created marshes with which they are paired are shown to the right of each graph. The presence of an asterisk below the x-axis indicates a significant (p < 0.05) difference between the created marsh of that age and its paired natural marsh.
24 11h 11f 8 1 3, 11s 13 28 28 1 11 24 13, 3 8, 26 1 11, 28 3, 24 26, 13 8 24, 8 13, 11fh 1 11s, 26 3 28
r2 = 0.81
p = 0.0004
r2 = 0.89
p = 0.0005
r2 = 0.75 p = 0.005
r2 = 0.81 p = 0.0004
* * * *s * * *
* * * * * * * * *
* * *s * * *
a.
10 20 30
mm o l N k g -1 0 200 400 600 800
Created m arshes Natural m arshes
Regression line (created) Reference (natural)
b.
10 20 30
c.
M arsh age (years)
0 10 20 30
mm o l P k g -1 0 10 20 30 40 d.
0 10 20 30
0 to 10 cm 10 to 30 cm
Figure 1-5. M eans and standard errors for M O M nitrogen and phosphorous content as a function of age of created m arshes. M eans for natural m arshes are shown at m arsh age = 30 years. The ages of the created m arshes w ith which they are paired are show n to the right of each graph. The presence of an asterisk below the x-axis indicates a significant (p < 0.05) difference betw een the created m arsh of that age and its paired natural m arsh.
8 1 3 13, 26 11, 28 24 8 24 13 3 1 11 26 28 24 8 11, 3 13 1, 26 28 3 26, 11 8, 1 28, 24 13
r2 = 0.77 p = 0.021
r2 = 0.53 p = 0.041
r2 = 0.66 p = 0.049
r2 = 0.001
p = 0.94
* * *
* * * * * * *
* * *
a. MO M C a rb o n / N it ro g en r a ti o 0 20 40 60 80 Created marshes Natural marshes Reference (natural) b.
Marsh age (years)
10 20 30
So il Car bon / N it rogen r at io 0 5 10 15 20 25
Figure 6. Means and standard errors of carbon/ nitrogen ratios in the 0 to 10 cm depth as a function of age of created marshes. Carbon/ nitrogen ratios of natural marshes are shown at marsh age = 30 years. The ages of the created marshes with which they are paired are shown to the right of each graph. The presence of an asterisk below the x-axis indicates a significant (p < 0.05) difference between the created marsh of that age and its paired natural marsh.
11 28 24 3, 26, 13 1 8 28 11h 11f, 13 24 26, 8 1, 3, 11s
r2 = 0.50 p = 0.12
r2 = 0.40
p = 0.13
* * *
*s * * *
31
Chapter 2. SPATIAL PATTERNS OF SOIL AND VEGETATION IN CREATED
SPARTINA ALTERNIFLORA LOISEL MARSHES
ABSTRACT
One of the characteristic features of salt marshes is the distinct zonation that occurs
with respect to plant species and morphology, infaunal community, and soil characteristics.
This study documents zonation of soil and vegetation in three created salt marshes of
various ages located in the Newport River estuary of North Carolina. Since soil features are
potential indicators for ecological function, this study helps assess the functional
contributions of the zones in developing created salt marshes. Five soil cores were collected
from edge and inland positions within three created marshes of various ages (4, 11, and 29
years old) and one natural marsh. The soil was analyzed for carbon, nitrogen, phosphorous,
bulk density, texture, hydraulic conductivity, and porosity. The MOM (macro-organic
matter) was analyzed for carbon, nitrogen, phosphorous, and dry weight. Aboveground
biomass, stem height, and stem density of edge and inland positions were measured. The
geomorphology and soil morphology across these two positions was described. The edge
soils of the natural marsh were higher in bulk density, sand, MOM-N, MOM-P and lower in
soil carbon and clay than the inland soils. There were no spatial differences in the 4 year old
DOT marsh. Many of the spatial differences observed in the natural marsh were reversed in
the 11 year old Port marsh and the 29 year old Marine Lab marsh. This appears related to
the geomorphology of created marshes which have low elevation edges and high elevation
32
a flat, low elevation marsh plain inland. The soil of the inland areas of the created marshes
classifies as a Typic Psammaquent, an immature soil that lacks the characteristics of the
Mollic Endoaquent soils of the nearby natural marsh. Relative to the Marine Lab marsh, the
areal extent of mature soils is greater in the Port marsh due to the construction of a tidal
creek. This feature runs through the middle of the site and maximizes the proportion of
“edge” at this site.
INTRODUCTION
The spatial patterns of vegetation in natural salt marshes have long been
documented. This patterning is most evident as bands of vegetation of different morphology
or species. For example, Spartina alterniflora plants growing along tidal creeks are tall and
highly productive with low stem density. Further inland, S. alterniflora plants are shorter
and less productive with dense stem growth (Adams, 1963; Valiela et al., 1978). Most
research indicates that these spatial differences are due to environmental rather than genetic
factors. Fertilization experiments show that nitrogen limitations are one factor since N
fertilization partially converts short form plants into tall form (Valiela and Teal, 1974,
Broome et al., 1975). However, in some cases N levels in the soil are greater in the short
Spartina areas than in the tall form areas (Mendelssohn, 1979). Thus, additional factors such
as soil salinity, drainage and redox potential may limit or interact to limit growth (Howes et
al., 1986; Anderson and Treshow, 1980; Cooper, 1982; Wiegert et al., 1983). Higher
salinity levels inland may cause plants to divert N toward production of osmotica,
33
suggests that nitrogen limitation is an indirect cause of the short growth form. Their
research indicated that redox potential explains most variation in plant yield along a transect
from marsh edge to center. They suggested that NH4 uptake is controlled by soil O2 status
as well as NH4 concentration. By increasing either of these factors N uptake and plant
growth may be increased. Soil drainage also controls O2 status. The stagnant soil water
conditions that prevails in the zones away from the marsh edge (Gardner, 1973;
Mendelssohn and Seneca, 1980) may also allow toxic levels of salts and hydrogen sulfide to
accumulate and thereby inhibit plant growth.
The soil invertebrate (infauna) population of salt marshes also varies spatially. Sarda
et al. (1995) found three distinct assemblages of infauna within a natural marsh in New
England. The assemblages were distributed along gradients of varying soil texture and
organic matter with greatest production occurring in sandy, high organic matter areas of the
marsh. In created marshes there is generally greater infaunal density at low and medium
elevations than at high elevations (Moy and Levin, 1991; Levin et al.,1996). In a natural
marsh, Levin et al. also observed greater density of epifauna at low relative to high
elevations.
Salt marsh soils develop spatial patterns due to the depositional processes. Sediment
deposition is affected by the dense plant canopy which slows tidal currents and causes
larger, heavier particles to settle at the marsh edge while finer particles settle toward the
marsh center. In one study, over 80% of suspended material disappeared from floodwaters
within 12 m of a tidal creek (Stumpf, 1983). One study showed sediment deposition rates at
the marsh edge that were approximately twice that of the marsh interior (Leonard, 1997).
34
tidal creeks and marsh edges (Frey and Basan, 1978). Trapping of clay on plant stems is a
process that may be important in its deposition in the marsh interior. Samples across a 25 m
transect of soil in a North Carolina salt marsh showed a gradient of increasing silt and
organic matter from the edge to the marsh interior (Yelverton and Hackney, 1986).
Episodic processes such as storms also affect soil patterns within salt marshes (Stumpf,
1983), particularly when the marshes are adjacent to barrier islands where overwashing of
sand is an ongoing process. Gradients of soil porewater chemistry also exist in salt marshes.
In two young salt marshes, Osgood et al. (1993) found that hydrogen sulfide and ferrous iron
increased while redox potential decreased in a transect from high to low elevation areas.
Porewater NH4 and P increased from high to low elevation areas but factors such as soil
texture, salinity and pH did not vary significantly with elevation.
Created salt marshes have been used to stabilize shorelines and dredged material for
over 30 years. More recently, they have been constructed to mitigate damage to natural
marshes that occurs during development. The ecological functions of created marshes have
been studied with respect to vegetation establishment, infaunal community, and soil and
macro-organic matter (MOM) properties. Soil nutrient pools, texture and bulk density have
been proposed as one set of indicators for ecological function (Craft et al., in press). While
overall levels of most soil properties of the 0 to 10 cm layer approach and eventually equal
those of natural marshes (see chapter 1), spatial variability of these properties within created
marshes has been little studied. Lindau and Hossner (1981) observed the development of
spatial differences in a 16-month old created marsh. Clay, organic matter, total soil nitrogen
and extractable phosphorous accumulated more rapidly at low relative to high elevations.