Abstract
BELYEA, JENNIFER LEE. Spectroscopic Characterization of the Function and Mechanism of Dehaloperoxidase. (Under the direction of Stefan Franzen.)
The research presented in this dissertation focused on the effects of substrate binding on dehaloperoxidase, (DHP). Using Resonance Raman, (RR), UV-Visible spectroscopy, (UV-VIS), electron spin resonance, (ESR) and cyclic voltammetry, (CV) techniques we have shown that substrate indeed does bind to DHP and, in doing so, the spin state of the iron heme is affected. The binding of substrate by DHP is significant since DHP has a globin fold, and traditional globins do not have a substrate binding sites. In addition to DHP’s globin function, DHP is a peroxidase; thus it is capable of converting halogenated phenols to less halogenated quinones. The change in spin state of the heme iron which is observed when substrate binds to DHP indicates that the substrate binding acts as a trigger to switch DHP from a globin to a peroxidase.
SPECTROSCOPIC CHARACTERIZATION OF THE
FUNCTION AND MECHANISM OF
DEHALOPEROXIDASE
by
JENNIFER LEE BELYEA
A dissertation submitted to the Graduate Faculty of
North Carolina State University
in partial fulfillment of the requirements
for the Degree of
Doctor of Philosophy
CHEMISTRY
Raleigh, North Carolina 2006
APPROVED BY:
____________________ ____________________
Dr. Edmond Bowden Dr. Steven Lommel
____________________ ____________________
Dr. Stefan Franzen Dr. Tatyana Smirnova
Dedication
This work is dedicated to my family. My parents have always been my cheerleaders
encouraging me to do to my best and keeping my sprits up when thing did not work out as I
desired. My sister has become much more than a source of spare parts; she is a driving force
that pushes me to better myself as a person. My husband is my greatest source of support, if
it were not for Curtis none of this work would have been possible. Curtis has helped me with
each and every experiment, task, frustration and accomplishment. I am grateful to be part of
Biography
Jennifer Lee Belyea was born in Singapore, to Charles and Lek Lek Browning. Jennifer grew
up with a younger sister, Carol Sui, in West Plains, Missouri, where she attended West Plains
High School. After High School, Jennifer attended the University of Missouri in Columbia,
Missouri, where she received a B.S in Chemistry. Jennifer married Curtis Matthew Belyea in
Acknowledgements
First, I feel that it would be with utmost disrespect, to overlook the support Dr. Stefan
Franzen has provided me. Though there has been no shortage of differing opinions, it is
undeniable that our collaboration has had positive interactions. That is to say that our
collaborative efforts have been more productive than the individuals would suggest. Enough
kind words can not be said to thank you for all the doors which your experience has opened.
Your insight, and approach have been invaluable. I specifically wish to acknowledge the
opportunity at LANL, which has exceeded my expectations for Post-doctoral education, and,
until now, I never dreamed that such an opportunity would be possible.
I would like to thank Dr. Craig Roberts on whom I blame my interest in spectroscopy.
I offer my greatest thanks to Curtis Belyea for more support than any one can imagine.
A special thanks to Mary Candler. The lessons you teach are of my most valued.
Lauren Gilvey, and Mike Davis (DHP team leaders) thank you for your interest and
willingness to continue all that has been started. I extend my thanks to everyone I have
worked with and around the names are to numerous to list.
I must acknowledge my family. You have been very patient, understanding and
supportive. Without you I would never have been able to accomplish my degree. Curtis
Belyea I can not say thank you enough. Your help and understanding has kept me focused
Table of Contents
Page
LIST OF TABLES……….. viii
LIST OF FIGURES……… x
CHAPTER 1: Introduction and Background………..……….... 1
1.1 Introduction ……… ………... 2
1.2 Protein function as illustrated by oxygen-binding proteins: a review of myoglobin and hemoglobin ………..………...…. 9
1.3 Ligand binding ……….………... 12
1.4 Peroxidase: general overview of catalytic cycle……….... . 15
1.5 Resonance Raman Spectroscopy ………………...….. 17
1.6 The structure and vibrations of the heme chromophore………...… 18
1.7 Core size determination of DHP adducts using Resonance Raman. …………..…... 18
1.8 Electron Spin Resonance (ESR)……….………...….…. 19
1.9 Anionic ligands bind to DHP………...…... 21
References…..………..…. 22
Chapter 2: Resonant Raman Study of Ferric Heme Adducts of Dehaloperoxidase from Amphitrite ornata………..………... 26
2.1 Abstract………... 27
2.2 Materials and Methods………...………. 34
2.3 Results………. 37
2.4 Discussion………... 43
2.5 Conclusion………...…... 47
Chapter 3: ESR and UV- visible characterization of the 2,4,6-trifluorophenoxyl radical
produced by Dehaloperoxidase from Amphitrite ornata………...…………... 69
3.1 Introduction..………... 70
3.2 Materials and Methods………...………. 72
3.3 Results………. 73
3.4 Discussion ………..……….………... 80
3.5 Conclusion ...………...… 81
References…..………..…. 82
Chapter 4: Substrate binding triggers a change in the iron spin state in Dehaloperoxidase from Amphitrite ornata……… 84
4.1 Introduction..………... 85
4.2 Materials and Methods………...………. 86
4.3 Results and Discussion..………. 88
4.4 Conclusion ……….. 91
References…..………..…. 93
Chapter 5: Fluoride and cyanide binding by Dehaloperoxidase from Amphitrite ornata……….……… 96
5.1 Introduction..………. . 97
5.2 Materials and Methods………...………... 101
5.3 Results………... 103
5.4 Conclusions……….………...…... 127
Chapter 6: Electrochemical Characterization of Dehaloperoxidase from Amphitrite
ornata……….………….. 129
6.1 Introduction..………. 130
6.2 Materials and Methods………...………... 131
6.3 Results………... 133
6.4 Conclusions……….………...…... 137
6.5 References….………..… 138
Appendix ………. 139
List of Tables
CHAPTER 2 Page
Table 1 Soret maxima for Ferric HHMb, DHP and HRP ligated samples.
All sample were made in 100 mM citrate buffer pH 6……….. 49
Table 2. Results of Gaussian fits to Resonance Raman data collected
for ferric six-coordinate DHP adducts. The parameters are ω
(position), σ (Gaussian width), and % is percentage HS or LS as
calculated using Equation 1 and 2……….... 50
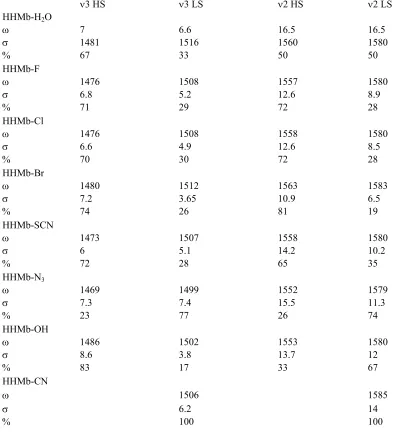
Table 3. Results of Gaussian fits to Resonance Raman data collected
for ferric six-coordinate HHMb adducts. The parameters are
ω (position), σ (Gaussian width), and % is percentage HS
or LS as calculated using Equation 1 and 2……….. 51
Table 4. Results of Gaussian fits to Resonance Raman data collected
for ferric six-coordinate HRP adducts. The parameters are
ω (position), σ (Gaussian width), and % is percentage HS
or LS as calculated using Equation 1 and 2……… 52
Table 5. Results of Gaussian fits to Resonance Raman data collected
for ferric five-coordinate adducts. The parameters are ω (position),
σ (Gaussian width) were calculated using Equation 1 and 2………... 53
and in the presence of 530 μM substrate at pH 5.0, 6.0, 7.0 and 8.0……….…. 109
Table 2 Hill coefficients determined for fluoride binding to ferric
DHP at pH 5.0, 6.0, 7.0, 8.0 with a variety of substrates at
List of Figures
Page CHAPTER 1
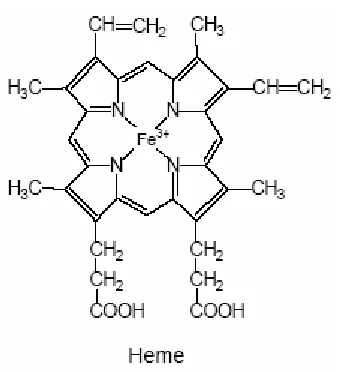
Figure 1. Heme……… 11
CHAPTER 2
Figure 1. Absorption Soret spectra of high spin ferric DHP (solid) and ferric DHP with
fluoride ligand (dash) in 100 mM phosphate buffer, pH 6.0 at room temperature. Soret
maxima for both the ferric DHP and ferric DHP-F are 406 nm with small differences in the
band widths. B. The Q-bands and charge transfer bands of ferric DHP and ferric DHP-F are
shown…...……….. 55
Figure 2. Absorption spectra of mixed and low spin ferric DHP samples. A. The shift in the
Soret band maximum from 406nm for ferric DHP to 414, 421 and 423 nm for hydroxide
(solid), azide (dash) and cyanide (dotted) ferric DHP, respectively, is characteristic of mixed
to low spin form of ferric DHP. B. The Q-(α/β)-band and charge transfer band spectra are
shown………...…… 56
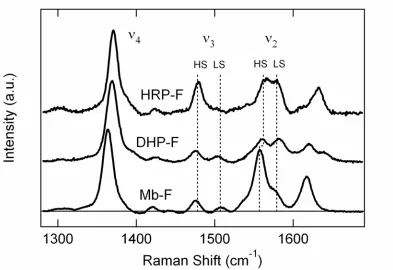
Figure 3. RR spectra are shown in the high frequency region for the ferric forms of HHMb,
DHP and HRP at pH 6.0. The Raman excitation wavelength was 410 nm………..…….... 57
Figure 4. RR spectra are shown in the high frequency region for the ferric forms of HHMb,
DHP and HRP at pH 6.0. The Raman excitation wavelength was 410 nm………. 58
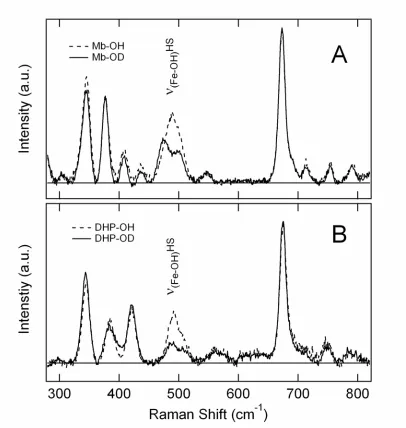
shown. B. The Raman data for the DHP-OH sample are shown. For both samples the spectra
are shown as OH (dashed) and OD (solid). ……….……… 59
Figure 6. RR spectra are shown in the high frequency region for the hydroxy adducts
HHMb-OH, DHP-OH and HRP-OH. The HRP-OH and Mb-OH samples were prepared at pH 12.0.
The DHP-OH sample was prepared at pH 10.5. The Raman excitation wavelength was 410
nm……… 60
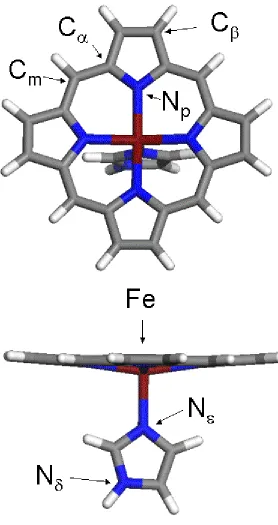
Figure 7. Figure 7. A representation of ferric iron porphine used for model DFT calculations.
The identities of key atoms in the structure are given for reference with the text….…… 61
CHAPTER 3
Figure 1. ESR data collected using DHPi (4.8 mg/ml beads), HPA (2 mM), and H2O2 (100
uM) at pH 7.0. ESR spectra were collected using the DHPi. and averaged for 14 minutes.
ESR data was collected using the following conditions: Bruker EMX equipped with SHQ
cavity, 9.78 GHz microwave frequency, 20 mW microwave power, 100 kHz modulation
amplitude of 0.5 G, 82 ms conversion time, 163 ms time constant, sweep time of 84 s, and an
average of 10 scans per spectrum……… 74
Figure 2. Average of the first 4 2,4,6-triflourophenoxyl radical signals generated by DHP.
The inset shows the main component of SVD analysis of TFP phenoxyl radical signal
generated by DHP and collected as a function of time. ……… 75
Figure 3. TFP phenoxyl radical signal generated by DHP spectra was collected in sequential
order 1 to 5 at a constant flow rate, 2 mL/minute, of 1mM TFP and 1 mM H2O2, each sweep
takes 84 s. DHP produces TFP phenoxyl radical for only ~ 3-5 min before the TFP phenoxyl
gone. The numbering of spectra represents the different sweeps of the same DHPi with
constant flow rate. Number 1 was completed after 84 s, number 2 was collected from 85-168
s, 3 from 169-252s, 4 from 253-420 s and 5 from 421-504 s……… 76
Figure 4. Rate of the TBP consumption derived by absorbance at 316 nm before and after
the 2,4,6-tribromophenol/H2O2 flow solution has been exposed to the immobilized DHP. 77
Figure 5. The TFP phenoxyl radical signal generated by Mb. The TFP phenoxyl radical
signal is time stable. The inset shows the SVD analysis main component of Mb generated
TFP phenoxyl radical. The SVD component is fitted to a single exponential fit resulting in a
Kobs of 20 ms……….. 78
Figure 6. Radical signals generated by HRP at different flow rates. Species A is the same
TFP phenoxy radical that is seen in reactions with DHP and Mb………..… 79
CHAPTER 4
Figure 1. Absorption Soret spectra of high spin ferric DHP in 100 mM phosphate buffer, pH 6.0 at room temperature. Soret maximum for the ferric DHP is 406 nm with no changes due to the addition of 2,4,6-tribromophenol. B. The Q-bands and charge transfer bands of ferric DHP are shown……… 87 Figure 2. The field-swept EPR spectra of 2,4,6-tribromophenol, TBP, bound ferric DHP
(solid) and ferric DHP (dotted). Conditions: temperature 4.5 K; microwave frequency,
9.44955GHz, micorwae power 10 mW, modulation amplitude 5 G and 6.0 pH and buffer 100
mM citrate……… 92
Figure 3. Determination of the heme iron zero-field splitting in ferric DHP and ferric DHP
with 2,4,6-tribromophenol bound. The open squares show a temperature dependence of the
CHAPTER 5
Figure 1. Soret spectra of DHP and DHP with TBP. Notice there is not change in the
position of the Soret Band. ……… 97
Figure 2. Absorption Soret spectra of high spin ferric DHP (solid) and ferric DHP with
fluoride ligand (dash) in 100 mM phosphate buffer, pH 6.0 at room temperature. Soret
maxima for both the ferric DHP and ferric DHP-F are 406 nm with small differences in the
bandwidths. B. The Q-bands and charge transfer bands of ferric DHP and ferric DHP-F are
shown. ……….……… 104
Figure 3. The pH dependence of F- binding. Each assay was preformed in 100mM buffer,
citrate pH’s 5.0 and 6.0 or phosphate pHs 7.0 and 8.0. Binding constants for DHP are 167,
172, 110 and 96 µM-1 for pH 5.0, 6.0, 7.0 and 8.0.………. 105
Figure 4. Binding of F- to DHP at pH 5.0, 6.0, 7.0 and 8.0 in the presence of 530 μM
2,4,6-tribromophenol. Binding constants of 278, 107, 136 and 171 µM-1 were obtained for pH 5.0,
6.0, 7.0 and 8.0, respectively……….……… 106
Figure 5. Binding of F- to DHP at pH 5.0, 6.0, 7.0 and 8.0 in the presence of 530 μM
2,4,6-trichlorophenol. Binding constants of 62, 81, 118 and 93 µM-1 were obtained for pH 5.0,
6.0, 7.0 and 8.0, respectively……… 107
Figure 6. Binding of F- to DHP at pH 5.0, 6.0, 7.0 and 8.0 in the presence of 530 μM
2,4,6-trifluorophenol. Binding constants of 127, 129, 159 and 97 µM-1 were obtained for pH 5.0,
Figure 7. Binding of F- to DHP at pH 5.0, 6.0, 7.0 and 8.0 in the presence of 530 μM
4-hydroxyphenyl acetic acid. Binding constants of 200, 222, 267 and 102 M-1 were obtained
for pH 5.0, 6.0, 7.0 and 8.0, respectively………..………… 108
Figure 8. Binding of F- to DHP at pH 5.0, 6.0, 7.0 and 8.0 in the presence of 530 μM
n-acetyl-L-tyrosine. Binding constants of 213, 269, 249 and 159 M-1 were obtained for pH 5.0,
6.0, 7.0 and 8.0, respectively……….….. 108
Figure 9 the binding of cyanide to ferric DHP with (dashed) and without (solid) TBP
present………... 109
Figure 10. The binding of cyanide to ferric DHP with (dashed) and without (solid) TBP
present……….. 110
Figure 11. Hill plot for the binding of fluoride to ferric DHP at pH 5.0. The Hill coefficient
was determined from the slope to be 0.92………..………. 110
Figure 12. Hill plot for the binding of fluoride to ferric DHP at pH 6.0. The Hill coefficient
was determined from the slope to be 0.85……… 111
Figure 13. Hill plot for the binding of fluoride to ferric DHP at pH 7.0. The Hill coefficient
was determined from the slope to be 0.84……….………. 111
Figure 14. Hill plot for the binding of fluoride to ferric DHP at pH 8.0. The Hill coefficient
was determined from the slope to be 1.03 and 0.43……….……….. 112
Figure 15. Hill plot for the binding of fluoride to ferric DHP in the presence of 100 molar
excess TBP at pH 5.0. The Hill coefficient was determined from the slope to be
Figure 16. Hill plot for the binding of fluoride to ferric DHP in the presence of 100 molar
excess TBP at pH 6.0. The Hill coefficient was determined from the slope to be
0.94………...… 113
Figure 17. Hill plot for the binding of fluoride to ferric DHP in the presence of 10 molar
excess TBP at pH 6.0. The Hill coefficient was determined from the slope to be
0.77………...… 113
Figure 18. Hill plot for the binding of fluoride to ferric DHP in the presence of equal molar
TBP at pH 6.0. The Hill coefficient was determined from the slope to be
0.77………. 114
Figure 19. Hill plot for the binding of fluoride to ferric DHP in the presence of 100 molar
excess TBP at pH 7.0. The Hill coefficient was determined from the slope to be
0.73……….. 114
Figure 20. Hill plot for the binding of fluoride to ferric DHP in the presence of equal molar
TBP at pH 7.0. The Hill coefficient was determined from the slope to be
0.64……….… 115
Figure 21. Hill plot for the binding of fluoride to ferric DHP in the presence of 100 molar
excess TBP at pH 8.0. The Hill coefficient was determined from the slope to be 1.16 and
0.47……….. 115
Figure 22. Hill plot for the binding of fluoride to ferric DHP in the presence of 100 molar
excess TCP at pH 5.0. The Hill coefficient was determined from the slope to be
Figure 23. Hill plot for the binding of fluoride to ferric DHP in the presence of 100 molar
excess TCP at pH 6.0. The Hill coefficient was determined from the slope to be
0.87………. 116
Figure 24. Hill plot for the binding of fluoride to ferric DHP in the presence of 100 molar
excess TCP at pH 7.0. The Hill coefficient was determined from the slope to be
0.76……….. 117
Figure 25. Hill plot for the binding of fluoride to ferric DHP in the presence of 100 molar
excess TCP at pH 8.0. The Hill coefficient was determined from the slope to be
0.87………. 117
Figure 26. Hill plot for the binding of fluoride to ferric DHP in the presence of 100 molar
excess TFP at pH 5.0. The Hill coefficient was determined from the slope to be
0.84………. 118
Figure 27. Hill plot for the binding of fluoride to ferric DHP in the presence of 100 molar
excess TFP at pH 6.0. The Hill coefficient was determined from the slope to be
0.77………. 118
Figure 28. Hill plot for the binding of fluoride to ferric DHP in the presence of 100 molar
excess TFP at pH 7.0. The Hill coefficient was determined from the slope to be
0.68……….. 119
Figure 29. Hill plot for the binding of fluoride to ferric DHP in the presence of 100 molar
excess TFP at pH 8.0. The Hill coefficient was determined from the slope to be
Figure 30. Hill plot for the binding of fluoride to ferric DHP in the presence of 100 molar
excess HPA at pH 5.0. The Hill coefficient was determined from the slope to be
0.73……….. 120
Figure 31. Hill plot for the binding of fluoride to ferric DHP in the presence of 100 molar
excess HPA at pH 6.0. The Hill coefficient was determined from the slope to be
0.69………. 120
Figure 32. Hill plot for the binding of fluoride to ferric DHP in the presence of 100 molar
excess HPA at pH 7.0. The Hill coefficient was determined from the slope to be
0.84………. 121
Figure 33. Hill plot for the binding of fluoride to ferric DHP in the presence of 100 molar
excess HPA at pH 8.0. The Hill coefficient was determined from the slope to be
0.65……… 121
Figure 34. Hill plot for the binding of fluoride to ferric DHP in the presence of 100 molar
excess NAY at pH 5.0. The Hill coefficient was determined from the slope to be
0.80……….. 122
Figure 35. Hill plot for the binding of fluoride to ferric DHP in the presence of 100 molar
excess NAY at pH 6.0. The Hill coefficient was determined from the slope to be
0.80……….. 122
Figure 36. Hill plot for the binding of fluoride to ferric DHP in the presence of 100 molar
excess NAY at pH 7.0. The Hill coefficient was determined from the slope to be
Figure 37. Hill plot for the binding of fluoride to ferric DHP in the presence of 100 molar
excess NAY at pH 8.0. The Hill coefficient was determined from the slope to be
0.75………... 123
Figure 38 results from binding assays of fluoride to Mb (A), HRP (B), and DHP (C) with and
without TBP. Reaction conditions are 100 mM citrate pH 6.0 and 100 molar excess TBP or
0 TBP at 20oC……… 125
Figure 39. Hill plot for the binding of cyanide to ferric at pH 6.0. The Hill coefficient was
determined from the slope to be 2.6069 and 1.3189………. 126
Figure 40. Hill plot for the binding of cyanide to ferric DHP in the presence of 100 molar
excess TBP at pH 6.0. The Hill coefficient was determined from the slope to be 1.4492,
2.2188 and 5.6848……… 126
CHAPTER 6
Figure 1 Varied scan rates for DHP oxygen present sample using a gold electrode with a
SAM (-oh/cooh termination). Diffusion redox potential of DHP is 220 mV vs. Ag/AgCl
reference electrode. ……… 133
Figure 2 shows the decrease in the current caused by deoxygenation of the DHP protein
solution. The red CV was collected before the argon flow was started and the black CV was
collected after the argon had been exposed to the cell for 10 minutes. The redox potential of
Figure 3 Data obtaind from a spectroelectrochemical (SEC) experiment using gold minigrid
as the working electrode. The initial spectra, thick line blue, is of oxyDHP. The red spectra
is deoxyDHP. SEC was preformed by Dr. Rocha and Dr. Rein at Los Alamos National
Laboratory by holding the potential at -200 mV and collecting UV-Visible spectra every 10
minutes……… 135
Figure 4 shows the redox potential of DHP as a function of TBP concentration. All data
were collected in the presence of oxygen……… 136
Figure 5 Cyclic voltammetry of DHP and DHP with 2,4,6-tribromophenol bound in a 1:1
molar ratio. The redox potential of DHP at pH 5.0 was determined to be +220 mV and +312
mV for the substrate bound form both vs. SHE……… 136
APPENDIX
Figure S1. Myoglobin titration to determine the pKa of the acid-alkaline transition. The pKa
from the fit to the data is 9.55……….……… 140
Figure S2. Horseradish peroxidase titration to determine the pKa of the acid-alkaline
Introduction
One of the fundamental paradigms in the biosciences is the relationship between
the three dimensional structure and the function of proteins. This paradigm is at the heart
of understanding the molecular mechanism of enzyme activation. Little is known about
the molecular mechanisms of enzyme activation for dehaloperoxidase (DHP), a
hemoglobin with peroxidase activity. Enzymes undergo fluctuations in structure which
facilitate substrate binding; the changes in the active site result in a favorable electrostatic
environment necessary for conversion of reactants to products.1 The following chapters
contain an initial spectroscopic characterization of the function and the mechanism of
dehaloperoxidase. In addition to studying the basic properties of the heme iron in the
active site we also function on the effect of substrate binding.
DHP lies in a unique junction within the structure function relationships of heme
proteins since it has a globin fold and peroxidase activity. Much is known about
myoglobin, Mb, and horseradish peroxidase, HRP, both of which were used as
comparisons in the study of DHP. Mb is an oxygen storage protein with a globin fold.
HRP is a peroxidase that oxidizes substrates in one-electron transfers at the heme edge.
HRP is capable of a two-electron oxidation leading to the same products as DHP,
however, this would occur by sequential one-electron oxidation reactions.5 Although
DHP and HRP both can carry out peroxidase chemistry, the structure of HRP differs
significantly from that of DHP. On the other hand, Mb and DHP are structural homologs.
Mb and DHP have eight alpha helixes arranged in the same 3D structure around an iron
containing protoporphyrin IX; X-ray structures for both are available.2-4 Both Mb and
the model globin protein used in the characterization of protein fluctuations due to
diatomic ligand binding. DHP provides a unique opportunity to study fluctuation in
enzyme structure as result of an actual enzymatic process as well as the fluctuation
related to a carrier protein.
The novelty of DHP extends to the presence of a substrate-binding pocket2, which
is not present in Mb or HRP. Since DHP has two distinctly different functions, the study
of how the molecular fluctuations occur to form an active enzyme has the potential to
explain the structure function relationship in a dual-function enzyme. This has been
accomplished using resonant Raman, electroparamagnetic resonance (EPR) and UV-vis
binding assays. The spectroscopic characterization of recombinant dehaloperoxidase
from Amphitrite ornata is the focus of the work that follows.
Background. Amphitrite ornata is a sedentary, surface deposit feeding polychaete
worm in the family Terelebridae. A. ornata is common along the east coast of North
America from Cape Cod, Massachusetts6 to South Carolina.7 A. ornata grows to lengths
of 8-20 cm in intertidal sands or sandy muds where it forms U-shaped (flat bottomed U)
tubes or burrows with an internal diameter of 0.5-1.0 cm.8,9 Both ends of the burrows
reach the surface of the water or air at low tide. The ends of the tubes are surrounded by
sediment that results from tube formation and feeding.8,10
Elevated levels of biological activity around the burrows were attributed to A. ornata’s ability to gather organic material via tentacles for feeding.10 Studies by
researchers in South Carolina have shown that A. ornata has the ability to dehalogenate
phenols is both natural and a result of human contamination (agriculture, industry and
urban runoff).7 The United States Environmental Protection Agency, EPA, lists
chlorinated phenol as a prevalent pollutant related to human, plant and environmental
health concerns.11 Removing chlorinated phenols by bioremediation is a potential use of
DHP.
The peroxidase activity of DHP is a likely result of necessity since A. ornata
inhabits an environment that contains halogenated phenols. A. ornata shares habitat with Notomastus lobatus a marine organism that biogenically produces halogenated
metabolites.12 Due to the structural similarities between Mb and DHP, a working
hypothesis is that DHP was originally a globin that carried oxygen, and the peroxidase
activity of DHP evolved in response to environmental pressures. The genes that code for
DHP were sequenced and it was determined that DHP is coded by multiple alleles (DHP
I is coded by dhpa, GenBank accession number AF284381 and DHP II is coded by dhpb,
GenBank accession number AF285090).12
Literature Summary. Biological, biochemical and structural characterization of the
oxygen carrying globin of A. ornata was performed by the laboratory of Dr. Joseph
Bonaventura from the mid 1970’s to the mid 1980’s.13-16 Respiratory hemoproteins of A. ornata are divided into two classes, coelomic hemoglobins and erythrocruorins.
Coelomic hemoglobins are characterized as low molecular weight proteins that occur in
the poorly circulated bodily fluid and erythrocruorins are the globins dissolved in
vascular fluids.13 The coelomic hemoglobin acts as a small oxygen reserve that could
sustain life for approximately 10 minutes and is reported to have a P50 = 2.72 mm Hg at
concentration of the globin is responsible for the lack of oxygen reserve character of the
coelomic fluid.13
The coelomic hemoglobin is described as a monomeric protein with a molecular
weight reported to be in the range of 11,000 – 12,200 Da, as determined by
SDS-PAGE.14 The erythrocruorin was reported to have a molecular weight of ~15,000 Da
with occasional upper molecular weight bands of varying concentrations.14,15 The
presence of two different proteins that serve as the oxygen carrying globins was later
confirmed by genetic sequencing that resulted in two genes for DHP, dhpa and dhpb.7
The molecular weight according to the DNA sequence of the protein that results from
dhpa is 15,472 Da and the protein that results from dhpb is 15,379 Da.
Identification of the A. ornata erythrocruorin or coelomic hemoglobin as DHP is
still speculative. The amino acid composition of A. ornata erythrocruorin was
determined by an automatic sequencer that relied on the Edman degradation method.16
The derived amino acid sequence similarities are comparable to the known sequence of
DHP.7,12 However, the exact sequence and amino acid composition are still unknown for
A. ornata erythrocruorin and coelomic hemoglobin thus it is not possible to assign as
either DHP I (dhpa) or DHP II (dhpb). Studies of A. ornata erythrocruorin is comparable
to work on DHP (I). Carbon monoxide (CO) binding coefficients were independently
determined for both A. ornata erythrocruorin14 and DHP 17. DHP and A. ornata
erythrocruorin are reported to have CO binding coefficients of 9.8 x 10⁵ M-1S-1, at pH
8.017 and 7.5 x 10⁵ M-1S-1, at pH 7.0 respectively.14 The oxygen affinity of
A. ornata
iron for two moles of protein subunit.15,7 However, in spite these reports there is an x-ray
crystal structure for the sequence corresponding to dhp (I) that shows two iron atoms per
dimeric hemoglobin.
Both globins and peroxidases have a histidine residue as the proximal ligand.
However, the nature of the hydrogen bonding is very different.19 Proximal heme ligation
was examined via FTIR and RR spectroscopy to conclude that DHP has a typical globin
proximal ligand. The proximal ligand of DHP is His 89, and according to the RR spectra
the νFe-His for DHP is at 233 cm-1.18 DHP νFe-His is higher than typical globins yet lower
than the range for strongly polarized histidines in peroxidases.18-20 The FTIR spectra of
the CO ligated DHP shows a peak at 1951 cm-1, the position of this CO peak is in the
range found for heme proteins that have neutral His proximal ligands typical of globins.18
In chapter two of this thesis I will present RR data that will further confirm that the
proximal ligation in DHP is not typical for either globins or peroxidases, but rather it is in
between the two.
Distal heme ligation is of central interest. The distal side of the heme is where the
substrate binds. I would like to distinguish between the distal pocket itself, which is what
surrounds the iron and the substrate-binding pocket. Admittedly, the two binding sits
overlap. According to the crystal structures of DHP, the iron heme is 5-coordinate
however UV-vis, RR, and X-band EPR data will be presented that indicate that a water
molecule is at the sixth coordination site. Magnetic circular dichroism spectroscopy,
MCD, experiments provided evidence that the crystal structure was missing a water
as the sixth ligand was confirmed by UV-Vis experiments where the structure of the
Q-bands showed the presence of a sixth ligand.17
The available data suggest that DHP is a coelomic hemoglobin rather than the
erythrocruorin of A. ornata. 15,17,18 The isoelectric point, (pI), of A. ornata erythrocruorin
is reported as 5.0 in the presence of 1 mM CaCl2,15 the pI of DHP is reported as 4.017 in
the absence of additional calcium ions. The Soret peak for the deoxy species of DHP is
observed at 432 nm, which corresponds to the coelomic hemoglobin. 18 The deoxy
species of A. ornata erythrocruorin is observed at 430 nm.15
Enzymatic activity catalyzed by DHP to oxidatively dehalogenate halo-phenols
may have bioremediation applications. DHP’s ability to dehalogenate halogenated
substrates has been the focus of recent literature.2,3,5,7,21 DHP has been studied by X-ray
crystallography, UV-Visible, magnetic circular dichroism, transient absorption (TA)
pump-probe spectroscopy, Resonance Raman, and Fourier transform infrared
spectroscopy. The following experimental techniques confirm that DHP is a globin and
a peroxidase. Characterization of the DHP heme active site has led to unique
observations. The isolation and crystallization of DHP revealed an α-helical protein with
a protoprophyrin IX prosthetic group 2,3 consistent with the role of DHP as a hemoglobin
of A. ornata. The presence of a substrate binding site was revealed in the second crystal
structure, in which 4-iodiophenol was used as a substrate analog.2 The presence of the
substrate binding site causes the distal ligating residue, His 55, to move to a
solvent-exposed position. This new position of the distal His is of central focus when studying
multicolor transient absorption (TA) pump-probe spectroscopy.22 The TA experiments
concluded that the hydrophobic active of DHP resulted in a slower recombination rate of
photolysis ligands similar to the viscosity effect seen in the myoglobin mutant H64V.22
The H64V mutant of myoglobin has a hydrophobic active site similar to DHP. The
hydrophobic active site allows for the binding of hydrophobic substrates. This tells us
that the heme active site has been designed as a compromise between globin and
peroxidase.
A. ornata’s ability to dehalogenate phenols by oxidative dehalogenation is
facilitated by the enzyme dehaloperoxidase, DHP. Products of enzymatic activity of
DHP on 2,4,6-tribromophenol (TBP) and 2,4,6-trichlorophenol (TCP) were studied by
mass spectrometry.7 The products were identified as 2,6-dihalogenated quinones, thus
indicating the removal of the para halogen and the addition of one oxygen.2 The reaction
is shown in Scheme 1.
O
-XX X
+ H2O2
X X
O
O
+ H2O + X
DHP(X = I, Br, Cl, F)
Note that the reaction shown is for the phenolate form of the substrate since this is the
form of TBP and TCP present at pH 7.4, which is thought to be the physiologically
relevant pH. The binding of substrate has been identified as a trigger for peroxidase
activity in DHP. Stopped flow assays showed that greater peroxidase activity was
achieved when substrate was introduced to the protein before activation with peroxide.5
Substrate binding facilitates a spin state population shift from low spin (S = 1/2) to high
Although DHP is classified as a peroxidase there are a number of features that
suggest that DHP may represent a novel class of heme enzymes. One such characteristic
is the substrate-binding site on the distal side of the heme iron. Substrate binding sites are
known in the cytochrome P450 superfamily, but not in the peroxidase family of enzymes.
Typical peroxidases react via an edge-binding mechanism. DHP is one of the smallest
known heme enzymes. The order of activation for DHP is unique in comparison to
known peroxidases. The triggering of DHP to switch from a globin to a peroxidase is
unique. All the features of DHP point to DHP being a dual function protein globin and
peroxidase.
The following chapters explore the mechanism of activation of DHP. Resonance
Raman (RR), electron pair resonance (EPR), X-band EPR, UV-Visible spectroscopy and
electrochemistry are employed to detail the heme active site in DHP. The
aforementioned techniques lead to detailed spin state of the iron heme in DHP, effects of
ligation of anionic ligands on the spin state, substrate binding effects on spin state and
substrate binding effects on visible spectra, substrate binding effects on redox potential
and the substrate binding effects on product formation.
Protein function as illustrated by oxygen-binding proteins: a review of myoglobin and hemoglobin.
The two x-ray crystal structures of DHP provide information about the static
three-dimensional structure. From the crystal structures, His 55 is shown to occupy two
conformations. An internal substrate-binding site adjacent to the distal pocket of the
confirmations assumed by the distal His and ligation of the proximal His to the iron.
DHP diverges from Mb in structure by formation of the substrate-binding site.
There is a great deal of information contained in the three-dimensional structure
of a protein. However, the static structure at any one time is a snapshot of the protein and
does not reflect its dynamic nature. Proteins function by changing conformation.
Specifically His 55 must swing out to the solvent to allow substrate to bind, neighboring
residues must move to allow for the substrate and intermediates in the oxidation reactions
must be accommodated this includes the one electron oxidation product that is a radical
and the changes in the oxidation state of the iron. Thus, understanding the dynamics of
protein structural changes is key to understanding how the protein facilitates its
function.23, 24
What follows is a short exploration of protein function and its relationship to
dynamic protein structure. The discussion will be developed using the oxygen-binding
proteins myoglobin and hemoglobins as examples. Both myoglobin and hemoglobin are
well-studied oxygen carrier proteins that have solved three-dimensional structures.
Since the focus of the research in the following chapters is centered on the
substrate-binding site of DHP, it is necessary to define a few terms and concepts that will
be used throughout the thesis. Protein function involves the binding of molecules called
ligands. A ligand is bound at a certain site on the protein referred to as the binding site.
Proteins are not solids they change in conformation and are said to breath or be dynamic
This statement indicates that proteins assume different highly specific conformations that
are critical to function.24 When a protein catalyzes transformation of a molecule, the
product. If the reaction with a substrate occurs in a localized location in the protein
where the substrate is bound, the area is called a substrate-binding site or active site. A
co-substrate is a second substrate that must be present to aid in the reaction between the
enzyme and substrate.
Oxygen is a highly reactive molecule that serves as a ligand for ferrous heme
proteins, and specifically for myoglobins and hemoglobins. There are no amino acids
that can reversible bind oxygen. Therefore, nature has developed prosthetic groups called
hemes that utilize iron or other centers that use transition metals such as iron and copper
to bind oxygen.23 Heme is a protoporphyrin IX ring bound to an iron. Four nitrogen
atoms of the porphyrin ring bind the iron forming the porphyrin plane. Two additional
coordination sites are available on the iron, both are perpendicular to the plane of the
heme. 23 Heme is the prosthetic group of myoglobins, hemoglobin, DHP and HRP and is
pictured in figure 1.
Oxygen binding occurs at one of the two coordination sites perpendicular to the
plane of the heme. The second of the two sites is bound by a His residue (93 for Mb and
89 for DHP). Each oxygen-binding site is a separate iron containing heme, since Mb is a
monomer Mb has one oxygen-binding group DHP has two and Hb has four. Oxygen
binding is a key function for all three proteins.25
Human myoglobin is a single polypeptide chain of 153 amino acid residues folded
into eight α helical segments labeled A-H. Approximately 78% of the amino acid
residues are in α helices. Human hemoglobin is a tetrameric protein, containing four
heme prosthetic groups comprised of two α and two β subunits each with 141 and 146
residues, respectively. The structure of Hb is similar to Mb however, adult human α
subunit of Hb lacks the short D helix.26
Ligand binding.
The function of a globin is to reversibly bind oxygen in the ferrous form.
However, both myoglobin and hemoglobin can bind a variety of other ligands such as
NO, CO in the ferrous form and CN-, N3-, Br-, Cl-, F- etc. in the ferric form. For the
general case we write the following equation:
P + L ↔ PL (1)
where P represents protein, L is a ligand and PL is the ligand bound protein complex.
An association constant of Ka can be expressed as:
Ka = [PL]/[P][L] (2).
Equation 2 can be rearranged to indicate that the ratio bound to free protein should be
directly proportional to the concentration of free ligand:
Binding equilibria are simplified when the concentration of the ligand is much greater
than the concentration of ligand-binding sites, because the binding of the ligand by the
protein does not appreciable change the concentration of free ligand.
Experimental data are often plotted as the fraction bound θ as shown in equation
4.
θ = [PL] / [PL] + [P] (4)
Substituting from equation 3 into equation 4 generates equation 5.
θ = Ka[L]/(Ka[L] +1) (5)
Ka can be determined form a plot of θ vs. the concentration of free ligand. In the case of
Mb, the graph is a hyperbola and 1/Ka (or the dissociation coefficient Kd) is found a θ =
0.5.
For proteins with more than one binding site, we must start with the following
equation 6:
P + nL ↔ PLn (6)
where n is the number of binding sites. The expression for θ is:
θ = [L]n / [L]n + K
d (7)
now rearrange to:
θ / (1 - θ) = [L]n / (K
d) (8)
Take the log of both sides yields the Hill equation:
log (θ / (1 - θ)) = n log [L] – log Kd. (9)
binding. Positive cooperativity means that the binding of one ligand molecule facilitates
the binding of additional ligand molecules. When n = nH the theoretical limit has been
met, thus binding would be completely cooperative thus all binding sites on the protein
are occupied simultaneously. When nH is less than 1, there is negative cooperatively
thus, the binding of one ligand inhibits additional binding other ligands.27
Cooperative binding models.
The first model proposed to explain cooperative binding was the symmetry
model. The symmetry model assumes that the subunits of an allosteric protein are
functionally identical and each can exist in the bound and unbound states. The two
conformations are in equilibrium.28 The second model is the sequential model. The
sequential model assumes that ligand binding can induce a change of conformation in an
individual subunit.29 The conformational change in one subunit makes a similar change
in another subunit more likely, thus binding of one ligand lowers the energy barrier for
the binding of a second ligand. The symmetry model is viewed as the lower and upper
limit of the sequential model.29
When the pH of the solution effects the binding of a ligand this is termed the Bohr
effect.30 The binding of Hb to oxygen is more complicated than:
Hb + O2↔ HbO2 (10).
The true equation is proton dependent thus should be written as:
HHb+ + O2↔ HbO2 + H+ (11).
When determining the Kd or Ka for a protein and ligand the effects of pH must be
Peroxidase: general overview of catalytic cycle
The heme peroxidase superfamily has members from many different sources.
While a diverse superfamily, similarities exist and most notably the activation or
formation of compound I. Compound I is formed by oxidation of the native ferric,
Fe(III), by hydrogen peroxide forming a water molecule as shown in scheme 2.4
Scheme 2. The formation of Compound I from ferric protein and hydrogen peroxide.
Compound I is an oxoferryl species and the oxygen atom originates from the hydrogen
peroxide. Compound I reacts with a wide array of substrates by 1-electron oxidation
producing a radical product and elimination of the ferryl porphyrin π – cation radical to
generate compound II as shown in scheme 3.4 Compound II then reacts with substrate to
regenerate the resting ferric protein and an additional radical product, as shown in scheme
4. The radicals can polymerize or become substrates in reactions with compounds I or
Scheme 3. One-electron oxidation of substrate (AH) by compound I resulting in compound II and a radical product (Ay).
Resonance Raman Spectroscopy
C. V. Raman and K. S. Krishnan observed that a small portion of light scattered
by a sample is changed in wavelength. 31 This process has become known as Raman
scattering. Raman scattered light is observed when a light is passed through a sample
producing an inelastic scattering event between the molecules of the sample and photons.
Inelastic scattering results when the photon absorbs or releases energy from or to the
sample that it collides with. Most of the light experiences elastic scattering and is
referred to as Rayleigh scattering.
Inelastic scattering offers a means of probing the Raman active modes of a sample
since energy is conserved, the energy gained or lost by the photon must equal the energy
lost or gained by the sample. A resonance Raman spectrum is obtained when the
excitation source has the same wavelength as an electronic absorption band of a
chromophore. When this condition is met, an intensity enhancement of certain Raman
bands occur that are related to the electronic absorption band. The intensity increase of
the Raman bands can be several orders of magnitude. In biological samples resonance
Raman is particularly useful for the study of visible chromophores, such as heme. Since
the scattering of visible light by chromophores is many orders of magnitude greater than
the scattering due to amino acids of the protein. For heme, which has an extinction
coefficient of 9.3 mM-1 cm-1 in the ferric form, adequate Raman scattering can be
obtained at concentrations of 50 µM or greater. Thus, Raman activity of the sample can
The structure and vibrations of the heme chromophore
Figure 1 shows iron protoporphyrin IX, or heme. In this example ferric heme has
Fe 3+ bound in the center of the heme by four pyrrole nitrogens that define the porphine
cavity. The most studied Raman active vibrations of the heme group are the axial
vibrations such as the Fe-His stretching mode (deoxy), Fe-C stretching mode and C-O
stretching (carbonmonoxy), vinyl stretching modes, the core size marker modes, and the
electron density marker mode. In fact, there is information from other vibrational modes
and the complete assignments are available.32
Core size determination of DHP adducts using Resonance Raman.
This experiment was conducted in order to determine the spin state of the heme
iron. The size of the metal cation causes reorganization of the macrocycle, for instance a
large metal ion will be forced out of the heme plane in what is known as a domed
structure. When a small ion is at the center of the macrocycle the bond between the
nitrogens and the metal are longer and thus weaker and the metal will be in the heme
plane. The spin state of the iron dictates the size of the atom, ferrous is larger than ferric
which is larger than ferryl. The following empirical relationship exists between the
vibrational frequency of a porphyrin mode and the size of the cavity:33
(12)
where K (cm-1/Å) and A (cm-1) are empirical constants that vary for different porphyrins,
and d is the average metal nitrogen bond distance in Å. There are several core size
marker modes each with a different K value. The larger the K value, the more sensitive
Electron Spin Resonance (ESR)
The iron in protoporphyrin IX is bound by four pyrrole nitrogens in a square
planar arrangement that has 4-fold symmetry. The protoporphyrin IX embedded in a
protein acts as scaffolding, enforcing geometry constraints on the heme. Interactions of
the protein by perturbations of the π-electron distribution of the heme or by π-electron
binding of ligands to the iron at the fifth and/or sixth coordination sites of the
protoporphyrin IX. The departure from tetragonal symmetry are measurements of the
protein or ligand interactions with the protoporphyrin IX and are measured by differences
in the EPR spectra. Moreover, the different geometries of the ferric protoporphyrin IX in
dehaloperoxidase with and without the substrate 2,4,6-tribromophenol bound can be
studied by X-band EPR to determine the effect of bound substrate on the heme iron spin
state.
The zero-field splitting as the name implies is present in the environment of the
heme iron even the absence of an external magnetic field. The zero-field states are
separated by the energy splittings of a few wave numbers, and when expressed in terms
of the axial zero-field splitting parameter D the energy differences are 2D, and 4D
between the lowest, middle and highest Kramers doublets. Using X-band EPR we can
measure the contributions from low spin and high spin heme iron. Using the temperature
dependence of the high spin component we can determine the zero-field splitting
parameter, D, in ferric and ferric substrate bound DHP.
The energy separation between the three Kramers doublets in the high-spin ferric
and ferrous heme can be approximated by the zero-field parameters D and E of the spin
Hamiltonian.2 The parameters D and E describe axial and rhombic distortion from the
tetragonal symmetry, respectively. The ratio E/D for high-spin ferric heme can be
determined from splitting of the EPR signal at g = 6.0.33-36
The characteristics of the EPR spectrum were used to describe the symmetry of
the heme. Transitions from the ground state to the lowest Kramers doublets results in
absorptions extending from g ≅ 6, g ≅ 4, and g ≅ 2. The EPR spectrum arises from
absorption between energy levels with an effective spin of S = ½, thus the unpaired
electrons are sensitive toward axial and rhombic symmetry elements. The axial
symmetry element is tetragonal due to the 4-fold symmetry of the pyrrole nitrogens. The
spread of the absorption between g = 6 and g = 2 is credited to the large value of the
tetragonal field. The decrease of distortion from tetragonal to rhombic symmetry is
quantitatively expressed by the zero field splitting parameters D and E, which are defined
by the spin Hamiltonian equation 13.37
= βH·g·S + D[Sz2 – S(S + 1)/3] + E(Sx2 – Sy2) (13)
The zero-field splitting of the heme in DHP and DHP-TBP were determined by
measuring the integrated intensity of the heme iron gx EPR transition as the function of
temperature. Only the │5/2, -1/2> │5/2, +1/2> transition is observed thus populations
in the Ms = ±3/2, ±5/2 doublets reduce the signal intensity of the observed, transitions.
Data collected as a function of temperature was fit by equation 14. 38
S(T) = N(1 - e-θ/T) . (14)
where S(T) is the integrated EPR signal intensity, θ is the Zeeman splitting hυ/kB = 0.44
K, D is the zero-field splitting parameter, and N is an overall scale factor. When D is
positive, the doublet │5/2, ±3/2> lies 2D above the ground state doublet │5/2, ±5/2> is
4D above the │5/2, ±3/2> doublet in the absence of an external magnetic field.
Anionic ligands bind to DHP
Anionic ligand binding to ferric DHP is characterized by the formation of a
charge transfer band or a shift in the Soret band for fluoride and cyanide binding
respectively. The binding of fluoride does not show cooperativities. The binding of
fluoride to ferric DHP results in the displacement of a weakly bound water molecule for a
weakly bound fluoride. Both forms of DHP are high spin thus the displacement of one
weak ligand for another weak ligand does not result in a shift in the Soret band. Binding
of cyanide to ferric DHP results in the displacement of water for a strong ligand thus
DHP becomes low spin. The binding of the cyanide is cooperative and similar to the
References
1. Eisenmesser, E. Z.; Millet, O.; Labeikovsky, W.; Korzhnev, D. M.; Wolf-Watz, M.; Bosco, D. A.; Skalicky, J. J.; Kay, L. E.; Kern, D. Intrinsic dynamics of an enzyme underlies catalysis. Nature (London, United Kingdom) (2005),
438(7064), 117-121.
2. LaCount, Michael W.; Zhang, Erli; Chen, Yung Pin; Han, Kaiping; Whitton, Margaret M.; Lincoln, David E.; Woodin, Sarah A.; Lebioda, Lukasz. The crystal structure and amino acid sequence of dehaloperoxidase from Amphitrite ornata indicate common ancestry with globins. Journal of
Biological Chemistry (2000), 275(25), 18712-18716.
3. Zhang, E.; Chen, Y-P.; Roach, M. P.; Lincoln, D. E.; Lovell, C. R.; Woodin, S. A.; Dawson, J. H.; Lebioda, L. Crystallization and initial spectroscopic characterization of the heme-containing dehaloperoxidase from the marine polychaete Amphitrite ornata. Acta Crystallographica, Section D:
Biological Crystallography (1996), D52(6), 1191-1193.
4. Dunford, H. B. Heme Peroxidases, Wiley-VCH, New York, 1993
5. Belyea, J.; Gilvey, L. B.; Davis, M. F.; Godek, M.; Sit, T. L.; Lommel, S. A.; Franzen, S. Enzyme function of the globin dehaloperoxidase from
amphitrite ornata Is activated by substrate binding. Biochemistry (2005),
44(48), 15637-15644.
6. Pettibone, N. H. Marine polychaete worms of the New England region. 1. Aphroditidae through Trochaetidae. U.S. National. Museum Bulletion (1963),
227, 1-356.
7. Chen, Y-P.; Woodin, S. A.; Lincoln, D. E.; Lovell, C. R. An unusual dehalogenating peroxidase from the marine terebellid polychaete Amphitrite ornata. Journal of Biological Chemistry (1996), 271(9), 4609-12.
8. Linville, H. R. The natural history of some tube-forming annelids (Amphitrite ornata, Diopatra cuprea), Holt, New York, 1903, 227-235.
9. Scott, J. W. Some egg-laying habits of Amphitrite ornata. Verrill. Biological
Bulletin (1909), 17, 327-340.
10. Rhoads, D. C. Biogenic graded bedding. Journal of Sediment Pet (1967), 35,
956-963.
12. Franzen, S.; Roach, M. P.; Chen, Y-P.; Dyer, R. B.; Woodruff, W. H.; Dawson, J. H. The Unusual Reactivities of Amphitrite ornata Dehaloperoxidase and Notomastus lobatus Chloroperoxidase Do Not Arise from a Histidine Imidazolate Proximal Heme Iron Ligand. Journal of the American Chemical
Society (1998), 120(19), 4658-4661.
13. Mangum, C. P.; Woodin, B. R.; Bonaventura, C.; Sullivan, B.; Bonaventura, J.
Celomic and vascular hemoglobin in the annelid family Terebellidae.
Comparative Biochemistry and Physiology, Part A: Molecular & Integrative Physiology (1975), 51(2A), 281-94.
14. Weber, R. E.; Magnum, C.; Steinman, H.; Bonaventura, C.; Sullivan, B.; Bonaventura, J. Hemoglobins of two terebellid polychetes: Enoplobranchus sanguineus and Amphitrite ornata. Comparative Biochemistry and
Physiology, Part A: Molecular & Integrative Physiology (1977), 56(2A), 87.
15. Chiancone, E.; Brenowitz, M.; Ascoli, F.; Bonaventura, C.; Bonaventura, J.
Amphitrite ornata erythrocruorin. I. Structural properties and characterization of subunit interactions. Biochimica et Biophysica Acta,
Protein Structure (1980), 623(1), 146-62.
16. Fushitani, K.; Bonaventura, J.; Bonaventura, C. Isolation of polypeptide chains with heme from the extracellular hemoglobin of Amphitrite ornata (Polychaeta, Annelida). Comparative Biochemistry and Physiology, Part B:
Biochemistry & Molecular Biology (1986), 84B(1), 137-41.
17. Nienhaus, K.; Deng, P.; Belyea, J.; Franzen, S.; Nienhaus, G. U. Spectroscopic Study of Substrate Binding to the Carbonmonoxy Form of Dehaloperoxidase from Amphitrite ornata. Journal of Physical Chemistry B (2006), 110(26),
13264- 13276.
18. Han, K.; Woodin, S. A.; Lincoln, D. E.; Fielman, K. T.; Ely, B. Amphitrite ornata , a marine worm, contains two dehaloperoxidase genes. Marine
Biotechnology (2001), 3(3), 287-292.
19. Spiro, T. G.; Smulevich, G.; Su, C. Probing protein structure and dynamics with resonance Raman spectroscopy: cytochrome c peroxidase and hemoglobin. Biochemistry (1990), 29(19), 4497-508.
20. Shelnutt, J. A.; Alden, R. G.; Ondrias, M. R. Heme-linked ionizations in horseradish peroxidase detected by Raman difference spectroscopy. Journal
21. Osborne, R. L.; Sumithran, S.; Coggins, M. K.; Chen, Y-P.; Lincoln, D. E.; Dawson, J. H. Spectroscopic characterization of the ferric states of Amphitrite ornata dehaloperoxidase and Notomastus lobatus chloroperoxidase: His-ligated peroxidases with globin-like proximal and distal properties. Journal of Inorganic Biochemistry (2006), 100(5-6),
1108.
22. Franzen, S.; Jasaitis, A.; Belyea, J.; Brewer, S. H.; Casey, R.; MacFarlane, A. W., IV; Stanley, R. J.; Vos, Marten H.; M, J-L. Hydrophobic Distal Pocket Affects NO-Heme Geminate Recombination Dynamics in Dehaloperoxidase and H64V Myoglobin. Journal of Physical Chemistry B (2006), 110(29),
14493.
23. Case, D.A., Karplus, M. Dynamics of ligand binding to heme proteins. J. Mol. Biol. (1979) 132, 343-368.
24. Koshland, D.E., Jr. (1973) Protein shape and biological control. Sci. Am. 229
(Oct.), 52-64.
25. Dickerson, R.E., Geis, I. (1982) Hemoglobin: Structure, Function, Evolution, and Pathology. The Benjamin Publishing Company, Redwood City, CA.
26. Perutz, M.F. (1989) Myoglobin and heamoglobin: role of distal residues in reactions with haem ligands. Trends Biochem. Sci. 14, 42-44.
27. Di Prisco, G., Condo, S.G., Tamburrini, M., Giardina, B. (1991) Oxygen transport in extreme environments. Trends Biochem. Sci. 16, 471-474.
28. Mondo, J., Wyman, J., Changeux, J.P. (1965) On the nature of allosteric transitions: a plausible model. J. Mol. Biol. 12, 88-118.
29. Koshland, D.E., Jr., Nemethy, G., Filmer, D. (1966) Comparison of experimental binding data and theoretical models in proteins containing subunits. Biochemistry 5, 365-385.
30. Ho, C., Russu, I.M. (1987) How much do we know about the Bohr effect of hemoglobin?Biochemistry 26, 6299-6305.
31. Raman, C. V., Krishnam, K. S. A new type of Secondary Radiation. (1928). Nature (London) 121, 501.
32. Spiro, T. G., Resonace Raman Spectra of Heme Matalloproteins. Wiley, New
York, 1988.
33. Peisach, J.; Blumberg, W. E.; Ogawa, S.; Rachmilewitz, E. A.; Oltzik, R..
Effects of protein conformation on the heme symmetry in high spin ferric heme proteins as studied by electron paramagnetic resonance. Journal of
Biological Chemistry (1971), 246(10), 3342-55.
34. Yonetani, T.; Drott, H. R.; Leigh, J. S., Jr.; Reed, G. H.; Waterman, M. R.; Asakura, T. Electromagnetic properties of hemoproteins. III. Electron paramagnetic resonance characteristics of iron(III) and manganese(II) protoporphyrins IX and their apohemoprotein complexes in high spin states.
Journal of Biological Chemistry (1970), 245(11), 2998-3003.
35. Blumberg, W. E.; Peisach, J.; Wittenberg, B. A.; Wittenberg, J. B. Electronic structure of protoheme proteins. I. Electron paramagnetic resonance and optical study of horseradish peroxidase and its derivatives. Journal of
Biological Chemistry (1968), 243(8), 1854-62.
36. Bleaney, B.; Stevens, K. W. H.. Paramagnetic Resonace. Reports on
progeress in physics (1953), 16(1), 108-159.
37. Wittenberg, B. A.; Kampa, L.; Wittenberg, J. B.; Blumberg, W. E.; Peisach, J.
Electronic structure of protoheme proteins. II. Electron paramagnetic resonance and optical study of cyctochrome c peroxidase and its derivatives.
Journal of Biological Chemistry (1968), 243(8), 1863-70.
38. Galli, C.; MacArthur, R.; Abu-Soud, H. M.; Clark, P.; Stuehr, D. J.; Brudvig, G. W. EPR Spectroscopic Characterization of Neuronal NO Synthase.
Abstract
The study of axial ligation by anionic ligands to ferric heme iron by resonant
Raman spectroscopy provides a basis for comparison of the intrinsic electron donor
ability of the proximal histidine in horse heart myoglobin (HHMb), dehaloperoxidase
(DHP) and horseradish peroxidase (HRP). DHP is a dimeric hemoglobin (Hb) originally
isolated from the terebellid polychaete Amphitrite ornata. The monomers are structurally
related to Mb and yet DHP has a peroxidase function. The core size marker modes, ν2
and ν3, were observed using Soret excitation and DHP-X was compared to HHMb-X for
the ligand series, X = F, Cl, Br, SCN, OH, N3, CN. Special attention was paid to the
hydroxide adduct, which is also formed during the catalytic cycle of peroxidases. The
Fe-OH stretching frequency was observed and confirmed by deuteration and is higher in
DHP than in HHMb. The population of high spin states of the heme iron in DHP was
determined to be intermediate between HHMb and HRP. The data provide the first direct
measurement of the effect of axial ligation on the heme iron in DHP. The Raman data
support a modified charge relay in DHP, in which a strongly hydrogen-bonded backbone
carbonyl (>C=O) polarizes the proximal histidine. The charge relay mechanism by
backbone carbonyl >C=O-His-Fe is the analog of the Asp-His-Fe of peroxidases and
Dehaloperoxidase, DHP, is an enzyme native to the terebellid polychaete
Amphitrite ornata that has peroxidase activity and a globin fold.1,2 DHP is a dimeric Hb
consisting of eight α–helices (a-h) and a protoporphyrin IX prosthetic group3,4 with a central metal atom that reversibly binds diatomic ligands such as molecular oxygen (O2),
carbon monoxide (CO), and nitric oxide (NO).5-8 DHP bears a resemblance to dimeric
Hbs such as Ascaris scarpharca Hb9 and cytoglobin.10 However, the dual function of
DHP appears unique in the known evolution of globins.4, 11, 12 The peroxidase activities
of typical globins have been characterized and are known to have turnover numbers that
are more than one hundred times smaller than horseradish peroxidase (HRP).13-16
Recently DHP has been expressed and purified in a recombinant form in E. coli5 and the
enzymatic rate for conversion of trihalogenated phenols to dihalogenated quinone by
DHP is 12 times slower than that of HRP and 13 times faster than that of Horse Heart
myoglobin (HHMb). In spite of the low structural homology with peroxidases, DHP
clearly has a peroxidase function. However, the fact that DHP apparently binds the
substrate in an internal binding site suggests that a two-electron oxidation mechanism is
an important pathway for oxidation of the substrate.3,4
Comparison of the proximal histidine structures of HHMb, DHP, and HRP poses
a question regarding the catalytic mechanism of DHP. DHP resembles a Hb much more
than it does a peroxidase in the hydrogen bonding of the proximal histidine. Specifically,
peroxidases are known to have strong hydrogen bonding to a negatively charged
aspartate.17-22 The recently discovered class of bacterial flavohemoglobins also has a
strong hydrogen bond of the proximal histidine to glutamate.23 This strong hydrogen
The charge relay comprised by the Asp-His-Fe catalytic triad permits higher oxidation
states of iron to be formed consistent with the requirement for the formation of compound
I. DHP lacks this feature, 24 although the proximal histidine of DHP does form a strong
hydrogen bond with the carbonyl group of Leu83.25, 26 This hydrogen bonding does not,
at first, appear significantly different from the bifurcated hydrogen bond in myoglobin
that involves a weak interaction with the lone pair of Ser92 and an interaction with
carbonyl group of Ile89. Attempts to engineer myoglobin by means of the Ser92Asp
mutation that would introduce a charge relay do not produce a significant increase in
peroxidase activity.27, 28 DHP may have evolved a different more subtle charge relay that
permits it to function both as a globin and as a peroxidase. In DHP, the
Leu93-C=O…Nδ-His89 hydrogen bond length is 2.9 Å, which is significantly shorter than the
corresponding hydrogen bond in myoglobin.3, 4 It is still not understood how the
>C=O-His-Fe catalytic triad facilitates peroxide activation in DHP that is analogous to the
Asp-His-Fe charge relay in peroxidases.
The ligation strength of the proximal histidine should be directly correlated with
the charge supported on the heme iron and inversely correlated with the spin state of the
iron. The spin states of ferric heme proteins are S=1/2, S=3/2 and S=5/2, which will be
referred to as LS, MS and HS, respectively. The greater the basicity of the axial ligand,
the higher the energy of the dz2 and dπ (dxz, dyz) orbitals, due to σ- and π- bonding
interactions, respectively. The charge density in the ligand field causes these d-orbitals to
increase in energy and consequently lowers the spin state.29 In addition to effects of axial
of the ligand. While one can compare the native ferric state, this is complicated by the
fact that water is ligated in ferric HHMb, but not ferric HRP.18, 19, 30 The situation is still
under investigation for DHP since the x-ray crystal structure shows the heme to be
five-coordinate,3, 4 but magnetic circular dichroism31 and UV-vis titrations6 suggest that water
may be bound in the ferric form. This type of comparison is complicated in part by distal
interactions hydrogen bonding interactions.32-35
On the distal side peroxidases and globins both have a prominent histidine, known
as the distal histidine. However, peroxidases also have a highly conserved arginine that is
thought to stabilize proton transfer essential to rapid activation of bound peroxide to form
compound.13, 18, 19, 30, 36-38 However, bound hydroxide presents an especially interesting
situation since there are both hydrogen bond donor and acceptor interactions. Depending
upon the nature of the hydrogen bonding groups in the distal pocket, the Fe-OH bond can
either be strengthened or weakened by interactions in the distal pocket. A hydrogen bond
donor interaction with a σ-bonding distal ligand acts as a charge relay in reverse and
reduces the ligation strength of the bound ligand. The situation for π-bonding ligands
such as CO is more complex due to the competition between σ-donation and π
-backbonding.39 The proximal and distal charge relays are illustrated in scheme 1.
The distal and proximal differences between globins and peroxidases can be
related to their functional differences. In peroxidases, the greater negative charge on the
proximal histidine Nε, that arises due to the interaction of Nδ with a hydrogen bonding aspartate17, 24 results in a greater tendency for low spin iron, which reduces the core size
of the iron. The greater ligation strength leads to a “push” at the heme iron that is