Copyright 0 1994 by the Genetics Society of America
Pairwise Comparisons of Mitochondrial DNA Sequences in Subdivided
Populations and Implications for Early Human Evolution
Paul Marjoram' and Peter Donnelly
School of Mathematical Sciences, Queen Mary and Westjield College, London E l 4NS, England Manuscript received January 8, 1993
Accepted for publication September 30, 1993
ABSTRACT
We consider the effect on the distribution of pairwise differences between mitochondrial DNA sequences of the incorporation into the underlying population genetics model of two particular effects that seem realistic for human populations. T h e first is that the population size was roughly constant before growing to its current level. The second is that the population is geographically subdivided rather than panmictic. In each case these features tend to encourage multimodal distributions of pairwise differences, in contrast to existing, unimodal datasets. We argue that population genetics models currently used to analyze such data may thus fail to reflect important features of human mitochondrial DNA evolution. These may include selection on the mitochondrial genome, more realistic mutation mechanisms, or special population or migration dynamics. Particularly in view of the variability inherent in the single available human mitochondrial genealogy, it is argued that until these effects are better understood, inferences from such data should be rather cautious.
T
HERE are growing amounts of data on the vari- ability exhibited at the molecular level within species. Correct interpretation of these data requires an understanding of the way in which aspects of the evolutionary process and of the populations under consideration affect DNA polymorphisms within and between populations.Data typically consists of homologous sequences from a collection of individuals, and one commonly used measure of variability is the distribution of pair- wise differences: for each pair of individuals in the sample one counts the number of differences between their sequences; a histogram of these numbers of pairwise differences is then plotted over all pairs in the sample (e.g., AVISE, BALL and ARNOLD 1988; DI RIENZO and WILSON 1991).
There has been considerable recent interest in un- derstanding the way in which these histograms of pairwise differences depend on the evolutionary his- tory of the population, with a view to using data of this kind to provide insights into the underlying pop- ulation genetics processes. Motivated by the patterns exhibited within various human populations in pair- wise differences of mtDNA sequences (DI RIENZO and WILSON 1991), SLATKIN and HUDSON (1991) consid- ered the effect on such histograms of a constant, or alternatively exponentially growing, population size. In a related study, ROGERS and HARPENDING (1 992) have investigated the way in which the distribution of the number of differences between a pair of individ-
ton 3168, Australia.
Genetics 1 3 6 673-683 (February, 1994)
' Current address: Department of Mathematics, Monash University, Clay-
uals depends on specific aspects of the population process.
T h e purpose of this paper is to investigate the extent to which earlier conclusions remain true when more realistic features are incorporated into the population genetics models. In particular, we examine the case in which the population of interest was of approximately constant (small but nontrivial) size before commenc- ing exponential growth, and also the effect of geo- graphical subdivision during its evolution. (Existing work assumes panmixia.) Our primary motivation (as for earlier authors) is data from human mtDNA, and we focus attention on scenarios that might be realistic for human populations. T h e broad conclusion of this paper is that in most cases the incorporation of these more realistic features may lead to histograms of pairwise differences that are substantially different from those predicted by earlier studies. In particular, it seems difficult to explain the unimodal histograms of DI RIENZO and WILSON (1 99 1) simply on the basis of exponential growth. We discuss several other pos- sible causes of the patterns observed in data. Until these are better understood, we argue that inferences from existing datasets should be interpreted with cau- tion.
BACKGROUND
genealogical processes leads to predictions about pat- terns to be expected in observed data.
For particular beliefs about the way in which mu- tation is operating, a study of the underlying coales- cent process allows calculation of the “theoretical” distribution of the number of differences observed between the sequences of a pair of individuals. SLAT- KIN and HUDSON (1 99 1) (see also BALL, NEIGEL and AVISE 1990) make the crucial observation that even when the sample size is large, the observed histogram of pairwise differences will not mimic this theoretical distribution. This is because there are substantial (pos- itive) correlations in the data induced by the fact that all of the individuals sampled share the same under- lying genealogy. There are also positive correlations for the less subtle reason that the same individuals occur in many of the pairwise comparisons. If one were able to average the histograms obtained from many independent realizations of evolution, then this average would coincide with the theoretical distribu- tion. However, as we only have one realization of evolution it is appropriate to ask what sort of patterns should be expected in observed histograms.
For populations of constant size one would often expect to observe bimodal histograms (for example SLATKIN and HUDSON 1991). T h e reason for this is that for roughly half the time since its common ances- tor the sample will have had exactly two ancestors. One part of the sample will have been descended from one of these ancestors, and the remainder from the other. If a mutation occurs along one of these two branches of the genealogy, then (barring recurrent mutation, or a parallel mutation on the other branch) it will appear throughout one of the groups but not in the other. Because of the relatively long time for which the genealogy has two branches, there are likely to be several such mutations. If two individuals from the same group are compared, they will not differ at these sites, while individuals from different groups will differ. Thus, all of the pairwise comparisons of individuals within either group will involve substan- tially fewer differences than all of the pairwise com- parisons that involve one individual from each group, and a bimodal histogram will result. Figure 3 of SLAT- KIN and HUDSON (1 99 1) illustrates this phenomenon. In connection with the point made in the previous paragraph, it is worth stressing here that in this case the theoretical distribution, being geometric and
hence exponentially decreasing from a maximum at zero, is quite different from the (bimodal) patterns that would be expected in data as a consequence of correlation effects.
One central feature of the data in Figure 3 of DI RIENZO and WILSON 1991 is that with the possible exception of the Kung sample, the histograms are unimodal. This is inconsistent with a population of
fixed size. SLATKIN and HUDSON (1 99 1) [see also
Roc-
ERS and HARPENDING (1 992)] show that it is consistent with a panmictic population that has been growing exponentially throughout its existence. (The effect of this sort of growth is to alter the timescaling in the coalescent so that the genealogy becomes effectively star shaped.) T h e same broad conclusion holds for a panmictic population that undergoes a sudden in- crease in size and for one that was subjected to a very severe bottleneck for a reasonable time, for much the same reason.
Our concern is that this analysis does not fully reflect two likely features of human evolution. Cur-
rent beliefs about the size of the human population (WEISS 1984; SMITH, FALSETH and DONNELLY 1989; STRINGER 1990) point to a population of roughly constant size, say 103-105 breeding females, for a considerable period of time before it commenced growing to current levels. This contrasts with the assumption of SLATKIN and HUDSON (1 991), for ex- ample, that the population had been growing expo- nentially throughout its existence. Second, the as- sumption of random mating seems unrealistic for hu- man populations, and it is natural to ask whether the conclusions of earlier authors remain true for popu- lations that are subdivided geographically.
MODELS A N D SIMULATION TECHNIQUES
Our approach throughout is to simulate genealogies for various models of population structure, and then to superimpose the effect of mutation on the simu- lated genealogy. This generates realizations of data from which we can calculate the histogram of pairwise differences. As in SLATKIN and HUDSON (1991), we will assume no recombination and an infinite sites model: this last is in effect an assumption that each mutation on the genealogy of the sample will be to a different site and hence that all the mutations that have actually occurred since the most recent common ancestor of the sample will be reflected in the sample. We will consider samples of 50 individuals and assume a mutation rate of p = 2 X per individual per generation. (This corresponds for example to a region
1000 nucleotides long with a neutral mutation rate of 2 X 1O“j per base per generation.) In models that incorporate population subdivision, the 50 sampled individuals will all be taken from the same subpopu- lation.
We now outline the general framework for simulat- ing genealogy in neutral haploid populations of vary- ing size with geographical subdivision. T h e situation is in general too complicated for an analytical treat- ment.
Label the current generation as 0, and measure time into the past so that we refer to the time t
Pairwise Comparisons of mtDNA 675
denote the size of the total population at that time by
CM(t). T h e population is assumed to be divided into C distinct colonies each containing M ( t ) individuals at time t. We assume that within each colony mating is at random, according to a Wright-Fisher model and that generations are nonoverlapping. We denote by
m the probability that a particular individual will mi- grate between generations. We assume an island model, so that individuals behave identically with re- spect to migration and that upon migration an indi- vidual chooses its destination uniformly at random from the remaining C
-
1 colonies. [Except possibly for a rescaling of time, there is a considerable body of theory which indicates that the conclusions from such an analysis will hold for a wide range of models for reproduction with both overlapping and nonoverlap- ping generations. See, for example, KINGMAN (1982)and NOTOHARA ( 1 990)].
Consider a sample of n individuals taken from a single colony in the current generation. For each time
t in the past we need to keep track of the number of individuals in each colony who are ancestors of mem- bers of the sample. Specifically, denote by Ai,,, i = 1 ,
2,
. .
.,
C the number of individuals in colony i who were ancestors, t generations ago, of members of the sample, and denote by A, the collection of these an- cestral numbers:At = (Al,t, A2,t, , & . , ) a
Consider the changes which could occur to A, in going back one generation, to time t
+
1 :1 . With probability m a particular ancestor in, say, colony i will have been a migrant; and with probability
(C
-
I)-' this ancestor will have migrated from colony j . T h e effect of this will be to decrease by one thenumber of ancestors in colony i and to increase by one the number of ancestors in colonyj.
2 . With probability approximately M(t)-'(l
-
2 m )two ancestors in a particular colony will share a parent in the previous generation. Such an event would cause the number of ancestors in that colony to decrease by one.
Thus, ignoring terms of order M(t)-*, m2 and
mM(t)" (as is usual),
f'(At+1 = AI,^,
. .
* 9 A , t-
1, * *.
, Aj,t+
1,.
T h e simulation proceeds from generation to genera- tion into the past according to the probabilities above, until the sample is descended from a single common
1m
50 O O 10 20 30o
50 O0m
10 20 30:::kl
I5(I 50O0 10 20 30
N u I n l ~ c ~ . CJT Pairwise Dil'Tcrenccs
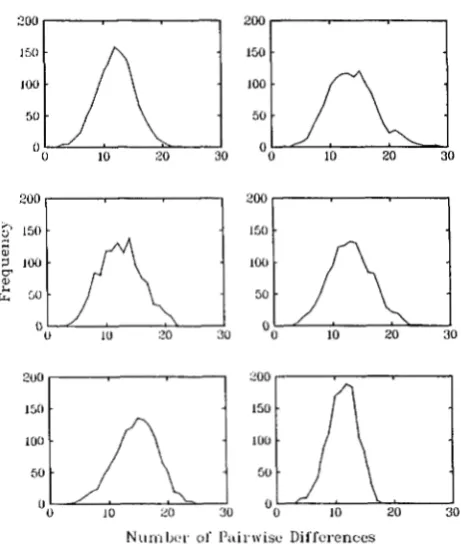
FIGURE 1 .-Frequency distributions of pairwise differences for six replicate simulations of a sample of size 50 from an exponentially growing population. The abscissa is the number of sites at which the pair differ and the ordinate is the number (of the 1255) pairs that differ by that number. The data were generated by the simu- lation methodology described in the text.
ancestor in some colony. In fact, it is also necessary to keep track of which (or at least how many) individuals in the sample are descended from each of the ances- tors in each generation. In addition, independently of all other events, there will be a mutation on a partic- ular lineage in a given generation with probability p.
RESULTS
For reference purposes we begin by using the method described above to simulate the evolution of a randomly mating population. We assume the current population size to be 1 X 1 09, decreasing exponentially to reach 5,000 individuals 50,000 years ago (50 Kyr b.p.), prior to which the exponential decay continues. (We assume a 20-year generation gap.) We continue the simulation until we reach the most recent common ancestor (MRCA) of the original sample and then plot the frequency of pairwise differences between the individuals in the sample. Figure 1 illustrates typical outcomes of this process.
We see that we obtain unimodal distributions. As
2 o o
-zoom
zoom
Number of Fairwise Differences
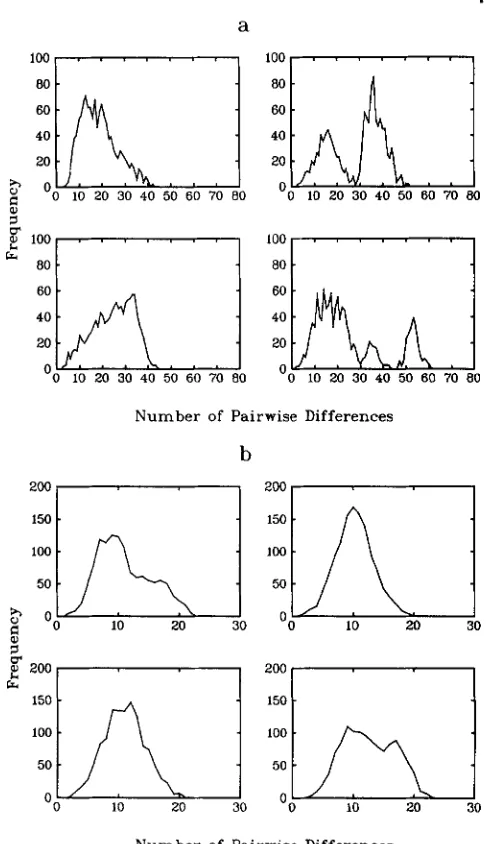
FIGURE 2.-Frequency distributions of pairwise differences for six replicate simulations of a sample of size 50 from an exponentially growing population that is subdivided according to an island model into four colonies with migration probability per individual per generation of 0.0 1.
[See SLATKIN and HUDSON (1991) and ROGERS and HARPENDING (1 992) for more details.]
T o study the robustness of this behavior under more general beliefs about the geographical structure of the population, we consider further simulations. First, a population with the same sizes as in the pre- vious case is simulated, but now we suppose the pop- ulation is divided (according to a finite-island model) into four colonies. Figure 2 illustrates typical distri- butions for the frequencies of pairwise differences observed between members of the sample when the migration probability is 0.0 1. Figure 3 gives the same frequencies for an identical population but with mi- gration probability of 0.00 l .
From these results we see that the amount of mi- gration plays a crucial role in the behavior of the sample genealogy. For a high migration probability (greater than 0.01, say), the distribution of pairwise differences is very close to that for a randomly mating population (with the same total sizes). But for smaller migration probabilities we may observe multimodal distributions. Note that if the migration probability is too small, there are unlikely to be any migrations before the sample has a common ancestor. In this case the sample will behave as if it were drawn from a randomly mating population (whose sizes are the same as that of the appropriate colony). In the current situation in which these are assumed to grow expo-
7icl
50 ‘ 0 10 20 30 -IO BONulnlxr of I’uirrvise Differences
FIGURE 3.-Frequency distributions of pairwise differences for six replicate simulations of a sample of size 50 from an exponentially growing population that is subdivided according to an island model into four colonies with migration probability per individual per generation of 0.00 1.
nentially, one would again expect unimodal distribu- tions of pairwise differences. Hence, we see that mi- gration probabilities that are high or very low will both lead to unimodal distributions, whereas for an intermediate range of migration probabilities we may see multimodal distributions. One might hope to dis- tinguish between the two situations leading to uni- modal distributions by considering the location of the mode: since a sample from a population with a very low migration probability coalesces more quickly (be- cause the population size, being that of only one of the colonies, is smaller), its mode will typically be at a lower value than a sample drawn from a correspond- ing population with high migration rates. Compari-
sons of sequences between subpopulations should also distinguish between high and low migration situations. (Some care is needed in applying this to actual data because the important population structure is that which has applied through most of evolutionary his- tory. This will in general not be known and may well differ from any current structure. Possible substantial recent increases in gene flow between certain human populations will further complicate the issue.)
Pairwise Comparisons of mtDNA 677
a
l o o , . .
. . .
I 1 0 0 , .. . .
1a,
20
Number of Pairwise Differences
b
Number of Pairwise Differences
FIGURE 4.-Frequency distributions of pairwise differences for four replicate simulations of a sample of size 50 from a panmictic population that was of constant size until 50,000 years ago, when it grew exponentially to a current size of 1 X io9. (a) Population of size 5,000 before growth; (b) population of size 500 before growth.
pattern in the two cases CM = 5,000 (Figure 4a) and
CM = 500 (Figure 4b).
Figures 4a and 4b show that even in an unstructured population the distribution of pairwise differences is not necessarily unimodal. Informally, the shape of the distribution is largely determined by the time at which the MRCA is reached. If this happens recently enough to be within the period of exponential growth (cf. Figure 4b) we expect to obtain a single mode. Con- versely, if the MRCA occurs sufficiently long ago to be within the period of constant population size (cf. some of Figure 4a), we expect to obtain a multimodal distribution (unless the population size before growth is so small that all remaining coalescences will occur rapidly). In fact, there are three possible types of behavior here, depending on the size of the popula-
tion before growth and the time of onset of growth. If the population sizes since the onset of growth are (relatively) large, then the sample will still have more than two ancestors at the time of onset of growth. In this case it will take an additional time for it to reach a MRCA of the order of CM generations and unless
M is small the histogram may be bimodal, for just the same reasons as in the constant population size case. If the population before growth was small, then, in view of the assumption of exponential growth, the genealogy, and hence histogram of pairwise differ- ences, will tend to resemble that of a population that has always been growing exponentially. An interme- diate behavior is also possible for a small range of parameters. In this case there will be some realizations that display the first type of genealogy and some that display the second, so that both types of histogram are possible. As the time of growth is moved further into the past a larger value of the size before growth is needed to guarantee the first type of behavior.
The time chosen for the onset of growth and the manner of growth are somewhat arbitrary. There is reasonable evidence (ROGERS and HARPENDING 1992; P. MARJORAM and P. J. DONNELLY, unpublished data) that the exact choices here have little effect on histo- grams of pairwise differences. Much the same patterns as those obtained for exponential growth over the past 50,000 years would be expected for a very rapid increase in population size, and a fairly wide range of times for growth, for example. For a given size of population before growth and a particular manner of growth, the more recent the onset of growth the more likely it is that histograms of pairwise differences will be multimodal. It may be argued that a time substan- tially more recent than 50,000 years ago for the onset of major growth in the human population is appro- priate. It seems unlikely to have been much earlier.
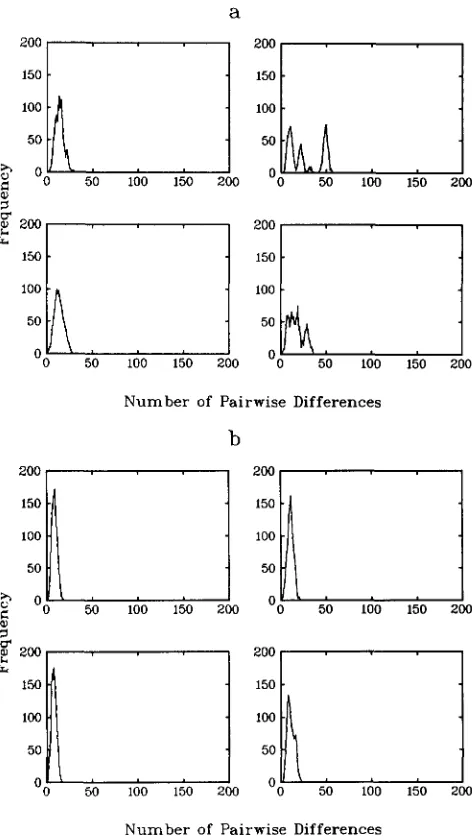
We now consider the effect of geographical subdi- vision on populations that are initially constant in size before commencing exponential growth about 50,000 years ago. Figure 5 shows typical histograms for a symmetric island model with four colonies (hence C =
4), migration probability 0.00 1, and varying values of M (CM = 5,000 in Figure 5a, and CM = 500 in Figure 5b). We also consider a population with CM = 500
but with a migration probability of 0.0001 (Figure
Once again we see that the introduction of popula- tion structure encourages multimodality. However as the size of the population during its constant-size period decreases we need lower migration probabili- ties to obtain the same effect (compare Figure 5, b and c).
a
100
,-,
20
' 0 20 40 60 80 100
a
2 o o r " l
2oom
loo 80
c""I
20
Number of Pairwise Differences
b
lzl
50 O O 10 20 30f
2 0 0 1 ,cr 2oo
7
50
Number of Pairwise Differences
200
100
50
10 20 30 ' 0 50 100 150 200 50 100 150 200
b
Number of Pairwise Differences
C
50
50
Numher of Pairwise Differences
FIGURE 5.-Frequency distributions of pairwise differences for four replicate simulations of a sample of size 50 from a population, subdivided into four colonies according to an island model, which was of constant size until 50,000 years ago, when it grew exponen-
50
' 0 50 100 150 200
Number of Pairwise Differences
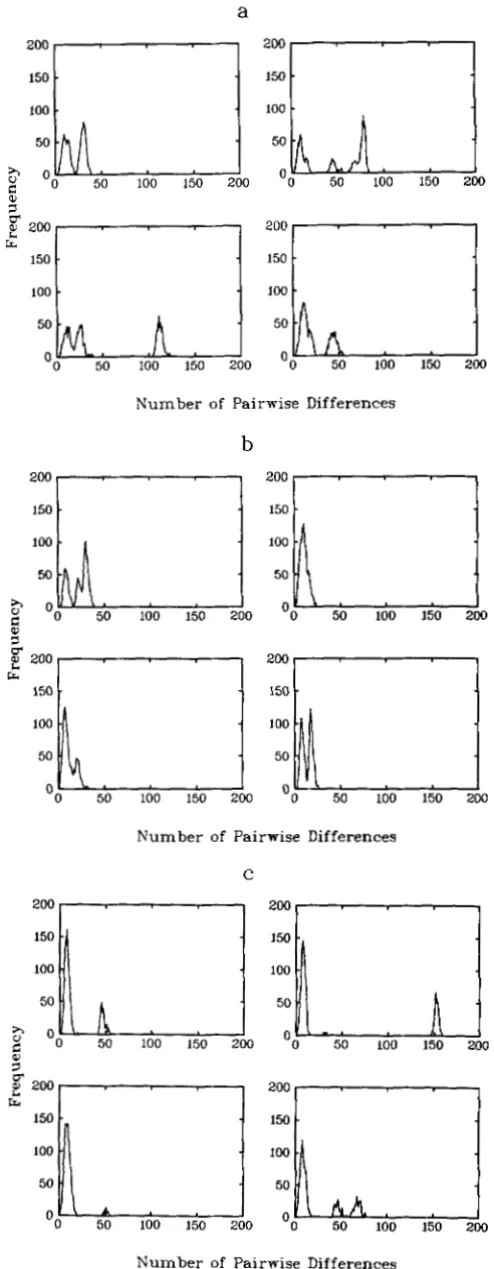
FIGURE 6.-Frequency distributions of pairwise differences for four replicate simulations of a sample of size 50 from a panmictic population that was of constant size 5,000 until it underwent a bottleneck 50,000 years ago. (a) Bottleneck of size 500: (b) bottle- neck of size 50.
5,000 until 50,000 years ago, at which time there was a population bottleneck consisting of a generation in which there were
ME
individuals. Thereafter, the pop- ulation immediately undergoes exponential growth that continues until the present day whereupon there are 1 X 10' individuals. (This model for a bottleneck seems natural. In any case its effect is much the same as an assumption that the population remains of sizeM E for several generations before increasing in size either immediately or gradually.) Figures 6a and 6b
Pairwise Compa
a
100
' 0 50 100 150 200 50 100 150 200
Number of Pairwise Differences
b
zoor"---l
2
o
0
7
1
150
r"l
Number of Pairwise Differences
C
50
h
"
' 0 50 100 150 200200
,
-100
50
Number of Pairwise Differences
FIGURE 7,"Frequency distributions of pairwise differences for four replicate simulations of a sample of size 50 from a population, subdivided into four colonies according to an island model that was of constant size 5,000 until it underwent a bottleneck 50,000 years
lrisons of mtDNA 679
are for a randomly mating population where the bot- tleneck is of size 500 and 50, respectively. Figures 7a and 7b are for corresponding subdivided populations (bottleneck sizes 500 and 50, respectively) with four colonies and a migration probability of 0.001, while Figure 7c is for a bottleneck size of 50 and a migration probability of 0.0001.
Again, we see that the migration probability in the population with the smaller bottleneck needs to be smaller in order to encourage multimodality. If the MRCA occurs during the period of exponential growth, we expect to observe the same behavior as in the case of a population undergoing continual expo- nential growth. If, however, the MRCA occurs suffi- ciently long ago to be in the period of constant pop- ulation size, we expect multimodal distributions, and since the population is of size 5,000 here we may well have to wait for a further large period of time to reach the MRCA and thus the modes may well be a relatively long distance apart. (Note that Figures 6
and
7
are plotted on the same scale in order to aid comparison.)DISCUSSION
Under the (infinite sites) model for mutation con- sidered here, histograms of pairwise differences will tend to be multimodal if for a reasonable amount of the time since the most recent common ancestor of the sample it has had only two (or a small number) of
ancestors. This is the case for neutral haploid popu- lations of (large) constant size-it is an elementary property of the coalescent that on average there will be exactly two ancestors for half the time since the sample's MRCA. It is not true if the population has been growing exponentially for an indefinite time-in this case most of the coalescences in the genealogy
happen over a short period of time when the popula- tion size is small.
If the population is assumed to have grown expo- nentially for a fixed period of time prior to which it was roughly constant, then unless the size prior to growth is small, or the period of growth extremely long, there will be more than one ancestor at the onset of growth. (Because of the assumption of exponential growth to current levels, a smaller population size at the onset of growth means that population sizes in all subsequent generations will be smaller.) In this case the MRCA will occur a substantial period of time before the onset of growth, with this part of the genealogy resembling that of a constant-sized popu- lation. This will lead in general to multimodal distri- butions of pairwise differences. The extent to which
P. Marjoram and
the addition of a population bottleneck to these dy-
namics will lead to unimodal distributions of pairwise differences depends on the severity of the bottleneck. For populations that are geographically subdivided, behavior depends on the migration rate. If this is large
(or very small), then the population will effectively behave as if it were panmictic. Otherwise, there will be migrations in the genealogy and the time to the MRCA will depend on the time until two ancestors in different subpopulations can be traced to the same subpopulation. (Coalescences can only occur between ancestors in the same subpopulation.) This will vary as the inverse of the migration rate, regardless of the Population size. For a symmetric island model with C colonies for example, its mean is (m/C)" generations, where m is the migration rate. If m/C is small (as is likely for realistic populations) and the population subdivision persists into the past, the time for which there are two ancestors of the sample is likely to be large, so that even with exponentially growing popu- lations there may be bimodal distributions of pairwise differences. (The simulations in the previous section assumed an island model with C =
4.
For larger values of C the effects described will be more marked.)IMPLICATIONS FOR HUMAN EVOLUTION
T h e relevance of particular simulation results to human evolution depends on the values of various demographic parameters that would be appropriate in this context. These are of course unknown. In asking about reasonable scenarios for early human populations, care is needed to avoid circularity. Some of our current beliefs, and most estimates of popula- tion parameters, are based on inferences (often from mitochondrial DNA data) using models that may be misleading, either because they ignore effects like population growth or structure, or because they make assumptions (like neutrality and independent identical mutation processes at each site) which we go on to suggest may be inappropriate for human mitochon- drial DNA. Further, most studies that do attempt to estimate such parameters only report point estimates. Aside from serious concerns about the models on which they are based, the estimators concerned may be quite variable, m e n f t h e model were true, because they are based on data that are positively correlated, for example, because of genealogical effects. A better understanding of the range of values of parameters that are consistent with particular data sets, and of possible shortcomings of the underlying models, would seem sensible before too much weight is placed on specific estimates.
Nonetheless, the scenario of a human population of roughly constant size (excluding possible bottlenecks) enjoying some degree of population structure for a considerable period of time before growing, gradually
or suddenly, to current levels, is not implausible. We are inclined to the belief that of the range of possible parameter values, a population of 5,000 breeding females before its growth 50,000 years ago, structured as an island model with four colonies, is toward one end of a spectrum, in the sense that the actual popu- lation size is unlikely to have been much smaller [the fossil record suggests a wide geographical spread of the human population, say, 50,000 years ago-for ex- ample, AIELLO (1993)-so that the actual number of individuals is unlikely to be too small, and although the strong caveats of the previous paragraph apply,
TAKAHATA (1 99 1, 1993) reports effective population sizes consistent with the figure of 5,0001, the time of growth may well have been substantially later than 50,000 years ago, for example, associated with the agricultural revolution, and with perhaps the most plausible scenarios being relatively small groups of hunter-gatherers spread or scattered across wide re- gions of at least Africa and perhaps much of the Old World (e.g., AIELLO 1993). T h e actual degree of pop- ulation subdivision seems unlikely to involve less struc- ture than an island model with four colonies. On the other hand, it seems extremely difficult to assess the level of migration appropriate to early human popu- lations. Most existing estimates, based on genetic data, appear particularly susceptible to the concerns ex- pressed in the preceding paragraph.
Pairwise Comparisons of mtDNA 68 1
quences themselves. (It is worth noting in this context that conditional on population parameters, unlinked regions of the nuclear genome will have effectively independent genealogies. Data from several such re- gions then carries information about independent rep- lications of the underlying genealogies.)
It thus seems difficult to be definitive about under- lying population structure and demography on the basis of pairwise differences from mitochondrial DNA sequences. Observed patterns will be rather more likely under some scenarios than others, but they will be impossible under very few. Nonetheless, in the absence of bottlenecks, under the neutral infinite sites assumption, we would argue that multimodal histo- grams of pairwise differences may occur under a wide range of realistic beliefs about human population sizes and structure. Our simulation study has concentrated on one class of models and we have seen that for these models, unless the human population has grown from a very small value (say 500 or fewer breeding females) and been panmictic or structured with high levels of gene flow, multimodal histograms of pairwise differ- ences may well occur. One cause of multimodal his- tograms (under the neutral infinite sites assumption) is an underlying genealogy in which the time taken for the last few coalescences is substantial relative to that for all other coalescences. Broadly speaking, genealogical theory predicts that within the context of traditional models for population subdivision, in- creasing the degree of structuring, reducing the level of gene flow, or increasing the size of the population before growth, will tend to increase the time for the last few coalescences in the genealogy. In the case of a sample from a single colony, the first two effects will also tend to decrease the time needed for early coa- lescences. On this basis we would expect that multi- modal histograms may well occur for a much wider range of models than those actually simulated. (We suggested above that our simulations were from one extreme of a range of models, so the genealogical theory suggests that multimodal distributions should be more likely for many of the other models.) In particular, the demographic conditions needed to guarantee unimodal histograms of pairwise differ- ences may be more restrictive than those suggested by earlier studies. Further, we would argue that such conditions seem, a priori, unlikely for the ancestral human population.
One potential explanation for the observed uni- modal histograms is a bottleneck of the (female) hu- man population, or founder effects. Founder effects, in this case the phenomenon whereby modern humans initially evolved in a small group that was isolated for a considerable period, seem plausible. (Of course there is a tradeoff between the size of the group and the duration of isolation, but for our model the sim-
ulations suggest that the number of breeding females in the group should not be much larger than 50 to ensure unimodal histograms. These are possible, but not certain, with larger groups.) Of the competing anthropological theories for the evolution of modern humans [see AIELLO (1 993) for a recent review] such a scenario is possible under the “African origin” hy- pothesis, but not under the “multiregional” hypothe- sis. Note, however, that TAKAHATA (1 993) argues that existing levels of HLA polymorphism are inconsistent with there having been a bottleneck in human evolu- tionary history over about the past 1 million years. [While TAKAHATA (1993) claims that the “shallow- ness” of the mtDNA genealogy in HORAI (1991) can be explained simply by an appropriate effective pop- ulation size, without evoking a bottleneck or founder effects, the shape of the estimated tree and the in- duced patterns of pairwise differences are difficult to reconcile with neutral, panmictic, models, without invoking substantial changes in population size, as
discussed above. Contrary to the argument of TAKA- HATA (1 99 l), patterns of sequence differences caused by a severe bottleneck would be likely to be different from those resulting from beliefs consistent with the multiregional hypothesis.]
The size of the bottleneck is the total number of breeding females in the human population. Other than founder effects, a bottleneck of size 50 (or even of several hundred) of the entire population of breed- ing females together with high levels of gene flow does not seem to us especially plausible, particularly in the light of the presumed spatial spread of the population. While a bottleneck during the migration out of Africa (under the African origin hypothesis) is plausible and consistent with the unimodal histograms of pairwise differences for the non-African data in DI
RIENZO and WILSON (1991), it fails to explain the African data. The claim in DI RIENZO and WILSON
(1 99 1) that their data indicate a nearly constant size for the African population seems questionable. Even
if such a population were effectively panmictic it would tend to have a deep genealogy. This in itself would strongly encourage multimodality of histo- grams for pairwise differences. In conjunction with an assumed bottleneck for the non-African ancestral populations, we would also expect considerably more pairwise differences in the African than in the non- African populations. Most forms of population struc- ture within the ancestral African population would tend to increase these effects.
We would suggest that three areas warrant further investigation.
Traditional models for migration and gene flow in subdivided populations (including those of this paper) typically assume that the population is divided into relatively large stable colonies of approximately fixed size, with gene flow through migration of individuals between colonies. Not only may this be unrealistic for human (and some other) populations, but it is possible that such differences could have crucial effects on induced genealogies, and hence, for example, on pat- terns of pairwise differences. Little is known of the actual spatial dynamics of early human populations. It is plausible that they lived in very small, transient, groups and the effects of such structure together with the possible splitting and coalescence of groups (so-
called “fusion-fission”) possibly of related individuals, needs further investigation. In addition, possible fe- male exogamy, the phenomenon whereby it is the females rather than the males who leave the group on maturity, could have profound effects on levels of mitochondrial gene flow. We note also that any mi- gratory behavior unique to one sex could result in different patterns between samples of nuclear and mitochondrial DNA.
Our analysis and that of SLATKIN and HUDSON
(1 99 1) and ROGERS and HARPENDING (1 992) assume an infinite sites model for mutation. This ignores recurrent mutation, possibly different rates for tran- sitions and transversions, and variation in mutation rates between different sites. LUNDSTROM, T A V A R ~ and WARD (1 992) have considered the possibility that some sites may be hypervariable. They argue that in this context the distribution of the number of pairwise differences between a pair of individuals may be uni- modal. In contrast, ROGERS (1992) shows that under certain plausible beliefs about the variation in muta- tion rates the mean of this latter distribution shows little relative change from its value with constant rates across sites. We would argue that neither of these papers bears directly on the issue here. It is well established that because of correlation effects the dis- tribution of the number of differences between a particular pair of individuals may bear no resemblance to the histogram obtained by plotting all of the pair- wise differences in a sample of sequences. Thus, in- formation about the way in which the former depends on various modeling assumptions does not necessarily tell us anything about how to interpret actual data. T h e effects on observed histograms of incorporating more realistic features of the mutation process seem best assessed by a direct (simulation) study.
As DI RIENZO and WILSON (1991) note, another possible explanation for the observed unimodal his- tograms is that a selectively advantageous (mitochon- drial) gene swept through the population over a rela-
tively short period of time in its past. There would be a range of possible times at which this could have happened-broadly, it must have occurred recently enough for there to have been few coalescences be- tween the selective event and the present. It should be remembered that in geographically subdivided populations (as seems likely for early human popula- tions) even a strongly selected gene will sweep through the population more slowly than in a panmictic pop- ulation, with the rate depending heavily on the level of gene flow between colonies (TAKAHATA 199 1). The literature seems divided on how plausible this level of selection is for human mtDNA. For example, DI RIENZO and WILSON (1991) cite evidence against se- lective effects, while EXCOFFIER (1 990) argues against neutrality. Note that selection on a maternally inher- ited trait could have the same effect as direct selection on the mitochondrial genome.
Until the effects of these or other possible depar- tures from conventional models are better under- stood, it seems dangerous to invoke patterns in histo- grams of pairwise differences as an argument for or against hypotheses concerning the evolution of mod- ern humans. One possible explanation, that of foun- der effects, is inconsistent with the multiregional hy- pothesis, unless the time of such an event can be placed around, or over, 1 million years ago. [We have con- centrated here on patterns in histograms of pairwise differences. Associating times with various events on the basis of such data is altogether more troublesome, see for example TEMPLETON (1993).] However, foun- der effects may be difficult to reconcile with patterns in samples from nuclear DNA. A selective sweep would also be much more difficult in the context of the geographical spread of populations envisaged un- der the multiregional hypothesis.
This paper suggests that traditional, neutral, popu- lation genetics models, with or without population subdivision, may fail to capture some important fea- tures in human evolution. Further, the whole human mitochondrial genealogy should be thought of as a sample of size one from a distribution that depends in a complicated and as yet unclear way on a whole range
of population parameters. In our view the resulting variability of data, such as histograms of pairwise differences, which depends in a random way on that single underlying genealogy, together with the possi- ble inappropriateness of current models, severely threatens attempts to make quantitative inferences about evolutionary parameters on the basis of mtDNA data. Until these various effects are better understood, it would seem wise to interpret the results of such studies with a degree of caution.
Pairwise Comparisons of mtDNA 683
LITERATURE CITED
AIELLO, L. C., 1993 The fossil evidence for modern human origins in Africa: a revised view. Am. Anthropol. 95: 73-96.
AVISE, J. C., R. M. BALL and J. ARNOLD, 1988 Current versus historical population sizes in vertebrate species with high gene flow: a comparison based on mitochondrial DNA lineages and inbreeding theory for neutral mutations. Mol. Biol. Evol. 5
BALL, R. M., J. E. NEICELandJ. C. AVISE, 1990 Gene genealogies within the organismal pedigrees of random-matingpopulations. Evolution 4 4 360-370.
DI RIENZO, A,, and A. C. WILSON, 1991 The pattern of mito- chondrial DNA variation is consistent with an early expansion of the human population. Proc. Natl. Acad. Sci. USA 88: 1597- 1601.
EXCOFFIER, L., 1990 Evolution of human mitochondrial DNA: evidence for departure from a pure neutral model of popula- tions at equilibrium. J. Mol. Evol. 30: 125-139.
HORAI, S. 1991 Molecular phylogeny and evolution of human mitochondrial DNA, pp. 135-152. in N m Aspects of the Genetics
of Molecular Evolution, edited by M. KIMURA and N. TAKA-
HATA.Japanese Scientific Studies, Tokyo and Springer, Berlin. HUDSON, R. R., 1990 Gene genealogies and the coalescent proc-
ess. Oxf. Surv. Evol. Biol. 7: 1-44.
KINGMAN, J. F. C., 1982 Exchangeability and the evolution of large populations, pp. 97-1 12 in Exchangeability in Probability and Statistics, edited by G. KOCH and F. SPIZZICHINO. North- Holland, New York.
LUNDSTROM, R., S. T A V A R ~ and R. H. WARD, 1992 Modelling
331-344.
the evolution of the human mitochondrial genome. Math. Biosci. 112: 319-335
NOTOHARA, M., 1990 The coalescent and the genealogical process in geographically structured population. J. Math. Biol. 2 9 59- 75.
ROGERS, A. R., 1992 Error introduced by the infinite-sites model. Mol. Biol. Evol. 9 1181-1 184.
ROGERS, A. R., and H. HARPENDING, 1992 Population growth makes waves in the distribution of pairwise genetic differences. Mol. Biol. Evol. 9 552-569.
SLATKIN, M., and D. HUDSON, 1991 Pairwise comparisons of mitochondrial DNA sequences in stable and exponentially growing populations. Genetics 129: 555-562.
SMITH, F. M., A. B. FALSETH and S. M. DONNELLY, 1989 Modern human origins. Yearb. Phys. Anthropol. 32: 35-68.
STRINGER, C. B., 1990 The emergence of modern humans. Sci. Am. 263: 98-104.
TAKAHATA, N., 1991 Genealogy of neutral genes and spreading of selected mutations in a geographically structured population. Genetics 129: 585-595.
TAKAHATA, N., 1993 Allelic genealogy and human evolution. Mol. Biol. Evol. 1 0 2-22.
T A V A R ~ , S., 1984 Line-of-descent and genealogical processes and their applications in population genetic models. Theor. Popul. Biol. 25: 119-164.
TEMPLETON, A. R., 1993 The “Eve” hypothesis: a genetic critique and reanalysis. Am. Anthropol. 95: 51-72.
WEISS, K. M., 1984 On the number of members of the genus Homo who have ever lived and some evolutionary implications. Hum. Biol. 5 6 637-649.