An Effective Way to Ensemble the Clusters
R.Saranya1, Vincila.A2, Anila Glory.H3
P.G Student, Department of Computer Science Engineering, Parisutham Institute of Technology and Science, Thanjavur, Tamilnadu, India.1
P.G Student, Department of Computer Science Engineering, Parisutham Institute of Technology and Science, Thanjavur, TamilNadu,India.2
P.G Student, Department of Computer Science Engineering, Parisutham Institute of Technology and Science, Thanjavur, TamilNadu,India.3
Abstract: Data Mining is the process of extracting knowledge hidden from huge volumes of raw data. The overall goal of the data mining process is to extract information from a data set and transform it into an understandable structure for further use. In the context of extracting the large data set, most widely used partitioning methods are singleview partitioning and multiview partitioning. Multiview partitioning has become a major problem for knowledge discovery in heterogeneous environments. This framework consists of two algorithms: multiview clustering is purely based on optimization integration of the Hilbert Schmidt - norm objective function and that based on matrix integration in the Hilbert Schmidt - norm objective function . The final partition obtained by each clustering algorithm is unique. With our tensor formulation, both heterogeneous and homogeneous information can be integrated to facilitate the clustering task. Spectral clustering analysis is expected to yield robust and novel partition results by exploiting the complementary information in different views. It is easy to see to generalize the Frobenius norm on matrices. Instead of using only one kind of information which might contain the incomplete information, it extends to carry out outliers detection with multi-view data. Experimental results show that the proposed approach is very effective in integrating higher order of data in different settings.
Keywords: Multiview partitioning, tensor formulation, Spectral clustering, Hilbert Schmidt – norm, Frobenius norm.
I. INTRODUCTION
Clustering is a process of grouping a set of objects into classes of similar objects and is a most interesting concept of data mining in which it is defined as a collection of data objects that are similar to one another. The principle of Clustering is to group fundamental structures in data and classify them into meaningful subgroup for additional analysis. Many of the clustering algorithms have been published yearly and can be proposed for developing various techniques and approaches. Similarity between a pair of objects can be defined either explicitly or implicitly.
For a group of people, their age, education, geographic location, and social and family connections can be obtained. For a set of published papers, the authors, citations, and terms in the abstract, title and keywords are well known. Even for a computer hard drive, the names of the files, their saved location, their time stamp, and their contents can be obtained easily. For each of these examples, to find a way to cluster the people, documents, or computer files, this approach is to treat all the similarities concurrently. The methods may also be used to minimize the effects of human factors in the process.
There are several categories of clustering algorithms. In this paper we will be focusing on algorithms that are exclusive in that the clusters may not overlap.
Some of the algorithms are hierarchical and probabilistic. A hierarchical algorithm clustering algorithm is based on the union between the two nearest clusters. After a few iterations, it reaches the final clusters. The final group of probabilistic algorithms is focused around model matching using probabilities as opposed to distances to decide clusters. EM or Expectation Maximization is an example of this type of clustering algorithm.
committee. If more than 2 of the committee members give the same classification result, then the clustering analysis for that observation is successful; otherwise, the analysis fails.
Kalton et al. [8], proposed an algorithm to create its own clusters. After the clustering was completed each member of a class was assigned the value of the cluster’s majority population. The authors noted that the approach loses detail, but allowed them to evaluate each clustering algorithm against the “correct” clusters.
In a set of multiple networks, they share same set of nodes but possess different types of connection between nodes. Number of relationship can be formed through specific activity is called multiview learning [2]. The recent development in clustering is the spectral clustering. Spectral clustering is purely based on the Ncut algorithm [1]. This can work well in the single view data as it is based on matrix decompositions. Many clustering algorithms have been proposed in comparison with the single view data. Therefore, these algorithms have some limitation.
Tensors are the higher order generalization of matrices .They can be applied to several domains such as web mining, image processing, data mining, and image recognition. Tensor based methods are used to model multiview data. This is used to detect the hidden pattern in multiview data subspace by tensor analysis. It works based on the tensor decomposition [1] which captures the multilinear structures in higher order data, where data has more than two modes. In tensor, similarity of researchers is one slice, and then similarity citations are one slice. Finally, all slices will be combined to form tensor.
Tensor decomposition is used to cluster all the similarity matrices into set of compilation feature vector. Many clustering algorithms like k Means, SVD, HOSVD are used for many tensor methods. Spectral clustering [1] is used for clustering the similarity matrices based on tensor methods.
II. RELATED WORK
Xinhai Liu et al. [1], has proposed a multiview clustering framework based on tensor methods. Their formulations model the multiview data as a tensor and seek a joint latent optimal subspace by tensor analysis. The framework can leverage the inherent consistency among multiview data and integrate their information seamlessly. Apart from other multiview clustering strategies, which are usually devised for ad hoc application, tensor method provides a general framework in which some limitations of prior methods are overcome systematically. In particular, the framework can be extended to various types of multiview data. Almost any multiple similarity matrices of the same entities are allowed to be embedded into their framework.
H. Huang et al. [2], has achieved that the tensor based dimension reduction has recently been extensively studied for data mining, machine learning, and pattern recognition applications. At the beginning, standard Principal Component Analysis (PCA) and Singular Value Decomposition (SVD) were popular as a tool for the analysis of two-dimensional arrays of data in a wide variety arrays, but it is not natural to apply them into higher dimensional data, known as high order tensors. Powerful tools have been proposed by Tucker decomposition. HOSVD does simultaneous subspace selection (data compression) and K-means clustering widely used for unsupervised learning tasks. In this paper, new results are demonstrated using three real and large datasets, two on face images datasets and one on hand-written digits dataset.
K. Chaudhuri et al. [4], has developed a clustering data in high dimensions. A number of efficient clustering algorithms developed in recent years address this problem by projecting the data into a lower-dimensional subspace, e.g. via Principal Components Analysis (PCA) or random projections, before clustering. Projections can be made using multiple views of the data, via Canonical Correlation Analysis (CCA). This algorithm is affine invariant and is able to learn with some of the weakest separation conditions to date. The intuitive reason for this is that under multi-view assumption, there is a way to (approximately) find the low-dimensional subspace spanned by the means of the component distributions. This subspace is important, because, when projected onto this subspace, the means of the distributions are well-separated, yet the typical distance between points from the same distribution is smaller than in the original space.
as single linkage usually suffices here). Typically, these algorithms also work under a separation requirement, which is measured by the minimum distance between the means of any two mixture components.
III. MATERIALS AND METHODS
A. Multiview Clustering
A multiview clustering method that extends k-means and hierarchical clustering to deal with data as two conditionally independent views . Canonical correlation analysis in multiview clustering assumes that the views are uncorrelated in the given cluster label. These methods can concentrate only on two view data. Long et al [6], formulated a multiview spectral clustering method while investigating multiple spectral dimension reduction.
Zhou and Burges developed a multiview clustering strategy through generalizing the Ncut from a single view to multiple views and subsequently they build a multiview transductive inference. In tensor-based strategy, the multilinear relationship among multiview data is taken into account. The strategy focuses on the clustering of multitype interrelated data objects, rather than clustering of the similar objects using multiple representations as in our research.
B. Spectral Clustering
Spectral clustering was derived based on relaxation of the Ncut formulation for clustering. Spectral clustering involves a matrix trace optimization problem. In this paper, we proposed that the spectral clustering formalism can be extended to deal with multiview problems based on tensor computations.
Given a set of N data points { i} where iε d is the i th data point, a similarity ij can be defined for each pair of data points and based on some similarity measure. A perceptive way for representing the data set by using a graph G= (V,E) in which the vertices V represents the data points and the edges characterize the similarity between data points which are quantified by the similarity measure of the graph is symmetric and undirected. The matrix of the graph G is the matrix S with entry in row i and column j equal to Sij .The degree of the vertex can be written as
=
where ʋi is connected to the sum of all weight of the edges. The degree of the matrix D is a diagonal matrix containing the vertex degrees from d1….dN As the diagonal, It follows from the spectral formalism of embedding the Laplacian matrix can be defined as L=D-S and Ncut is defined by corresponding to the normalized Laplacian matrix
= / / = − (2)
where SN and LNcut are the normalized similarity eigenvector and their eigenvalues.
IV. PROPOSED SYSTEM
Spectral clustering is used for integrating cluster in heterogeneous environment. In the proposed system, one of the tensor method known as Hilbert Schmidt norm (HS-Norm) is used. The advantage of HS norm: it is mainly used for identifying hidden pattern in the context of spectral clustering. This provides the good result when compared to other tensor methods. Here synthetic datasets are used for evaluating the results by comparing with Frobenius Norm. Tensor-based methods have been used to model multi-view data. This framework is used to implement both single view and multi view spectral clustering. Furthermore, The Hilbert Schmidt norm, sometimes also called the Matrix norm, which extends their capability with infinite dimensional space.
information which might contain the incomplete information, it extends to carry out outliers detection with multi-view data.
A. SIMILARITY MATRIX
To measure the ‘similarity’ of two sets of clusters, a simple formula is defined here: Let P = {P1, P2, …, Pm} and Q = {Q1, Q2, …, Qn} be the results of two clustering algorithms on the same data set. Assume P and Q are “hard” or exclusive clustering algorithms where clusters produced are pair-wise disjoint, i.e., each pattern from the dataset belongs to exactly one cluster. Then the similarity matrix for P and Q is an m × n matrix SC,D (1).
where Sij = x/y, which is Jaccard’s Similarity Coefficient with x being the size of intersection and y being the size of the union of cluster sets Pi and Qj. The similarity of clustering P and clustering Q is then defined as
( , ) = ∑ , / ( , ) (1)
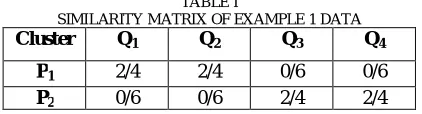
For Example 1, let P1 ={1,2,3,4} P2 ={5,6,7,8} and Q1 ={1,2}, Q2 ={3,4}, Q3 ={5,6}, Q4 ={7,8} thus m=2 and n=4, then the similarity between clustering P and Q is given by the following matrix SP,Q.
TABLE I
SIMILARITY MATRIX OF EXAMPLE 1 DATA
Cluster Q1 Q2 Q3 Q4
P1 2/4 2/4 0/6 0/6
P2 0/6 0/6 2/4 2/4
In cell P1Q1, x=|P1∩Q1|=|{1,2}|=2, and y= |P1YQ1|=|{1,2,3,4}|=4. Therefore, cell P1 Q1=x/y=2/4. Similarly the other cells of the matrix are calculated. Thus, the similarity between cluster set P and cluster set Q in this case is Sim(P, Q) = (2/4+2/4+0/6+0/6+0/6+0/6+2/4+2/4)/4 = 0.5
B. COSINE SIMILARITY
Cosine similarity is a measure of similarity between two vectors of an inner product space that measures the cosine of the angle between data sets. The key to estimating the selectivity of a cosine similarity predicate is to understand the distribution of the dot product. The cosine of 0° is 1, and it is less than 1 for any other angle. It is thus a result of orientation and not magnitude: two vectors with the same orientation have a Cosine similarity of 1, two vectors at 90° have a similarity of 0, and two vectors diametrically opposed have a similarity of -1, independent of their magnitude. It is particularly used in positive space, where the outcome is neatly bounded. It will generate a metric that says how related are two documents by looking at the angle instead of magnitude.
The cosine of two vectors can be denied by using the Euclidean dot product formula
. = ‖ ‖‖ ‖ (2)
Given two vectors of attributes A and B the cosine similarity, cosθ is represented using a dot product and magnitude as
= cos( ) = .
‖ ‖‖ ‖=
∑
∑ ( ) ∑ ( )
C. TENSOR BASED ANALYSIS
Multiview Spectral Clustering
In integration of multiview data in spectral clustering, there are different strategies
1) MULTIVIEW CLUSTERING BY TRACE MAXIMIZATION(MC-TR-I)
The first strategy is to add objective functions of the type, associated with the different views. Consider,
( )
= ( )
where ( ) is the normalized similarity matrix for the kth view and U is the common factor shared by the views. The weights are learned from the data
( )
= ,
( ) ,
s.t UTU = I, W ≥ 0 and ||W||F = 1.
2) MULTIVIEW CLUSTERING BY INTEGRATION OF THE HILBERT SCHMIDT-NORM OBJECTIVE FUNCTION (MC-HS-OI)
All terms in the objective function
( ( ) )
( )
is positive (semi) definite, 1 ≤ k ≤ K. This corresponds to adding objective functions.
( ) ,
3) MULTIVIEW CLUSTERING BY MATRIX INTEGRATION OF THE HILBERT SCHMIDT-NORM OBJECTIVE FUNCTION (MC-HS-MI)
Consider,
|| ( ) ||
.
where ( ) is the normalized similarity matrix for the kth view and U is the common factor shared by the views.
D. CLUSTER LABEL
Typically, the labels are obtained by examining the contents of the documents in a cluster. A good label not only summarizes the central concept of a cluster but also uniquely differentiates it from other clusters in the collection. Regarding clustering evaluation, the data sets used in our experiments are provided with labels. Therefore, the clustering performance is evaluated comparing the automatic partitions with the labels using Adjusted Rand Index. Adjusted Rand Index(ARI) has a lower fixed bound of 0 and upper bound of 1. It takes the value of 1 when the two clustering are identical and 0 when the two clustering are independent, i.e. share no information about each other.
V. CONCLUSION
Clustering in data mining has become a crucial issue in recent years. However, most prior approaches assume that the multiple representations share the same dimension, limiting their applicability to homogeneous environments. In this paper, one of the tensor based framework namely, Hilbert Schmidt norm is used for integrating heterogeneous environments. The future work will focus on performance measures when it is compared with the existing approach with respect to their cluster label. Experimental results demonstrate that the proposed formulations are effective in integrating multiview data in heterogeneous environments.
REFERENCES
[1] Xinhai Liu, Shuiwang Ji, Wolfgang Gla¨nzel, and Bart De Moor, “Multiview Partitioning via Tensor Methods, ” IEEE Trans. on Knowlege and Data Engineering, vol. 25, no. 5, May. 2013.
[2] H. Huang, C. Ding, D. Luo, and T. Li, “Simultaneous Tensor Subspace Selection and Clustering: The Equivalence of High Order SVD and k-Means Clustering,” Proc. 14th ACM SIGKDD Int’l Conf. Knowledge Discovery and Data Mining, pp. 327-335, 2008.
[3] Dr.A.Bharathi and S.Anitha, “Integrating Mutiview clusters with Tensor Methods, ” International Journal of Computer Science & Engineering Technology (IJCSET), ISSN : 2229-3345, 10 OCT 2013
[4] K. Chaudhuri, S.M. Kakade, K. Livescu, and K. Sridharan, “Multi- View Clustering Via Canonical Correlation Analysis,” Proc. 26th
Ann. Int’l Conf. Machine Learning (ICML ’09), pp. 129-136, 2009.
[5] Arthur Gretton, Olivier Bousquet, Alex Smola and Bernhard Scholkopf , “Measuring Statistical Dependence with Hilbert-Schmidt Norms,” ALT'05 Proceedings of the 16th international conference on Algorithmic Learning Theory Pages 63-77 Springer-Verlag Berlin, Heidelberg ©2005
[6] B. Long, Z.M. Zhang, X. Wu´ , and P.S. Yu, “Spectral Clustering for Multi-Type Relational Data,” Proc. 23rd Int’l Conf. Machine Learning, pp. 585-592, 2006.
[7] Y.Pen, G.Kou, Y.Shi, and Z. Chen, “Improving Clustering Analysis for Credit Card Accounts Classification,” LNCS 3516, 2005, pp. 548- 553. [8] A. Kalton, K. Wagstaff, and J. Yoo, “Generalized Clustering, Supervised Learning, and Data Assignment,” Proceedings of the Seventh
International Conference on Knowledge Discovery and Data Mining, ACM Press, 2001.
[9] H.G. Ayad and M.S. Kamel, “Cumulative Voting Consensus Method for Partitions with Variable Number of Clusters,” IEEE Trans. Pattern Analysis and Machine Intelligence, vol. 30, no. 1, pp. 160-173, Jan. 2008.