GRISSETT, GREGORY AARON. Three Dimensional Structures from Nonwovens.
(Under the Direction of Behnam Pourdeyhimi.)
The purpose of this research was to assess molding or thermoforming nonwoven
webs into a three-dimensional fiber network without the use of resin or binders via the SpaceNet Formed Fiber System ®. We define this network as a deep-draw structure with
projections and/or depressions rising from an initial plane, providing a grid-domed
structure. The research is comprised of three experimental components: the first
concerned with moldability of nonwovens on the SpaceNet System. The second
component comprised an evaluation of the effect process parameters on substrate
deformation, and the third concerned with an investigation the effect of mold geometry
on compressive properties.
Concerning the moldability of nonwovens, eight-nonwoven webs (six spunbond,
two hydroentangled) were processed using the SpaceNet formed fiber system.
Nonwovens comprised of a uniform fiber orientation and isotropic mechanical properties
were found to process more efficiently in the SpaceNet system. Given this conclusion,
spunbond nonwovens were selected for the remainder of the research described herein.
Different mold geometries were used to make three-dimensional structures from
spunbond nonwovens and their respective compressive properties were evaluated. It was
observed that decreases in pin diameter increased the compressive stress in all samples
produced. It was also found that compressive resilience is not necessarily associated with
changes in mold geometry but rather inherent fabric properties i.e. stiffness and level of
evaluated. A split-plot factorial design was used and it was determined that temperature
alone influences maximum deformation. Preheating (residence time) was observed to be
By
GREGORY AARON GRISSETT
A thesis submitted to the Graduate Faculty of North Carolina State University
in partial fulfillment of the requirements for the Degree of
Master of Science
TEXTILE MANAGEMENT AND TECHNOLOGY
Raleigh 2003
APPROVED BY:
________________________________ ________________________________
________________________________
DEDICATION
BIOGRPAHY
ACKNOWLEDGMENTS
TABLE OF CONTENTS
LIST OF FIGURES...vii
LIST OF TABLES ...ix
1. Introduction... 1
1.2 OBJECTIVES... 3
2. Literature Review... 3
2.1 THERMOFORMING... 3
2.1 THREE-DIMENSIONAL STRUCTURES IN TEXTILES... 6
2.1.1 Composites ... 6
2.1.2 Random Fiber Assemblies (Nonwovens)... 7
2.1.3 Network Materials... 8
2.2 FORMING STUDIES... 9
2.2.1 Formability... 11
2.3.2 Forming Limit Diagrams ... 13
2.3.3 Drawabilty... 14
2.4 NONWOVENS AND THERMOFORMING... 15
3. SpaceNet Thermoforming Process... 16
3.1 OPERATING TEMPERATURE... 17
3.2 RESIDENCE AND MOLDING TIMES... 18
3.3 STOP HEIGHT... 20
3.4 MOLD GEOMETRY... 20
4. Experimental Work: Determination of Nonwoven Moldability... 22
4.1 SUBSTRATES... 22
4.2 FORMED PRODUCT ANALYSIS... 27
4.2.1 Failure Mechanisms... 27
4.2.2 Compression-Recovery Properties... 29
5. Experimental Work: The Effect of Processing Parameters on Maximum Deformation... 40
5.1 FACTORS AND RESPONSE VARIABLE... 40
5.2 OPERATING TEMPERATURE... 40
5.3 RESIDENCE AND MOLDING TIMES... 41
5.4 RESPONSE VARIABLE: MAXIMUM DEFORMATION... 41
Response Variable... 43
5.5 EXPERIMENTAL DESIGN... 43
5.5 STATISTICAL METHODS AND DATA... 44
5.6.1 Statistical Analysis ... 45
5.7 CONCLUSIONS... 51
6.1 SUBSTRATES... 52
6.2 COMPRESSIVE PROPERTIES... 53
6.3 CONCLUSIONS... 72
7. Recommendations... 73
8. Bibliography... 75
9. Appendices... 81
9.1 APPENDIX A: DRAW RATIO... 81
9.2 APPENDIX B: CALCULATION OF STANDARD ERRORS... 85
9.3 APPENDIX C: TEST FOR NORMALITY COMPRESSIVE STRESS & ENERGY... 86
9.3.1 Compressive Stress... 86
9.3.2 Compressive Secant Modulus ... 88
LIST OF FIGURES
1. Introduction
Figure 1.1 Example 3D structure produced for this study ... 1
2. Literature Review Figure 2.1 A Typical Thermoforming Operation... 5
Figure 2.2 Mechanical Deformations in Thermoforming ... 11
3. SpaceNet Thermoforming Process Figure 3.1 SpaceNet Hydraulic Press... 17
Figure 3.2 Press in Residence Phase ... 19
Figure 3.3 Press in Molding Phase... 19
Figure 3.4 Interdigitated Mold ... 21
4. Experimental Work: Determination of Nonwoven Moldability Figure 4.1 Tensile Strength ... 24
Figure 4.2 Strain at Break ... 24
Figure 4.3 Spunbond PET Fiber Orientation Distributions... 25
Figure 4.4 Spunbond PP Fiber Orientation Distributions ... 26
Figure 4.5 Hydroentangled PET Fiber Orientation Distributions ... 26
Figure 4.6. Holes produced on PGI-T and PHI-H... 28
Figure 4.7 Dome Structure ... 30
Figure 4.8 Compression Recovery for Spunbond Polypropylene... 31
Figure 4.9 Compression Recovery for Spunbond Polyester ... 32
Figure 4.10 Compression Recovery For Hydroentangled Samples ... 33
Figure 4.11 Compressive Stress: All Substrates ... 34
Figure 4.12 Compressive Secant Modulus: All Substrates ... 35
Figure 4.13 Trapezoidal Tear Strength ... 36
Figure 4.14 Substrate Flexural Strength 37 5. Experimental Work: The Effect of Processing Parameters on Maximum Deformation Figure 5.1 SpaceNet Hydraulic Press... 40
Figure 5.2 Interaction Plots of Residence Time and Temperature... 49
6. The Effect of Mold Geometry on Compressive Properties Figure 6.1 Fiber Substrate Orientation Distributions ... 53
Figure 6.2 Effect of Pin Diameter on Compressive Peak Stress... 55
Figure 6.3 Effect of Pin Diameter on Compressive Secant Modulus. ... 56
Figure 6.4 Typical Compression-Recovery Curve... 58
Figure 6.5 Total Compressive Energy to 40% Strain... 58
Figure 6.6 Recovered Compressive Energy ... 60
Figure 6.7 Hysteresis... 61
Figure 6.9 Substrate Tear Strength... 64
Figure 6.10 Substrate Flexural Strength... 64
Figure 6.11 Tear Strength vs. Total Compressive Energy to 40% Strain ... 65
Figure 6.12 Recovered Energy... 66
Figure 6.13 Hysteresis as a function of Tear Strength ... 67
Figure 6.14 Hysteresis as a % of Total Energy Vs. Tear Strength... 68
Figure 6.15. Total Compressive Energy to 40% Strain vs Flexural Strength ... 69
Figure 6.16 Recovered Energy Vs. Flexural Strength ... 70
Figure 6.17 Hysteresis Vs. Flexural Strength ... 71
LIST OF TABLES
Table 3.1 Operating Temperatures by Fiber Type ... 18
Table 3.2 Residence Time by Fiber Type ... 18
Table 3.3 Mold Time by Fiber Type ... 20
Table 4.1 Spunbond Samples ... 23
Table 4.2 Hydroentangled Samples ... 23
Table 4.3 Fiber Orientation Uniformity Data... 27
Table 4.4 Processing Conditions –Analysis 1... 28
Table 4.5 Analysis of Variance for Differences in Compressive Stress ... 34
Table 4.6 Analysis of Variance For Differences in Compressive Secant Modulus... 35
Table 4.7 Analysis of Variance of Regression Model ... 38
Table 4.8 Partial Regression Coefficients ... 38
Table 4.9 Pearson Correlations Coefficients... 39
Table 5.1. Factors and Response Variables... 43
Table 5.2 Treatment Combinations... 43
Table 5.3. Randomized Run Order... 44
Table 5.4 Response Data... 45
Table 5.5 Analysis of Variance ... 46
Table 5.6 Residence Time (Level Means) ... 49
Table 5.7 Temperature (Level Means)... 49
Table 6.1 Substrate Properties... 52
Table 6.2 ANOVA for Compressive Stress Data... 55
Table 6.3 Analysis of Variance for Compressive Secant Modulus ... 57
Table 6.4 Analysis of Variance for Total Energy ... 59
Table 6.5 Analysis of Variance for Recovered Compressive Energy... 60
Table 6.6 Analysis of Variance for Hysteresis... 61
Table 6.7 Analysis of Variance for Hysteresis as a % of Total Energy ... 63
Table 6.8 Correlation between Tear Strength and Total Energy as a function of Pin Diameter ... 65
Table 6.9 Correlation between Tear Strength and Recovered Energy a function of Pin Diameter ... 65
Table 6.10 Correlations between Tear Strength and Hysteresis a Function of Pin Diameter ... 66
Table 6.11 Correlations between Tear Strength and Hysteresis as a % of Total Energy as a Function of Pin Diameter ... 68
Table 6.12 Correlation between Flexural Strength and Total Energy a function of Pin Diameter ... 69
Table 6.13 Correlation between Flexural Strength and Recovered Energy a function of Pin Diameter... 70
When discussing molding or thermoforming three-dimensional structures from nonwovens (or any textile), a problem arises regarding its classification. This classification has been addressed by posing several questions aimed at describing the difficulties involved in product differentiation, i.e. how thick does the substrate have to be, does embossing result in a molded or formed product, how thick does the structure have to be to be considered 3D [23]?
Representative of this classifying difficulty, the patent literature is replete with many references to formed, molded three dimensional products from nonwoven and traditional textile materials. Clarifying the classifying dilemma regarding this report, the investigations outlined in the current thesis is aimed at structures that have complex or major contours and curves. Specifically the materials produced in the study are deep-draw materials. In this context, the formed structures will have projections and depressions rising from similar substrate plane as displayed in Figure 1.1.
Top View Cross-Section
An appropriated indication to the degree to which these projections arise from the substrate plane is the molded thickness (hereafter referred to as product thickness) to substrate thickness ratio, in this work this ratio has been measured to be between 10:1 and 20:1. Much work has been completed regarding three-dimensional textiles with the primary thrust of research, both experimental and theoretical, aimed at composite applications. The use of thermoforming to produce three-dimensional structures from woven and knitted textiles has also been thoroughly investigated. There is however a lack of information regarding thermoforming commercially available nonwoven structures into deep-draw materials. Relevant information in this regard includes: how nonwovens behave during thermoforming from a structural standpoint, the implication of processing parameters on final product properties and potential applications for three-dimensional structures from nonwovens. Therefore the current thesis investigates the production of three-dimensional deep-draw structures from nonwoven substrates via the patented SpaceNet® thermoforming system.
1.2 Objectives
Several objectives are proposed for this thesis. The first of which is to specifically determine what types of nonwovens favor thermoforming particular to the SpaceNet® system. Within in this context, moldability of webs is to be assessed based on available mold geometries. Secondly, another goal of this work is to determine how substrate deformation is influenced by relevant processing factors. Emphasis in this regard will be placed on the maximum deformation achieved during thermoforming. In addition, it is an objective to determine the effect of mold geometry on the compressive properties of three-dimensional nonwovens structures and how compressive properties vary from substrate to substrate.
2. Literature Review
The present review will briefly discuss thermoforming, three-dimensional textiles, the patent literature related to three-dimensional nonwovens and provides a concise review of the issues regarding forming or molding textile materials
2.1 Thermoforming
deformation of pre-manufactured substrates (preforms); hence this review will focus on different types of deformation mechanisms used in regards to thermoforming.
Thermoforming is the shaping of planar thermoplastics at increased temperatures into molded articles [25] via mechanical or pneumatic means. Thermoplastic materials, by definition are polymers that can be heated, shaped and cooled repeatedly without substantial change to inherent polymer characteristics. Unique morphological characteristics allow this “thermoplastic” phenomenon to occur. Within this morphological framework, crystalline and amorphous regions describe and constitute the morphology of a polymer. Thermoforming, in the context of this thesis, is accomplished by heating the polymeric material above the glass transition (Tg) and below the melting temperature (Tm) in the presence of a nearly uniform force.
The processing of a thermoplastic polymer above its glass transition temperature transforms the polymer from a solid, glassy state to more viscous rubbery state. This transition can be envisioned as molecular movement within the amorphous regions of a polymer due the presence of thermal energy. Thermoforming processing conditions must account for stress-strain behavior of the polymer in its rubbery state. As the isothermal temperature increases above Tg, amorphous polymers become increasingly ductile (decrease in modulus are reported). For more crystalline polymers, a more aggressive temperature protocol is required to achieve similar changes in modulus [52].
Figure 2.1 A Typical Thermoforming Operation
There are several types of thermoforming systems that can be generally isolated into three categories:
1. One-Step Forming 2. Multiple Step Forming 3. Other Variations
There are five types of one-step forming operations: drape, vacuum, pressure, free blowing and match die molding. One-step systems generally produce simple shapes with relatively short cycle times. The SpaceNet® thermoforming system would be categorized as a match-die molding system (similar to thermoforming operation displayed in Figure 2.1). Multiple-step systems are used when molded products are more complex and uniformity is important. Within these systems a pre-stretched substrate to pressed to a mold surface. Pneumatic thermoforming is a type of multiple –step system that utilizes a vacuum (suction) to conform a substrate to a mold surface; a second mold is also used above the vacuumed substrate to accommodate deformation. Pneumatic deformation in addition to the presence of pressure molds to accommodate deformation provides uniform wall thickness and deep draw ratios (this process is often used to make cups). [1, 3]
Male Mold Female Mold Substrate
Formed product
Pneumatic thermoforming processes are convenient for homogeneous substrates such as thin films, or plastic sheets. However, textile substrates such as woven, knit and in particular nonwovens, owing to their fiber architecture in some cases are very porous media. Void or pore size and distribution may limit the ability of a pressure differential to be achieved and substrate conformability to molds will be compromised. It would be appropriate here to utilize heated male and female molds to achieve appropriate deformation for textile substrates, such as the case for the SpaceNet System.
2.1 Three-Dimensional Structures in Textiles 2.1.1 Composites
Composites in the form of braids, laminates of planar structures and 3D orthogonal weaves are examples of three-dimensional textile structures that find a wide variety of end-uses from transportation to construction applications. Three-dimensional braids are often used for structural applications in addition to three-dimensional or orthogonal weaves. Structural stability and design flexibility allow 3D weaves and braided composites to be commercially viable endeavors. [8,46,59]
Research into three-dimensional composite structures has comprised two major areas: mechanical property analysis of three-dimensional composite structures and analysis of the formation of three-dimensional composite structures. This review will focus on the analysis of three-dimensional composite formation.
2.1.2 Random Fiber Assemblies (Nonwovens)
Other forms of three-dimensional textiles are can be found within the nonwovens industry. Specifically, and are often molded to achieve three-dimensional form. Unique to needled felts, structural changes caused by fiber mobility within the felt allow shrinkage and elongation of the fabric in selected areas, which permits the deformation required to produce complex structures. Needle felts in three-dimensional form are a type of substrate that acquires its dimension or shape after fabric/web formation is complete (i.e. is an added process) via a molding or thermoforming process.
garments [56]. A large market for molded textile structures, specifically molded nonwovens are in automotive applications, i.e. floorboards, headliners, acoustic insulation, fuel filters etc [28].
2.1.3 Network Materials
The patent literature also describes network materials that utilized monofilament knits and woven fabrics with subsequent thermoforming to achieve final three-dimensional form. Disselbeck et al. describes a three-three-dimensional shaped textile material via molding. The process described utilizes a highly–extensible textile sheet which is impregnated with a resin. Subsequent processing includes the thermoforming of the substrates to produce a grid-domed structure, and cure the resin. Product properties include permeability and stiffness [15, 16]. In another variant, Bessey et al describe a fiber network structure molded from monofilament woven and knitted fabrics with-out the use of matrix materials to impart dimensional stability. Upon molding, monofilament crossover points are not fused; the resultant structure is extremely resilient when a compressive force is applied [7, 26]. The thermoforming systems used in the previously described products is very similar to the systems used in this thesis. However, fiber networks comprised of nonwoven materials have not been completed. This has provided the impetus for the current work.
current work. The low-melting temperature component of the fibers used allows for moldability while the high melt temperature fiber imparts structural stability [24, 26, 49].
Common to many of the before mentioned processes, specifically for composite applications, the dimensional satiability of the formed product is often attributed to the presence of an additional constituent imparted during molding. These constituents are often in the form or resins, binder fibers or powders deposited prior to molding. The presence of heat energy during molding activates the adhesive system with the sole purpose of fiber interlocking. Because the adhesives are activated in an extended or “molded” form, once solidified, the structure retains its deformed shape. This has been a primary method for manufacturing three-dimensional products for textile substrates and is analogous to thermal bonding of nonwoven webs (when binder fibers or powders are used for web bonding) [65].
2.2 Forming Studies
Determining an appropriate balance between mechanical deformation and rheological melt is critical to achieve maximum deformation without degradation. Characterizing the deformation of the substrate induced by thermoforming becomes important to minimize redundant and costly trials from a developmental point of view.
and strain field analysis. It is an objective of this review to evaluate if formability studies could and should be used on various nonwoven structures as a criterion for thermoforming.
2.2.1 Composite Sheet Forming
As described previously, various processing methods are available to achieve structures that can be defined as three-dimensional in final form. A procedure for modeling the formation of final products proves useful from a developmental standpoint. Composite sheet forming closely resembles the processing techniques used in regards to the current thesis. Therefore issues that arise in formation analysis or modeling of composite sheet forming can be insightful when evaluating the formation of three-dimensional structures from nonwovens. Two major approaches have been used historically for composite sheet forming modeling: mapping and mechanics based methodologies. The earliest and most simplistic analysis tools involve mapping approaches. Comparatively, mechanics based approaches utilized constitutive equations to predict product properties and shape over the course of forming and is therefore a more difficult approach.
2.2.1 Formability
Thermoforming of nonwoven substrates is accomplished through a combination of two material phenomena: rheological and mechanical deformation. Rheological deformation implies that a certain amount a molecular movement is induced though the application of heat to the substrate thus softening the fiber to the point of laminar movement. To maintain fibrous characteristics without considerable change to molecular orientation and crystallinity, a forming temperature above the glass transition and below the melting temperature is used. Mechanical deformation is concerned with the mechanical behaviors of the substrates on a macro scale. In conventional thermoforming processes where deep draws are introduced into the substrate, four fundamental modes of mechanical deformation are observed as seen in Figure 2.2: in plane tension, transverse compression, in-plane shear and out-of-plane bending [44, 61,62,63]. While these are general deformation modes, complexity in mechanical deformation will vary with more geometrically complex molds.
Figure 2.2 Mechanical Deformations in Thermoforming A Dome Structure [41,61]
Formability therefore becomes a dichotomous issue. In the context of mechanical deformation, formability evaluation is concerned with the four types of deformation
FBending
mechanisms mentioned previously that are present during the thermoforming process. Yu et al, studied the correlation between the four fundamental modes of deformation (tensile, bending, in-plane shear, and out-of-plane bending) with a derived conformability index, C.I. The CI was obtained from the measured forming energy of various woven preforms.
CI = Conformability Index
U = Forming Energy, energy required to deform the specimen to a preset displacement
Utilized in this study, was a hemispherical plunger attached to a modified Instron crosshead. The load required to deform a sample to a predetermined depth was recorded, and the area under the load displacement curve produced the forming energy required to deform the specimen. This method is very similar to the Mullen bursts test except that the plunger used is metal, in lieu of a rubber ball with increased pressures aimed to achieve failure.
In terms of rheological properties, appropriate heat and pressure used during the thermoforming process, in conjunction with relative time spent in the mold, and affects the dimensional stability of formed products. This study (Yu et al.), due to the use of graphite preforms did not attempt to evaluate the rheological aspects of formability. Optimizing temperature-pressure-time combinations in addition to selecting appropriate substrates in terms of mechanical behaviors will allow maximum deformation without degradation when manufacturing three-dimensional fiber networks. In addition, utilizing various molds will change the forming energy values and the type of mechanical deformation that is prevalent in that particular forming process [44,61].
U
2.3.2 Forming Limit Diagrams
As described previously, many of the analytical tools used to evaluate the formability of sheet metal have been extrapolated and used to access the formability of thermoplastic composites. Dessenberger et al. utilized forming limit diagrams to access the formability of random fiber mats and developed a mathematical method to express this formability in quantitative manner. The basis for forming limit diagrams was to limit substrate failure during processing, these failures as classified by Dessenberger et al. including wrinkling or tearing during thermoforming and variations in the amount of stretch induced by forming from one area of the substrate to another. Within composites processing, variants in stretch lead to variations in pore size, which in turn lead to permeability differences effecting resin distribution [14]
was developed that describes the local deformation in the mat relative to the allowable deformation.
Drawbacks regarding this method lie firstly in the assumptions regarding the properties of random fiber mats or nonwovens. It is well known that many nonwoven structures can display highly anisotropic behavior, due to fiber orientation, and that this anisotropy is not often “negligible.” In addition, the type of deformation mechanisms present in thermoforming can be very complex, i.e. the loads experienced by the substrate may not be in-plane.
2.3.3 Drawabilty
The largest possible draw ratio or limiting draw ratio obtained before failure classifies drawabilty. Draw ratio in conventional uses encompass the use of area or diameter ratios for before and after molding operations. As the previous techniques were used for sheet metal forming analysis, such was drawabilty determination used to access the formability of self-reinforced thermoplastic sheets [44]. Relative to this study on deep drawing, in terms of nonwoven forming, the draw ratio could be defined the surface area of the formed part to the surface area of the substrate. Specifically, the surface area at which failure occurs could be sued to determined the limiting draw ratio of the substrate.
SAA = Surface area after molding SAB = Surface area before molding
Pede et al postulated that formability of sheet-like materials is determined in great deal by mechanical properties of the material. Specifically, he proposed similar
B A SA SA
deformation mechanisms in forming a small cup to the deformation mechanisms proposed by Yu et al. Often, yield strength, tensile strength, total elongation, and yield point elongation are measured and related to drawing, but do not commonly have a direct or unknown relation to drawability.
Specifically, Pede et al experimented on the drawability of self-reinforced thermoplastic sheets regarding the formation of a simple cup. Pede et al states that increasing the load resistance of a material in the thickness direction relative to its load resistance in the plane of the sheet will improve the drawability of materials. In this regard anisotropic materials have improved drawability over isotopic materials. Additionally, anisotropy is often described as two-dimensional phenomena displayed by apparent differences in the planar properties of the sheet. However, normal anisotropy could be more pronounced than planar anisotropy a determining factor as related to drawability [44].
2.4 Nonwovens and Thermoforming
Despite the types of deformation found in the thermoforming processes described previously, elongation is a parameter of importance due to its relationship to tensile, shear, and to some extent bending properties of the web. Thermoforming a substrate into a complex structure with projections and deep draws rising from an initial plane is a process that increases the total surface area of the substrate. Given the substrate is of finite area, local deformation allows this increase in surface area to be achieved and the three-dimensional fiber network to be realized. Local deformation can be attributed to the extensibility of the substrates under thermoforming conditions, while the tensile, bending, and compressive proprieties of the web limit failure.
This formability failure may display different mechanical properties than formed products that do not “fail.” It is assumed here that the dimensional stability of formed products is related to the amount of mechanical and thermal degradation present, if any, incurred during thermoforming.
3. SpaceNet Thermoforming Process
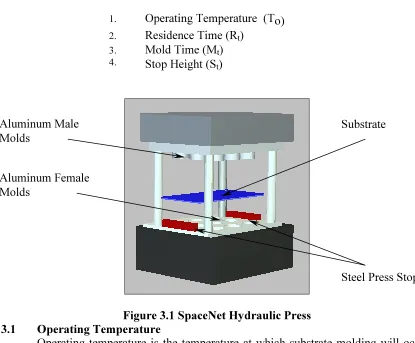
A 50-Ton hydraulic press was utilized for initial molding trials and is displayed schematically in Figure 1.2. Important processing parameters include the following:
1. Operating Temperature (To) 2. Residence Time (Rt)
3. Mold Time (Mt) 4. Stop Height (St)
Figure 3.1 SpaceNet Hydraulic Press 3.1 Operating Temperature
Operating temperature is the temperature at which substrate molding will occur. Through the application of heat, molecular movement is induced within the polymer thus softening the fiber. This fiber softening allows deformation to occur at lower stress levels compared to the stress levels required to deform the fiber when processed at ambient temperatures (15˚ - 30˚ C). To maintain fibrous characteristics without considerable change to molecular orientation and crystallinity, a forming temperature (operating temperature) above but closer to glass transition and below the melting temperature is used. Table 3.1 displays common operating temperatures for the polymers used in this study.
Aluminum Male Molds
Aluminum Female Molds
Table 3.1 Operating Temperatures by Fiber Type
Fiber (ºC)
PP 110-120 PET 190-205
Selection for operating temperature was based primarily on the past processing trials for each fiber type used.
3.2 Residence and Molding Times
Residence time is defined as the time permitted for substrate preheating to occur in this molding process. Residence time should be sufficient to induce and allow for the molecular movement and the subsequent fiber softening described previously. Refer to Table 3.2 for residence times used for each fiber type used in this study.
Table 3.2 Residence Time by Fiber Type
Fiber Residence Time (s)
PP 30-90 PET 30-60
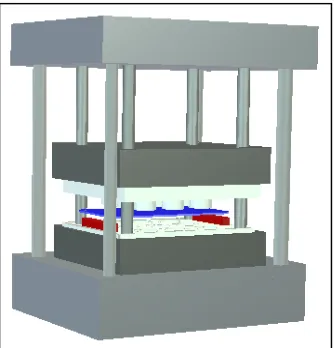
induce substrate deformation. Mold time is therefore measured as the time the substrate is in the deformed state, refer to figure 1.4 for schematic representation. It is important to note that mold time should be sufficient to set the substrate into its deformed state. Insufficient mold times will produce products that will not retain their respective shapes (or three dimensional effect).
Figure 3.2 Press in Residence Phase
Figure 3.3 Press in Molding Phase
purposes for the initial trial. Table 1.3 displays the mold times for each fiber type used in this study.
Table 3.3 Mold Time by Fiber Type
Fiber Mold Time (s)
PP 30-60 PET 15-75
3.3 Stop Height
Stop height is defined as the measured height (mm) of the steel press stops used during thermoforming. Steel press stops limit the depth of penetration through the substrate achieved by the male mold. Stop height therefore impacts formed product dimensions, specifically dome height, which is a measure of formed product thickness. Stop heights are interchangeable and can be varied to achieve the required deformation for each substrate used in this study. Smaller stop heights allow the male mold to penetrate the female mold to a greater depth; this in turn produces thicker projections on the substrate. Comparatively, large stop heights limit the depth achieved by the male mold, which in turn produces smaller projections rising from substrate plane.
3.4 Mold Geometry
The second type of mold geometry available on this thermoforming system is defined as “interdigitated.” This system utilizes two male molds of similar dimension offset (refer to figure 1.4). The type of structure produced using the “interdigitated” system is comprised of projections and depressions rising/falling from the substrate plane as defined previously. Both male molds used in this configuration have equal pin diameters. Three pin diameters are currently available: ½”, 3/8” and ¼”.
Figure 3.4 Interdigitated Mold
Experimental work will be divided into three areas: moldability and compressive properties of nonwoven substrates, evaluating of the maximum deformation achieved and evaluating the effect of mold geometry on compressive properties. With assessing the moldability of webs, the ODF will be assessed and its relation to substrate deformation during molding will be described and related to success or failure in molding. In addition, structural parameters such as the use of short staple systems or filament-based systems will also be used to assess moldability. Evaluating the maximum deformation achieved will involve measuring the effect of temperature, residence and mold time on the maximum dome height or thickness attained. The last component of this work will vary the mold geometry and map how compressive properties shifts with changes in mold geometry by web/substrate.
Cylindrical Pins
Substrate
Additionally, the SpaceNet thermoforming system is unique process compared to other types thermoforming/molding operations. In particular the deep-draw characteristics of the materials produce via this system is the critical difference compared to systems that produce textile materials with a substantial third dimension. As with other types of thermoforming systems, in particular fiber manufacture, draw-ratios are used to assess the amount of deformation imparted during product manufacture. Draw-Ratio (DR) in the context of this report is defined via the following relation:
I SF A A
DR= , (3)
Where ASF is the total final surface area created via thermoforming from an initial surface area, AI. It should be noted that ASF is a calculated parameter, and has only been used to quantify the draw ratio for three-dimensional structures produced from the male/female mold geometry. Three-dimensional structures produced for the current report have theoretical draw ratios ranging from 1.16 to 1.91, depending on substrates basis weigh amount of deformation imparted and specific mold geometry used. Generally the draw ratio will increase as a function of product thickness increases and pin diameter decreases (Graph 1, Appendix A.). Appendix A provides a more detailed description of draw-ratio with the methodology for calculating the final surface area used in above equation.
4. Experimental Work: Determination of Nonwoven Moldability
4.1 Substrates
fabrics acquired from PGI. The following table displays physical characteristics for the substrates obtained.
Spunbond nonwovens are manufactured via extrusion of selected polymer resins followed by collection of the filaments on a moving belt. The ‘web’ produced is then bonded via calendar rolls. Sample Nos. SF 27, SF 44 and SF 94 are all polypropylene and represent the same webs in terms of processing conditions. The only differentiating parameter is the basis weight, as seen in Table 3.1. Sample nos. 2295, 2033 and 2440 are comprised of polyester fibers and represent three different webs, with basis weights held constant, but varying fiber properties.
Table 4.1 Spunbond Samples
Sample Fiber g/m2 Thickness (mm)
Tensile
Strength (kgf) MD/CD Strain at Break MD/CD Fiber Cross Section Fiber Diameter (µ)
SF 27 PP 90 .38 9.3/12.3 27/35.6 R 40-50
SF 44 PP 150 .46 23.9/26.5 39.5/41 R 40-50
SF 94 PP 320 .75 65.7/56.1 35.1/37 R 40-50
2295 PET 100 .43 10.7/9.5 62.1/64.8 R 15
2033 PET 100 .45 12.2/7.8 46.5/46.3 TRI 20
2440 PET 100 .53 5.5/4.2 42.1/48.3 TRI 20
Hydroentanglement is a mechanical bonding mechanism used to entangle fibrous webs utilizing high-pressure water jets. Web formation was accomplished via carding line utilizing short staple polyester fibers followed by subsequent hydroentangling.
Table 4.2 Hydroentangled Samples
Sample Fiber g/m2 Thickness (mm)
Tensile
Strength (kgf) MD/CD Strain at Break MD/CD Fiber Cross Section Fiber Diameter (µ)
PGIT PET 100 1.0 43.5/18.3 27/35.6 R na
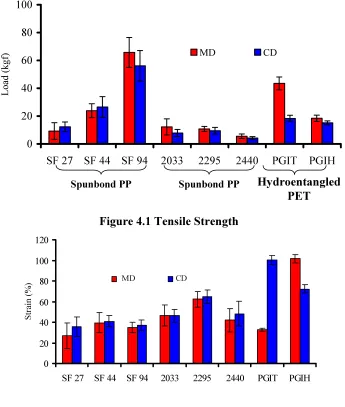
The following figures display the tensile properties of the substrates in terms of both peak load and strain at break.
0 20 40 60 80 100
SF 27 SF 44 SF 94 2033 2295 2440 PGIT PGIH
Load (kgf)
MD CD
Figure 4.1 Tensile Strength
0 20 40 60 80 100 120
SF 27 SF 44 SF 94 2033 2295 2440 PGIT PGIH
Strain (%)
MD CD
Figure 4.2 Strain at Break
Anisotropic behavior in terms of peak tensile load and test direction is a common characteristic of nonwoven mechanical properties as displayed by Figure 4.1. However, the peak strain at break was found to be more anisotropic for the hydroentangled substrates than for the spunbond substrates (refer to figure 4.2). Contributing to the
Spunbond PP Spunbond PP Hydroentangled
phenomena are the different modes of tensile failure found in filament-based substrates compared to short-staple based substrates.
Nonwoven fabric deformation depends primarily on inherent fiber properties, fiber orientation and the degree of bonding/entanglement. Often nonwoven fabrics display anisotropic behavior with variations in properties across the width and length of the web. However, mechanical properties of nonwoven webs follow fiber architecture with a great reliability. The following figures display the fiber orientation of our samples by fabric and polymer type, and provide a graphical representation for anisotropy.
0.0 1.0 2.0 3.0 4.0 5.0 6.0 7.0 8.0
0 20 40 60 80 100 120 140 160
Freqeuecny
Orientation Ang
l
2033 2295 2440
0 1 2 3 4 5 6 7 8
0 20 40 60 80 100 120 140 160
Orientation Angle
Frequency
SF 27 SF 44 SF 94
Figure 4.4 Spunbond PP Fiber Orientation Distributions
0.0 1.0 2.0 3.0 4.0 5.0 6.0 7.0 8.0 9.0
0 10 20 30 40 50 60 70 80 90 100 110 120 130 140 150 160 170 Orientation angle
Frequecny
PGI-T PGI-H
Figure 4.5 Hydroentangled PET Fiber Orientation Distributions
Table 4.3 Fiber Orientation Uniformity Data
Sample Dominate Angle
Cosine Squared Anisotropy
2033 113.056 -0.055
2295 155.317 -0.021
2440 100.075 -0.078
SF 27 135.919 -0.033 SF 44 94.348 -0.044 SF 94 112.843 -0.038
PGI-T 81.786 -0.146
PGI-H 103.395 -0.085
4.2 Formed Product Analysis 4.2.1 Failure Mechanisms
Thermoforming a substrate into a complex structure with projections and deep draws rising from an initial plane is a process that increases the total surface area of the substrate. Inherent fabrics properties will determine how the substrate surface area is increased. The property variations between the webs described above can be attributed to processing conditions, failure mechanisms (in terms of thermoforming) in similar manner may also vary with different processing conditions. In this regards, “success” in thermoforming is described as adequate deformation of the substrates without the presence of holes produced by the interaction of male and female molds during processing. Comparatively, a ‘failure’ is where holes are present after thermoforming.
Table 4.4 Processing Conditions –Analysis 1
Sample Fiber Fabric Type g/m2 To Rt Mt St
SF 27 PP Spunbond 90 110 60 60 12.6
SF 44 PP Spunbond 150 110 60 60 12.6
SF 94 PP Spunbond 320 110 60 60 12.6
2295 PET Spunbond 100 190 30 30 12.6
2033 PET Spunbond 100 190 30 30 12.6
2440 PET Spunbond 100 190 30 30 12.6
PGI-T PET Hydroentangled 170 190 60 30 12.6
PGI-H PET Hydroentangled 100 190 60 30 12.6
The first molding trial produced only two failures: PGI-T and PGI-H. The following figure depicts these failures.
Figure 4.6. Holes produced on PGI-T and PHI-H
a different manner than short staple systems. It is plausible that the spunbond substrates allow a greater amount of draw during thermoforming while maintaining adequate cover over the dome. Short staple systems comparatively will not allow as much fiber draw during thermoforming hence produce holes at similar stop heights to spunbond samples.
Another trend specific to the hydroentangled substrates is the considerable difference in anisotropic behavior for strain at break values compared to the other spunbonded substrates (refer to Figure 3.2). This trend is due to the anisotropic fiber orientation found for the hydroentangled samples (Figure 3.5). For the molds used in this study, a more ‘uniform deformation’ under a load is a favorable property (in terms of MD and CD). Utilizing a web that displays a more random distribution of fiber orientation achieves this uniform deformation and would constitute a more moldable web. The spunbond substrates used in this study display uniformity in fiber orientation, which allows uniform strain to break values to be realized. It is thus concluded the moldability can be associated with fiber architecture, more specifically, where mold geometry governs uniform deformation, a uniform distribution of fiber favors thermoforming in terms of moldability.
4.2.2 Compression-Recovery Properties
Concluding the formed product analysis is the evaluation of the compression-recovery properties of the formed products produced thus far. No ‘standard’ test method exits for the compressive properties of nonwoven materials. Consequently, a method was developed which gave the following parameters were use in this evaluation:
-Platen Separation: 10 mm
-Crosshead Speed: 1mm/min to 40 % strain -Specimen thickness: taken at .005 kgf
-Sample Size: 10cm2
A 40 % strain value was selected so as to accommodate the small structural changes found in the domes. The type of deformation during substrate molding produced a truncated cone as displayed in Figure 4.7. Approaching 40% strain ensures that compression would surpass the point where the dome changes from a more cylindrical shape to a more conical shape. In doing so the effect of this shift in dome dimensions on compressive properties would be accounted for.
Figure 4.7 Dome Structure
The following compression–recovery curves represent alls samples produced using the processing conditions stated in table 4.3. For comparative purposes the hydroentangled substrates, process at a stop height of 14.4 mm are included here (due to failure incurred at 12.6 mm as described previously).
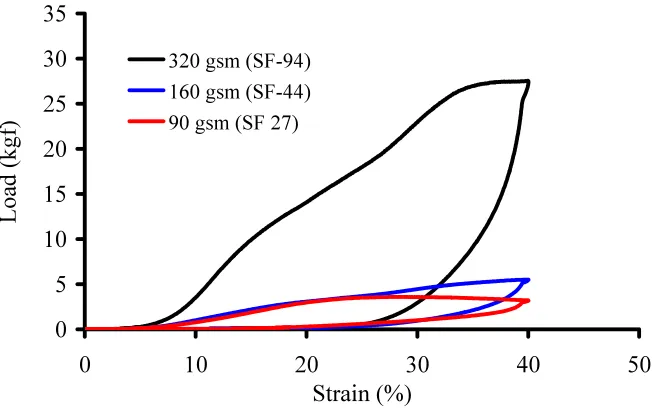
4.2.2.1 Spunbond Polypropylene
Observing samples SF 27, 44 and (refer to figure 4.8 and 4.11 below). These samples represent the same products at three different basis weights (refer to table 4.4 of data regarding substrate properties). An initial indication is given as how increases in basis weight affect the compressive properties of three-dimensional nonwovens.
0 5 10 15 20 25 30 35
0 10 20 30 40 50
Strain (%)
Load (kgf)
320 gsm (SF-94) 160 gsm (SF-44) 90 gsm (SF 27)
Figure 4.8 Compression Recovery for Spunbond Polypropylene
For polypropylene spunbond samples is it observed that increases in basis weight improve the compressive properties of formed products. However, lighter webs display a different compressive behavior than heavier webs. A closer look at SF 27 in figure 3.7 reveals that after a certain strain (~25%), the force required to deform the sample will decrease. Comparatively, for SF 94 (320 gsm), the force required to deform the sample continues to increases past 25% strain and then plateaus closer to 40% strain. Maximum resistance to compressive forces is achieved at lower strains for lighter webs, which is in part due to inherent stiffness of the substrate and the number of fibers per unit area available to resist compressive forces. Differences in dome geometry also play a role in this behavior and will be addressed in later.
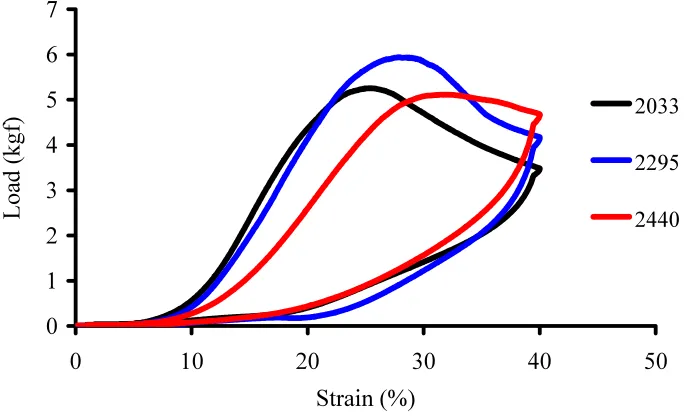
4.2.2.2 Spunbond Polyester
different fiber cross sections employed in extrusion. When isolating the polyester spunbond samples, i.e. sample 2033, 2295, and 2044, incremental differences in compressive stress are observed. . Substrates 2440 and 2033 utilize trilobal cross-section while 2295 employs a circular cross section during substrate manufacture. Statistical analysis for peak load values makes this a robust conclusion. Round or circular fiber cross sections exhibit greater stiffness values for similar diameter when compared to other cross sections. Improved or increased fiber stiffness will therefore have a concurrent impact on dome properties. This may explain why sample 2295 reports a larger compressive stress than the other the samples. The compression recovery behavior of the PET samples display differences regarding at what strain values that peak loads are experienced. Figure 4.9 displays these differences.
0 1 2 3 4 5 6 7
0 10 20 30 40 50
Strain (%)
Load (kgf)
2033
2295
2440
Figure 4.9 Compression Recovery for Spunbond Polyester
drop in the compressive force required to deform the sample after certain strain values. More specifically, 2033 and 2295 encounter a more dramatic drop in compressive force required to deform the sample further (to 40%).
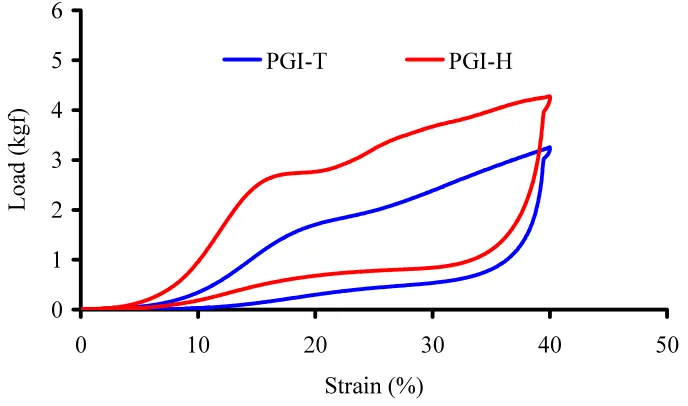
4.2.2.3 Hydroentangled Polyester
Because failure occurred at a stop height of 12.6 mm for the hydroentangled substrates described previously, the following compression-recovery curves (Figure 4.10) are taken from substrates processed with a stop height of 14.4 mm. The compressive – recovery behavior of hydroentangled samples tend to display greater recovery compared to other samples, in addition it is observed that peak load may not have been achieved at 40% strain. The failure to achieve peak load is contributing factor to the improved recovery of hydroentangled structures.
0 1 2 3 4 5 6
0 10 20 30 40 50
Strain (%)
Load (kgf)
PGI-T PGI-H
4.2.2.4 Compressive Stress Comparisons for All Substrates
Figure 4.11 below displays the compressive stress values for all substrates studied. ANOVA analysis reveals that the mean compressive stress differs significantly between substrates (p <0.00001) (refer to figure 4.11). .
0 5 10 15 20 25
SF 27 SF 44 SF 94 2440 2033 2295 PGI_T PGI_H
Peak Stress (psi)
Figure 4.11 Compressive Stress: All Substrates
Table 4.5 Analysis of Variance for Differences in Compressive Stress
Source DF Sum of Squares Mean Square F Value P-Value
Substrates 7 1401.47035 200.21005 307.922874 < 0.00001
Error 40 26.0078178 0.65019544
Total 47 1427.47817
The compressive secant modulus (to 15% strain) was also measured for all substrates. Modulus to 15-% strain was selected based on observation that up to 15% strain, the rate of loading has increased significantly from O-% strain for all substrates evaluated. Secant modulus to 15-% strain becomes a material property only useful in comparing one sample to another within the confines of this study. Referring to figure
4.12 it is observed that the modulus means differ significantly among substrates (p < 0.001).
0.0 0.3 0.5 0.8
SF 27 SF 44 SF 94 2440 2033 2295 PGI_T PGI_H
Secant Modulus (psi
)
Figure 4.12 Compressive Secant Modulus: All Substrates
Table 4.6 Analysis of Variance For Differences in Compressive Secant Modulus
Source DF Sum of Squares Mean Square F-Value P-Value
Substrate 7 0.653 0.09327 61.6592 < 0.0001
Error 40 0.061 0.00151
Total 47 0.713
Grouping samples by basis weight, variation does appear based on polymer type. For example, SF 27, 2295, 2033, 2440 and PGI-H all report basis weight values around 100 g/m2. Sample SF 27 is comprised of polypropylene and reported the lowest compressive stress across spunbond and hydroentangled samples at similar basis weights. Within polypropylene samples (SF 27, SF 44, and SF94), increases in basis weight are associated with increases in compressive stress. It is hypothesized that the “level of bonding” within nonwoven web plays a fundamental role in determining the compressive
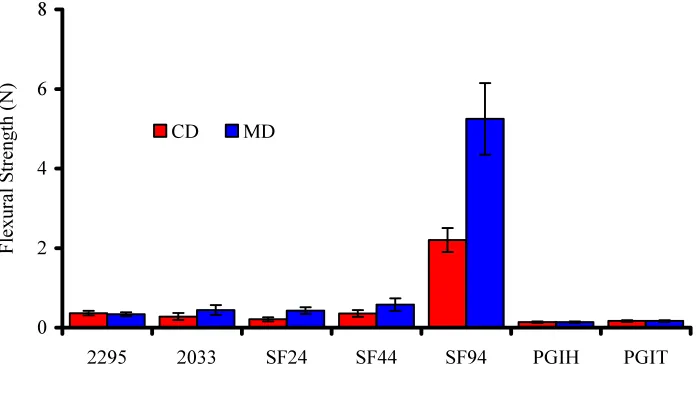
properties of nonwoven substrates. Measuring the flexural and tear properties for a given substrate may indicate the “level of bonding” imparted during substrate manufacture.
Figures 4.12 and 4.13 displays the trapezoidal tear strength and bending stiffness, respectively for each substrate. Trapezoidal tear strength via ASTM-D5733-99 was used to assess tear properties [71]. Because the substrates are relatively stiff materials the cantilever-bending test proved inadequate. Therefore, flexural strength was measured via four-point bending utilizing two loading noses that impact and bend a substrate sample that rests upon two supporting noses [3]. A load–extension curve is therefore produced. For elastic materials catastrophic failure does not occur, therefore peak load was used as a measure of flexural strength when bending a given sample. Machine direction (MD) samples were tested with loading noses flexing a sample perpendicular to the machine direction while cross direction (CD) samples were tested with loading noses flexing a sample perpendicular to the cross direction.
0 10 20 30 40 50 60 70
2295 2033 SF 27 SF 44 SF 94 PGI T PGI H
kgf/mm
MD CD
0 2 4 6 8
2295 2033 SF24 SF44 SF94 PGIH PGIT
Flexural Strength (N)
CD MD
Figure 4.14 Substrate Flexural Strength
It was hypothesized the compressive stress is associated with several substrate characteristics including basis weight and the “level of bonding”. The compressive stress of all formed products (y, or dependent variable) was regressed against independent variables: substrate tear strength (x1), flexural strength (x2), and basis weight. (x3). Note that one replicate was used thus providing the following (full) linear model:
i i i
i
i
x
x
x
Y
=
β
0+
β
1 1+
β
2 2+
β
3 3+
ε
β0, β1, β2, β3 are all regression parametersWhere i =1 to n εi ~N (0, σ2). iid
Table 4.7 Analysis of Variance of Regression Model
Source DF Sum of Squares Mean Square F-Value P-Value
Model 3 225.9403 75.31348 91.38 0.0019
Error 3 2.47265 0.82422
Total 6 16.29182
Root MSE 0.90786
R-Square 0.9892
Coefficient of variation 16.29182
Under the null hypothesis (Ho), all regressions coefficients equal zero, implying that all independent variables, i.e. tear strength, (x1), flexural strength (x2), and basis weight. (x3) have no linear association on the dependent variable, compressive stress. At 95-% confidence the null hypothesis is rejected and a linear association is concluded (p=0.0019). A reported R-square value of 0.9892 indicates the model fits well with the data.
Table 4. 8 displays the partial estimated regression coefficients for the regression model proposed. Flexural strength is observed to have a positive linear association with compressive stress (p=0.062). Tear strength (β1) and basis weight (β2), do not display a strong linear association with compressive stress based on the partial estimated regression coefficients (p= 0.4327 and 0.7721), respectively. However, table 4.9 reports correlation coefficients of 0.8158 and 0.90347 for tear strength and basis weight, respectively.
Table 4.8 Partial Regression Coefficients
Variable DF Estimate Standard t-value p-value
Intercept (β0) 1 2.08980 1.22422 1.71 0.1856
Tear strength (β1) 1 -0.04347 0.04809 -0.09 0.4327 Flexural strength (β2) 1 4.97215 0.71829 6.92 0.0062 Basis Weight (β3) 1 0.00440 0.01389 0.32 0.7721
It is observed that the flexural properties have a greater impact on the compressive stress of three-dimensional structures from nonwovens than tear strength and basis weight (this assumption is also evidences by the 0.9929 correlation coefficient recorded in table 4.9). Specifically, the stiffer the substrate prior to thermoforming, the greater the compressive stress the resultants structure will provide.
Table 4.9 Pearson Correlations Coefficients
Compressive Stress (y 1)
Tear strength (x1) 0.8158 (p=0.253)
Flexural strength (x2) 0.99296 (p<0.0001)
5. Experimental Work: The Effect of Processing Parameters on Maximum Deformation
5.1 Factors and Response Variable
A 50-Ton hydraulic press was utilized for initial molding trials and is displayed schematically in Figure 2.
Figure 5.1 SpaceNet Hydraulic Press
5.2 Operating Temperature
Operating temperature (T) is the temperature at which substrate molding will occur. Through the application of heat molecular movement is induced within the polymer thus softening the fiber. This fiber softening allows deformation to occur at lower stress levels compared the stress levels required to deform the fiber when processed at ambient temperatures (15˚ - 30˚ C). To maintain fibrous characteristics without considerable change to molecular orientation and crystallinity, a forming temperature (operating temperature) above, but closer to glass transition and below the melting temperature is used. For polyester fibers (which make up the polymer content of Aluminum Male
Molds
Aluminum Female Molds
the substrates used in this study) the glass transition temperature and melting temperature are 120˚C and 260˚C, respectively.
5.3 Residence and Molding Times
Residence time (R) is defined as the time permitted for substrate preheating to occur in this molding process. Residence time should be sufficient to induce and allow for the molecular movement and the subsequent fiber softening described previously. Because a direct preheating chamber is not available, machine design dictated preheating the substrate by lowering the press to the point where the heated male and female molds are in direct contact with the substrate. The time that the press is in the lowered position before deformation occurs is recorded as residence time (in seconds). We assume that the heated molds resting on the surface of the substrate would allow for adequate thermal transfer and induce fiber softening. After preheating is complete (as defined by residence time) the press is completely lowered to induce substrate deformation. Mold time (M) is therefore measured as the time the substrate is in the deformed state. It is important to note that ‘mold time’ should be sufficient to set the substrate into its deformed state. Insufficient mold times will produce products that will not retain their respective shapes (i.e. three-dimensional effect).
5.4 Response Variable: Maximum deformation
are adjustable and can be varied to achieve maximum deformation achieved for the substrate used in this study. Smaller stop heights allow the male mold to penetrate the female mold to a greater depth; thus in turn producing thicker projections on the substrate. Comparatively, large stop heights limit the depth achieved by the male mold, which in turn produces smaller/thinner projections rising from substrate plane. The smaller the stop heights the more deformation the substrate will undergo. Stop height therefore impacts formed product dimensions, specifically formed product thickness. It should be noted that there is a limit in regards to stop height, i.e. exceedingly low stop heights the will allow the male mold to completely penetrate the substrate, thus producing holes or a failure in processing.
The manipulation of stops heights will be the measurement tool used to evaluate maximum deformation or maximum-formed product thickness. It is proposed that for each treatment combination a series of stop heights will be used beginning with high stop heights (10 mm) and continuing with lower stops heights until the male mold penetrates the substrate. For example, for one treatment combination the initial stop height will be 10 mm and a sample will be produced, the next sample a stop height of 8 mm will be used, then 6mm. etc. At a particular stop height the male mold will completely penetrate the substrate surface producing holes (i.e. failure has occurred). The stop height and the relative substrate that produced the greatest product thickness before failure occurred will be used as a measure of maximum deformation (or product thickness measured in mm)
Table 5.1. Factors and Response Variables
Factor Levels
T: Temperature (˚C) 160 (0), 175 (1), 190(2) R: Residence Time (s) 15 (0), 45(1), 75 (2)
M: Mold Time (s) 10 (0), 40(1)
Response Variable
Maximum Deformation mm
Table 5.2 Treatment Combinations
Run T R M Label
1 0 0 0 T0R0M0
2 0 0 1 T0R0M1
3 0 1 0 T0R1M0
4 0 1 1 T0R1M1
5 0 2 0 T0R2M0
6 0 2 1 T0R2M1
7 1 0 0 T1R0M0
8 1 0 1 T1R0M1
9 1 1 0 T1R1M0
10 1 1 1 T1R1M1
11 1 2 0 T1R2M0
12 1 2 1 T1R2M1
13 2 0 0 T2R0M0
14 2 0 1 T2R0M1
15 2 1 0 T2R1M0
16 2 1 1 T2R1M1
17 2 2 0 T2R2M0
18 2 2 1 T2R2M1
5.5 Experimental Design
given temperature should be completed consecutively. The proposed design groups 3 treatment combinations into six whole plots. Specifically, mold time and temperature will be grouped into whole plots. Reducing whole plots to a size of three will allow a degree of randomization of temperature to be accomplished. Therefore the randomization scheme will be as follows:
1. Group treatment combinations by temperature and mold time and randomize the run order of the respective residence times.
2. Randomize the order in which the whole plots (temperature and mold time groupings) will be run.
The following tables outline the run order for experimental design
Table 5.3. Randomized Run Order
Run T M R Label Run T M R Label 1 0 1 2 T0M1R2 10 0 0 2 T0M0R2 2 0 1 1 T0M1R1 11 0 0 1 T0M0R1 3 0 1 0 T0M1R0 12 0 0 0 T0M0R0 4 2 0 2 T2M0R2 13 2 1 0 T2M1R0 5 2 0 0 T2M0R0 14 2 1 1 T2M1R1 6 2 0 1 T2M0R1 15 2 1 2 T2M1R2 7 1 1 1 T1M1R1 16 1 0 1 T1M0R1 8 1 1 2 T1M1R2 17 1 0 2 T1M0R2 9 1 1 0 T1M1R0 18 1 0 0 T1M0R0
5.5 Statistical Methods and Data
implications of this on the analysis will be discussed below. Table 4 displays the data obtained.
Table 5.4 Response Data
Run Label T M R Mean Max. Deformation (y)
1 T0M1R2 0 1 2 6.5731429
2 T0M1R1 0 1 1 6.1217143
3 T0M1R0 0 1 0 6.0118571
4 T2M0R2 2 0 2 7.9664286
5 T2M0R0 2 0 0 6.7878571
6 T2M0R1 2 0 1 7.5014286
7 T1M1R1 1 1 1 6.7188571
8 T1M1R2 1 1 2 6.8031429
9 T1M1R0 1 1 0 6.7102857
10 T0M0R2 0 0 2 5.519
11 T0M0R1 0 0 1 6.1757143
12 T0M0R0 0 0 0 5.7667
13 T2M1R0 2 1 0 6.863
14 T2M1R1 2 1 1 7.6952857
15 T2M1R2 2 1 2 8.1027143
16 T1M0R1 1 0 1 6.527
17 T1M0R2 1 0 2 7.0852857
18 T1M0R0 1 0 0 6.2118571
5.6.1 Statistical Analysis
5.6.1.1 Full Model
As described above a spilt-plot experimental design was used to evaluate the effect of temperature and residence time and mold time on maximum deformation. Note that one replicate was used thus providing the following (full) linear model:
ijk jk ik
k ij j i
ijk
T
M
R
TR
MR
Y
=
µ
+
+
+
δ
+
+
(
)
+
(
)
+
ε
Where Yijk represents the observation from the ith temperature at the jth mold time at the kth residence time. Additionally δij & εijk are random effects, all others (T, M, and R ) are fixed.
5.6.1.2 ANOVA
To determine the presence of main effects and interactions F-Tests were conducted. The following table displays the ANOVA results for this experiment. (Note: Type I sums of squares are reported/full model).
Table 5.5 Analysis of Variance
Source DF Sum of Squares Mean Square F Value P-Value
Temperature 2 6.40438922 3.20219461 81.96 0.0121
Mold Time 1 0.23546464 .23546464 6.03 .1335
Whole Plot 3 0.0781369 0.03906845 .34 0.7282
Residence Time 2 1.17202111 0.58601055 5.15 0.0781 Temperature*Residence Time 4 0.63798149 0.15949537 1.40 0.3754 Mold Time* Residence Time 2 0.03209102 0.01604551 0.14 .8725
Error 6 0.45474787 0.11368697
Total 17 9.01483224
To determine the presence of a temperature effect, the following F-ratio was used
) (
) (
Whole MS
e Temperatur MS
F = 81.96
03906845 .
0
20219461 .
3 =
=
An F-ratio of 81.96 (p =. 0101) as noted in table 5 and above suggests the presence of a temperature (T) effect among the data under 95% confidence. Therefore it is concluded that temperature will impact the maximum deformation achieved by a substrate.
) ( ) ( Error MS MoldTime MS
F = 6.03
03906845 . 0 23546464 . 0 = =
With a reported F-ratio value of 6.03 (p=0.1355) the presence of a mold time effect is concluded insignificant with 95% confidence. Mold time therefore does not influence the maximum deformation achieved by a particular substrate. Above conclusions are consistent with assumptions made before experimentation. It was believed that mold time has little effect on product thickness and therefore maximum deformation based on the fact the measurement of mold time begins after substrate deformation has already occurred.
Determining the presence of a residence time (R) effect involves calculating the appropriate F-critical value for residence time effect, which includes using the sub-plot error or mean square error in the F-ratio. Therefore the following relation was used
) ( ) (Re Error MS e sidenceTim MS
F = 5.15
113 . 0 586 . 0 = =
As described previously, whole plots are completely confounded with mold time. Therefore the test for the presence of a plot effect includes both mold time and the mold time*temperature interaction. Therefore the mold time*temperature interaction is not estimable. Fore reason described above (whole plots confounded with mold time) the only tests for the two-factor interactions that can be completed are the mold time and residence time and residence time and temperature interactions. Testing for the presence of a Residence Time * Temperature Interaction involves utilizing the following F-ratio:
) ( ) * (Re Error MS e Temperatur e sidenceTim MS
F = 1.40
113 . 0
0.15949537 =
=
From table 5 above this ratio has a value of 1.40 (p=0.3750) indicating the lack of a Residence Time * Temperature interaction (with 95% confidence). Testing for the presence of a mold time*residence time interaction involves using the following relation:
) ( ) Re * ( Error MS e sidenceTim MoldTime MS
F = .140
113 . 0
0.01604 =
=
The following interaction plot shows responses averaged over mold time.
5 6 7 8 9
15 45 75
Residence Time (s)
Max. Def. (mm)
Figure 5.2 Interaction Plots of Residence Time and Temperature
The plot above shows that increases in temperature will increase the maximum deformation or product thickness for the substrate used. Additionally for higher temperatures (175˚C and 190˚C), increases in residence time will also increase the maximum deformation achieved. At the lowest temperature used (160˚C), initial increases in maximum deformation are observed followed by a decrease at the highest residence time. It should be noted that no significant interactions were observed in the statistical analysis conducted.
5.6.1.2 Factor Means
The following table displays the factor level means for all estimable factors Table 5.6 Residence Time (Level Means)
Temperature (˚C) Max. Deformation (mm) 160 (0) 6.028 (0.1961) 175 (1) 6.676 (0.1961) 190 (2) 7.486 (0.1961) Table 5.7 Temperature (Level Means)
Residence Time (s) Max. Deformation (mm) 15 (0) 6.3919 (0.1595) 45 (1) 6.7900 (0.1595) 75 (2) 7.0082 (0.1595)
5.6.1.3 Linear and Quadratic Contrasts
The linear and quadratic effects of both temperature and residence time were estimated. Estimating the linear effect of temperature with maximum deformation is given by the following contrast:
458 . 1 028 . 6 846 . 7 .. 0 ..
114 . 0 6 039 . 0 * 2 6 )) ( ( 2 )
(Y2.. −Y0.. = MS Whole = = SE
Linear Temperature Effect: 1.458 (0.114)
The value reported here suggests that a positive linear trend characterizes the relationship between temperature and maximum deformation. Estimating the linear effect with respect to residence time however is given by the following contrast:
6163 . 0 3919 . 6 0082 . 7 0 .. 2
.. −Y = − =
Y 1375 . 0 12 1136 . 0 * 2 12 ) ( 2 )
(Y..2 −Y..0 = MS Error = =
SE
Linear Residence Time Effect: 0.6163 (0.1375)
As with temperature, a positive linear relationship between residence time and maximum deformation is suggested by the values reported above.
To estimate the presence of a quadratic effect for temperature the following contrast is used. 162 . 0 486 . 7 ) 676 . 6 ( 2 028 . 6 ) 2
(Y0.. − Y1.. +Y2.. = − + =
1974 . 0 039 . 0 ) ( ) 2
(Y0.. − Y1..−Y2.. = MS Whole = = SE
Quadratic Temperature Effect: 0.162 (0.1974)
The lack of a quadratic effect temperature suggested by the data supports the assumption of that a linear effect is present for temperature.
1799 . 0 0082 . 7 ) 79 . 6 ( 2 3919 . 6 ) 2
(Y..0 − Y..1 +Y..2 = − + =−
337 . 0 1136 . 0 ) ( ) 2
(Y..0 − Y..1−Y..2 = MS Error = =
SE
Quadratic Residence Time Effect: -0.1796(0.337)
The lack of a quadratic effect of residence time is also suggest suggested by the data and additionally supports the conclusion that a linear effect is present for residence time.
5.7 Conclusions
Based on the experimental work and statistical analysis completed to date the following conclusions come forth.
Temperature has been shown to affect (increase) the maximum deformations of nonwoven substrates.
Residence time has been shown not affect the maximum deformation of nonwoven substrates.
Mold time has been shown not to affect the maximum deformation of nonwoven substrates.
The presence of an interaction between temperature and residence time has not been established.
The presence of an interaction between mold time and residence time has not been established
Due to the lack of a residence time effect and a temperature*residence time interaction it can be concluded that temperature and residence time effect maximum deformation independently (i.e. increases in product thickness can be achieved via adjustments in temperature alone).
Due to whole plot confounding with mold time the presence or lack thereof of mold time*temperature and other higher order interactions (three factor interactions) cannot be determined with confidence.
The effect of temperature on maximum deformation can be described as a positive linear relationship.
6. The Effect of Mold Geometry on Compressive Properties
Apparent affects of adjustments in mold geometry include changes in product dimension and form. What has been investigated in the current work was how adjustments in mold geometry translate into shifts in compressive properties of the formed products produced in this study. Pin diameter, a component of mold geometry, affects how much deformation is introduced to the specific substrate. In addition, it provides the simplest way to change final product dimension and form and will be used to describe mold geometry for the reminder of this thesis. Three pin diameters were used: ½”, 3/8” and ¼”, and all substrates (8 in total) were processed at each respective pin diameter.
6.1 Substrates
PET/CoPET spunbond webs were used and acquired from commercial sources. Basis weights ranged from 100 g/m2 to 180 g/m2. Mechanical tests were conducted on all substrates and data is reported in table 6.1. Note the relatively isotropic tensile properties of the substrates.
Table 6.1 Substrate Properties
Sample g/m2 Fiber Type Strain at Break MD/CD Peak Tensile Load (kgf) MD/CD
2295 100 PET 62.1/64.8 9.3/12.3
2033 100 PET 42.1/48.3 12.2/7.8
052-100 100 PET/CoPET 30.21/34.57 9.9/7.9
052-140 140 PET/CoPET 32.9/37.7 15.12/10.96
052-180 180 PET/CoPET 37.7/38.25 20.7/16.6
072-100 100 PET/CoPET 30.42/35.1 6.2/5.5
072-180 180 PET/CoPET 40.40/40.35 13.76/14.24
056-130 130 PET/CoPET 27.6/33.9 11.05/11.14