THE CHROMOSOME OF BACZLLUS SUBTZLZS. I. THEORY
OF MARKER FREQUENCY ANALYSIS NOBORU SUEOKA A N D HIROSHI YOSHIKAWA2
Department of Biology, Princeton Uniuersity. Princeton, New Jersey Received April 28, 1965
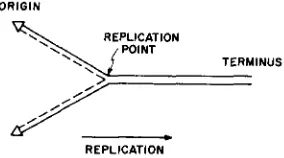
REPLICATION of different genetic markers of Bacillus subtilis has a definite temporal order (YOSHIKAWA and SUEOKA 1962, 1963a,b). The simplest inter- pretation of the results is that replication of the chromosome of B. subtilis starts from one fixed position (origin) and proceeds sequentially along the chromosome. A schematic representation of the model is given in Figure 1. The model is one of the obvious predictions from the structural model of DNA (WATSON and CRICK
1953) and dual units of chromosome (TAYLOR,
WOODS
and HUGHES 1957). Sup- porting evidence f o r the model in B. subtilis has been presented, and other alter- native models have been discussed (YOSHIKAWA and SUEOKA 1963a). I n the present series of papers, the detail of our work on the B. subtilis chromosome will be reported. This first paper describes the theoretical treatments which have played a n indispensable role in guiding and planning our experimentation. Theories which may account for some unexpected discoveries made during the work are also presented.A G E DISTRIBUTION O F CHROMOSOMES
The total length of the chromosome is represented as 1, thus assigning position 0 to the origin of the replication, and 1 to the terminus. The position of the repli- cation point (z) therefore, may represent the “age” of the chromosome. In an exponentially growing cell population, the age distribution function of chromo-
ORIGIN
REPLICATION POINT
\
TERMINUS/---
/____) REPLICATION
FIGURE 1.-A replication model of the chromosome. The solid line represents the old strand and the broken line the newly synthesized strand, This model does not differ, in principle, from a circular chromosome model i n which replication starts from a fixed point in one direction.
This wiirk was supported hy grant GB-1518 from the National Science Foundation, and by grant GM 10923 from Present address: Space Sciences Laboratory, University uf California, Berkeley.
the Public Health Service.
748 N. SUEOKA et
al.
f l n ) a(X)
0 0.2 0.4 0.6 0.8 1.0
REPLICATION POINT ( x )
0 0 . 2 0.4 0.6 0.8 1.0
POSITION OF MARKERS ( X I
FIGURE 2.-Graphic representation of the "age" distribution of chromosomes in a n ex- ponentially growing population. The position of the replication point on the chromosome is expressed as 5.
FIGURE 3.-Graphic representation of rela- tive frequencies of genetic markers a t different positions on the chromosome in an exponenti- ally growing population. The marker fre- quency function (or mapping function) g ( X ) is not normalized; the integration of g(X)
from X = 0 to X = 1 gives l / l n 2.
somes, f(z), should take the form of an age distribution function for binary dividing cells derived
by
POWELL (1956),
and can be given,The derivation assumes that there is no resting period, each chromosome has one replication point, and the replication proceeds at constant speed. The constant
(In 2) is given to normalize the function. A graph of the function is shown in Figure 2 .
f(z) = (Zn2) 2l-" ( 1 )
MARKER FREQUENCY
The frequency g ( X ) of a marker ( X ) located at X on the chromosome can be
obtained from equation 2 in a cell population in which equation 1 is satisfied.
X
g ( X )
=Io
f(z)dz+
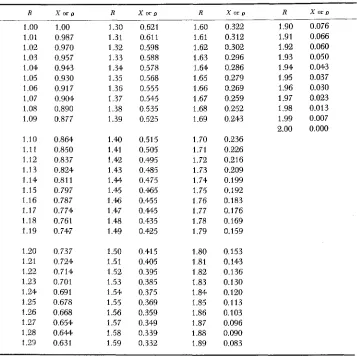
2 l:f(z)dz ='2l-x (2)This equation may be called the marker frequency function. A graph of the equation is shown in Figure 3. The numerical relation of the function is given in Table 3 . Note that g ( 1) = 1, thus the function can serve as a mapping function
to locate a gene ( X ) from its relative frequency to the frequency of another gene
( X , ) of known location. The general relation is
(3)
g ( X ) =- g ( X >
.
~ g ( X d - - ___ g ( X >! z1-x0
CHROMOSOME OF Bacillus subtilis 749
g ( X ) / g ( X , ) represents the frequency ratio of marker
X
and markerX , .
The experimental estimate of the ratio g ( X ) / g ( X , ) is being expressed as R ( X / X , ) . A marker close to the terminus being available, the frequency of such a marker can serve as g ( 1 ).
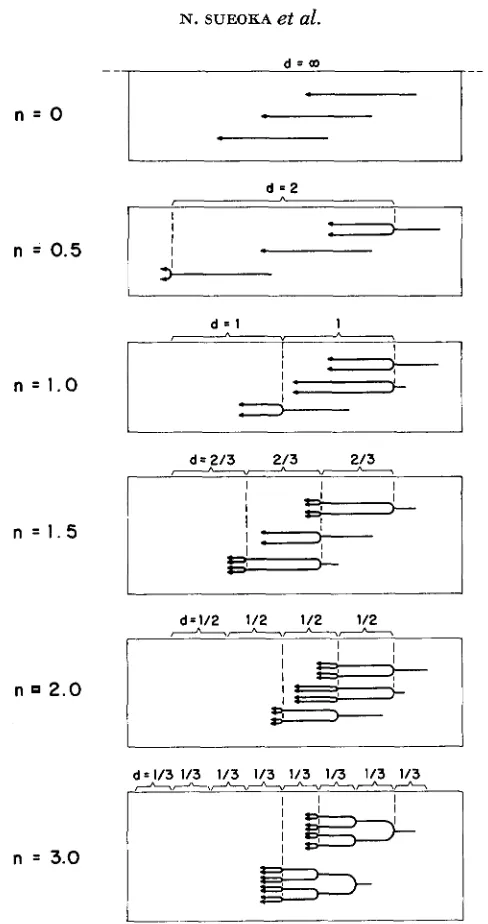
In reality, using the transformation system requires another standardization to compensate for the difference of transforming efficiency among different markers. This point will be treated later.Equation 2 can be extended to situations where the number of replication positions is more than, or less than, 1. The replication position is defined as the position of a set of equivalent replication points on a chromosome. Replication with more than one replication position is called multifork replication, and repli- cation with less than one replication position implies the presence of a resting period. For our theoretical treatment, a symmetrical branching for multifork replication (dichotomous replication) was assumed (Figure 4). I n this replica- tion scheme, the distance between replication positions is taken to be equal, so that the separation of two daughter chromosomes, namely doubling of the chro- mosome, occurs in equal time intervals. This satisfies the steady state of cell division during the exponential growth phase. For a n average number of repli- cation positions per chromosome ( n ) , equation 2 becomes
(4)
This equation can be derived easily when one applies equation 2 to each segment( l / n ) of the chromosome and then constructs the solution for the whole chromo- some. Equation 4 can take any positive values for n and is called the equation of
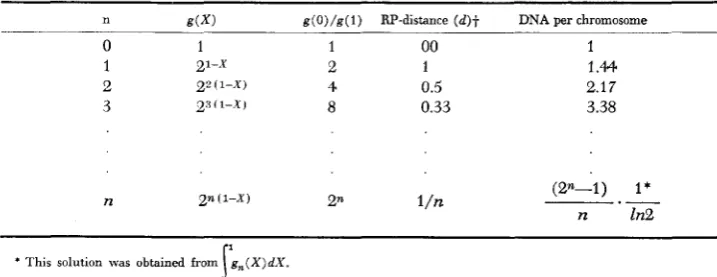
chromosome replication. For different values of n, various quantities which are associated with n are given in Table 1 and schematic diagrams of dichotomous chromosomes are shown in Figure 4. When n is smaller than 1 , it means that a fraction of the cell population has chromosomes with no replication point, namely, resting chromosomes (Figure 4 ) . I n other wards, one generation time includes a resting period (p)
.
The situation is represented in Figure 5.When n
<
1 , the relationship between resting period ( p ) and the average number of the replication position ( n ) is:n = 1-p ( 5 )
(6)
A convenient estimation of the resting period (p) as well as the number of replication positions per chromosome ( n ) can be made from the ratio of marker 0 and marker 1 R ( 0 / 1 ) by the relation,
g, ( X ) = Qn(1-X)
and
g ( x )
= 2(1-p) (1-27Thus
p = 1-3.32 log [R(0/1)]
or n = 3.32 log [R(O/l)] (7)
750 N. SUEOKA et aZ.
n = O
n = 0 . 5
n = 1.0
n = l . S
n 2.0
n = 3.0
5--
d = 2I I
I
I 1 I
3
I
I
d = l 1
d = 2 / 3 2/3 213
-
*
-I I I
I I
I I
t'
I 2+ t-
1-
L
I
d=1/2 1/2 1/2 1/2
nkkh
I I
I I
I
I t
I
-I L
1 4
5-
d=1/3 1/3 1/3 1/3 1/3 1/3 1/3 1/3
++\-nn++
I
IFIGURE 4.-A schematic representation of chromosomal states with different numbers of repli- cation positions per chromosome. The unit of the length for d is the length of the chromosome. A few chromosomes are shown for each population. n: average number of replication positions per chromosome; d: distance hetween replication positions.
CHROMOSOME OF Bacillus subtilis 75 1
P
1
-ONE
I
GENERATIONA
II I
1
I REPLICATING PERIOD
I
RESTING PERIOD I0 1
FIGURE 5.-Replication period and resting period within one cell generation. In the resting
period, the chromosome is in completed form and not replicating. Relative position of the resting
period within a cell generation dces not affect the present calculations and, therefore, should be considered arbitrary.
of each replication point is constant without regard to the length of cell genera- tion time (MAALOE, personal communication). In reality, the duration required for one R P to complete chromosome replication may depend on the rate of cell division. In the treatment shown by equation 4, the absolute time required for chromosome replication is not included as such. The time can be determined, however, from the cell generation time and the observed value of n.
Principle of mapping b y the marker frequency method and the nature of
errors inuolved: Since the efficiency of transformation vanes from marker to
marker due to differences in the integration efticieny (LERMAN and TOLMACH
1957; HOTCHKISS and EVANS 1958), mere comparisons of numbers of transform- ants for different markers do not tell us the actual frequencies of the markers in the DNA preparation in question. This difficulty can, however, be resolved, if we find a condition in which all markers are equally frequent. This condition should provide a standard, and the relative frequencies of markers in exponential cultures can be obtained by reference to those in the standard. In fact, the stand- ard condition has been fulfilled in stationary phase cells (in strain 23 and not in strand 168) and in spores (in both strains 23 and 168) (SUEOKA and
YOSHI-
K A W A 1 963; YOSHIKAWA, O'SULLIVAN and SUEOKA 1964). TABLE 1
Various quantities associated wiih the equation of chromosome replication (equation 4 )
n g ( X ) g(O)/g(l) RP-distance ( d ) + DNA per chromosome
0 1 1 00 1
1 21-x 2 1 1.44
2 p ( 1 - x ) 4 0.5 2.17
3 2" ( I - x 1 8 0.33 3.38
n (2n-1) I*
n In2
-.-
* This solution was obtained from
t For the cases where the rate of replication at each replication possition (PR) is independent of n, t h e RP-distance g , , ( X ) d X .
r.
752 N. SUEOKA et al.
The principle of mapping is, therefore, to compare the relative frequency of a marker to another between exponential DNA and standard DNA. Thus, for markers A and B , the ratio,
is the experimental equivalent of g ( A ) / g ( B )
.
In the equation, TE ( A ) and T E ( B )are the numbers of transfomants for markers A and B when a sample of compe- tent recipient cells (double mutant A-B-) is transformed by exponential ( E ) DNA. T s ( A ) and T s ( B ) represent similar values for standard CS) DNA.
The experimental value R, is related to the mapping function g ( X ) in the following manner:
X a and X B represent chromosomal positions of markers A and B . Therefore,
when
x ,
= 1,Expected errors of R can be calculated as follows. The variance of the ratio of two uncorrelated variables
x
and y is given as (KENDALL 1952).Therefore, abbreviating T E ( A ) , T E ( B ) , T s ( A ) and T s(B) as AE, BE, As and B ,
respectively, and also AE/BE = rl and As/Bs = r2,
where U'AE and 0'88 are equal to AE and BE, respectively, in the Poisson distri-
bution. Similarly,
The solution for R (= r l / r 2 ) is
For the case where A , N A , = A
( 1 5 )
R 2 ( 2
+
r1+
r 2 )A
2 ( R ) N
Some examples are given in Table 2. From the calculations presented in the table, it is advisable to base the mapping of a marker on counting no less than 2,000 colonies for each of AE and A,.
Marker distribution i n isotopic transfer experiments: In the MESELSON-STAHL
CHROMOSOME OF Bacillus subtilis 753
TABLE 2
Expected error of gene mapping and the size of sample, based on equation 15
%umber of colonies for Number of colonies for r1=1.4, r2=1 (or X = 0 . 5 , R x 1 . 4 ) r1=2, r,=l (or X=O, R=Z)t
_ _ ~
( A ) ' a?R 2 U R s - X+S azR 2aE X- X+S
100 0.2$ 0.90 -0.53 0.85 0.088 0.60 0 1.33
500 0.04 0.40 -0.26 0.32 0.018 0.26 0.27 0.81
1000 0.02 0.28 -0.19 0.22 0.0088 0.19 0.33 0.72
2000 0.01 0.20 -0.14 0.15 0.0044. 0.13 0.39 0.65
woo
0.005 0.14 -0.10 0.10 0.0022 0.09 0.43 0.61* A is the number of transformants of marker .4 where A, c _ A , = A .
No. of transformants for marker A by exponential DNA (AE)
No. of transformants for marker B by exponential DNA ( B E )
No. of transformants for marker A by standard DNA ( A , )
No. of transformants for marker B by standard DNA (B,)
,
--- r -
1 1
r2 =
R = rl/r2
These figures are expressed in map units. (Total chromosome distance=i). S X - is the map position corresponding to (R-2aR) and X + to ( R
+
2aR)different markers should be similar in parental and hybrid peaks. This can be
demonstrated as follows. The amount of DNA (D) a t a T fraction of a generation time after transfer in an exponentially growing population is:
0 , = D027
where
D,
is the amount of DNA at 7th generation after transfer andD o
the amount of DNA at the time of transfer. The increment of DNA (AD) isAD
= D,-D, =D o
( 2 - 1 ) (16)Theref ore,
D, (D
in hybrid peak) = 2AD = 2D0(27-1)Dp
(D
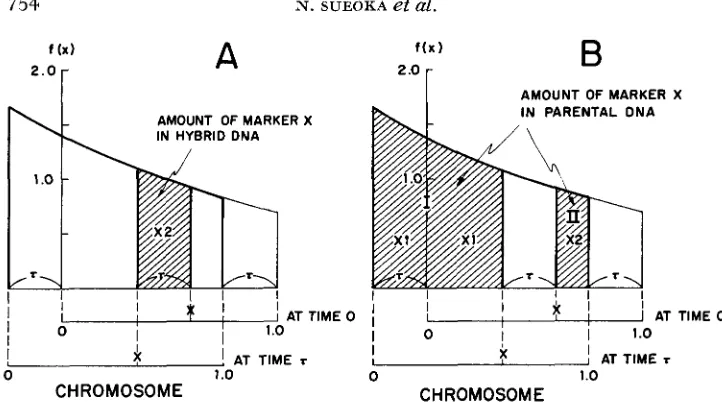
in parental peak) = 0, - 2aD = Do ( U T )The total amount of marker X in the hybrid region can be calculated as follows. Note that the chromosome position and the cell generation time are colinear and expressed in the same unit when there is no resting period (p = 0) (see Figure
6A), then
From the diagram of Figure 6B, the amount of marker X in the parental region is
754 N. SUEOKA et al.
f ( X I
2 ' o
c
A
f ( x IB
AMOUNT OF MARKER X IN PARENTAL DNA NT OF MARKER X
I
I ATTIMEO
I
I AT TIME 0I I
I I I
$
"1
II
I X
I I I I
I
I 1.0
I b I I 0
I I
I
I
AT TIME I I0 1 .o 0 1.0
CHROMOSOME CHROMOSOME
I
4
!
AT TIME rFIGURE 6.-Diagram showing the amount of marker X i n hybrid and parental DNA in
isotopic transfer experiments. A. In T generation after transfer, the chromosomes corresponding
to the shaded area have replicated marker X , thereby having two doses of the marker X per chromosome in hybrid DNA. B. In T generation after transfer, the marker X has not replicated
in the chromosomes corresponding to the shaded area ( I and 11), thereby having the marker in
parental DNA. The chromosomes in area I have not replicated the marker X , thus having one
dose of marker X per chromosome, while those in area I1 have already replicated the marker X prior to the transfer, thus having two doses of marker X per chromosome.
Therefore,
J
t
I1 = 21-x(2 - 27). Consequently, specific activity of marker X in the Iiy1.1: id peak ( h ) is22-x (2T - 1 )
20,(27-1)
Do
21-X(2 - 27) - 21-x
D o ( 2 - Q 7 ) Do
214
-
-- h =
I that of marker X is the parental peak ( p ) is
-
-
Therefore h = p . (18)
CHROMOSOME OF Bacillus subtilis 755
TABLE 3
This table facilitates calculation of the map position of marker X by using the formula
R ( X / I ) = Zl-X, and the extent of resting period p by R(O/I) = 2l-f
R
1
.oo
1.01 1.02 1.03 1.04 1.05 1.06 1.07 1.08 1.09 1.10 1.11 1.12 1.13 1.14 1.15 1.16 1.17 1.18 1.19 1.20 1.21 1.22 1.23 1.24 1.25 1.26 1.27 1.28 1 .29X or R X o r ~ R 1
.oo
1.300.987 1.31
0.970 1.32
0.957 1.33
0.943 1.34
0.930 1.35
0.91 7 1.36
0.904 1.37
0.890 1.38
0.877 1.39
0.864 1.40
0.850 1.41
0.837 1.42
0.824 1.43
0.81 1 1.M
0.797 1.45
0.787 1.46
0.774 1.47
0.761 1.48
0.747 1.49
0.737 1.50
0.724 1.51
0.714 1.52
0.701 1.53
0.691 1.54
0.678 1.55
0.668 1.56
0.654 1.57
0.644 1.58
0.63 1 1.59
0.621 1.60
0.61 1 1.61
0.598 1.62
0.588 1.63
0.578 1.64
0.568 1.65
0.555 1.66
0.545 1.67
0.535 1.68
0.525 1.69
0.515 1.70
0.505 1.71
0.495 1.72
0.485 1.73
0.475 1.74
0.465 1.75
0.455 1.76
0.445 1.77
0.435 1.78
0.425 1.79
0.415 1.80
0.405 1.81
0.395 1.82
0.385 1.83
0.375 1.84
0.369 1.85
0.359 1.86
0.349 1.87
0.339 1.88
0.332 1.89
X or D 0.322 0.312 0.302 0.296 0.286 0.279 0.269 0.259 0.252 0.243 0.236 0.226 0.216 0.209 0.199 0.192 0.183 0.176 0.169 0.159 0.153 0.143 0.136 0.130 0.120 0.113 0.103 0.096 0.090 0.083
R X o r ~ 1.90 0.076 1.91 0.066 1.92 0.060 1.93 0.050 1.94 0.043 1.95 0.037 1.96 0.030 1.97 0.023 1.98 0.013 1.99 0.007
2.00 0.000
D I S C U S S I O N
756 N. SUEOKA et al.
degree of fitness of the theory to experimental data are found in our previous and following communications.
I n the derivation of equation 1, the speed of replication at the replication point was assumed to be constant. Any deviation from the constancy of the rate of replication during a generation needs an appropriate adjustment for assigning the location of a marker on the chromosome, although the order of markers would not be affected. This point needs further experimentation.
In the derivation of equation 4, homogeneous generation time in a population was assumed, which may not be quite true. The age function of cells with a consideration of heterogeneity in generation time has been given (POWELL 1956). In the present analysis, however, the simplified relation (equation
4)
seems to be satisfactory.The equation of chromosome replication (equation 4 ) can also be used to pre- dict the amount of DNA increase after the nutritional "shift-down" where reini- tiation of chromosome replication is inhibited (MAALQE and HANAWALT 1961 ).
The percent increase of the DNA ( A ) over the amount at the time of the shift- down can be calculated as
2" - JO'g,(X)dX
x 100 (19)
From the values for S l g n ( X ) d X given in Table 1,39%, 84%, and 137% increase are the results of the calculation for n = 1,2, and 3, respectively. An increase of 40% DNA was reported by M A A L ~ E and HANAWALT (1961) in which an expo- nentially g r k n g culture of E . coli strains TAU was transferred from thymine- arginine-uracil supplemented medium to thymine supplemented medium. They interpreted the result exactly as in our calculation for n = 1. SCHAECHTER, BENT- ZON and MAALBE (1959), however, observed that from broth medium to minimal medium showed about 80% increase of DNA which has remained unexplained. This case can now be explained, if n was 2 in broth medium. Indeed, in B . subtilis n = 2 was encountered in enriched medium (YOSHIKAWA, O'SULLIVAN and SUEOKA 1964; OISHI, YOSHIKAWA and SUEOKA 1964).
A = J l g m d x
We are grateful t3 DR. M. MESELSON for his critical comments on marker distribution in isotopic experiments. We are also indebted to DR. CHARLES NEWMAN for his assistance in deriv- ing the age distribution function (equation 1).
SUMMARY
CHROMOSOME OF Bacillus subtilis 75 7
in turn to calculate the map position of the marker on the chromosome. The marker frequency function has been generalized for situations in which chro- mosome replication occupies only a part of the cell generation time and also for those in which the chromosome has more than one replication point. The statis- tical errors associated with the mapping of genetic markers by marker frequency analysis are formulated, and can be used for evaluating the data. In isotopic transfer experiments of the exponential phase cells, the distribution of markers in parental and hybrid DNA peaks should be proportional to the amount of DNA
in the two peaks, and be independent of the position of the marker on the chromosome. unless the fractional resting period is different before and after the transfer.
LITERATURE CITED
HOTCHKISS, R. D., and A. H. EVANS, 1958 Analysis of the complex sulfonamide resistance locus
Product-Moment Correlation. p. 367. The Aduanced T h o r y of Statistics, Volume 1. Charles Griffin and Co., London.
Genetic transformation. I. Cellular incorporation of DNA accompanying transformation in pneumococcus. Biochim. Biophys. Acta 26 : 68-82.
Thymine deficiency and the normal DNA replication cycle. I. J. Mol. Biol. 3: 144155.
The replication of DNA in Escherichia coli. Proc. Natl.
Synchronous and dichotomous replications of
Growth rate and generation time of bacteria, with special reference to
Synthesis of deoxyribonucleic acid during the division cycle of bacteria. Nature 183: 1207-1208.
Regulation of chromosome replication in Bacillus sub- tilis. Cold Spring Harbor Symp. Quant. Biol. 28: 47-54.
The organization and duplication of
chr:x”omes as revealed by autoradiographic studies using tritium labelled thymidine. Proc. Natl. Acad. Sci. U S . 43: 122-128.
WATSON, J. D., and F. H. C. CRICK, 1953 The structure of DNA. Cold Spring Harbor Symp.
YOSHIKAWA, H., and N. SUEOKA, 1962 Mechanism of chromosome replication in Bacillus sub- tilis. (Abstr.) Genetics 47: 996.
YOSHIKAWA, H., and N. SUEOKA, 1963a Sequential replication of Bacillus subtilis chromosome.
I. Comparison of marker frequencies in exponential and stationary growth phases. Proc. Natl. Acad. Sci. U.S. 49: 559-566 __ 1963b Sequential replication of the Bacillus subtilis chromosome. 11. Isotopic transfer experiments. Proc. Natl. Acad. Sci. US. 49 :
806-813.
Sequential replication of the Bacillus subtilis chromosome. 111. Regulation of initiation. Proc. Natl. Acad. Sci. US. 52: 973-980. of pneumococcus. Cold Spring Harbor Symp. Quant. Biol. 23: 85-97.
KENDALL, M. G., 1952
LERMAN, L. S.: and L. J. TOLMACH, 1957
MAALBE, O., and P. C. HANAWALT, 1961
MESELSON, M., and F. W. STAHL, 1958 Acad. Sci. U.S. 44: 671-682.
OISHI, M., H. YOSHIKAWA, and N. SUEOKA, 1964
the Bacillus subtilis chromosome during spore germination. Nature 204: 1069-1073. P O W ~ L , E. O., 1956
con:inuous culture. J. Gen. Microbiol. 15: 492-51 1. SCIIAECEITER, M., M. W. BENTZON, and 0. MAALBE, 1959
SUEOKA, N., and H. YOSHIKAWA, 1963
TAYLOR, J. H., P. S. WOODS, and W . L. HUGHES, 1957
Quant. Biol. 18: 123-131.