ABSTRACT
LIU, YU. The Performance of Controlled Drainage and inline Denitrifying Woodchip Bioreactor for Reducing Nutrient losses from Subsurface Drained Grassland Receiving Liquid Swine Lagoon Effluent. (Under the direction of Dr. Mohamed A. Youssef).
Over application of livestock manure has become a principal nutrient source in
groundwater and surface water. Controlled drainage (CD) and denitrifying bioreactors have
been used to reduce nutrient losses from artificially drained agricultural land to surface
waters. The overall goal of this research was to evaluate the performance of CD and
denitrifying woodchip bioreactors for reducing nutrient losses from a subsurface drained
grass field receiving liquid swine lagoon effluent (SLE). A four-year field experiment was
conducted on a 1.25 ha pasture in eastern North Carolina. Eight subsurface drains (1.0 m
depth and 12.5 m spacing), including four experimental drains and four guard drains, were
installed in the naturally poorly drained field. Four drains were managed in CD mode with
drain outlet set at 36 cm below surface while the remaining four drains were managed in free
drainage (FD) mode. Denitrifying bioreactors were installed at the edge of the four
experimental drains.
Compared to FD, CD reduced annual subsurface drainage volume by 88% to 98%
and raised the mean daily water table by 15 cm. The DRAINMOD model was used to
simulate the hydrology of the drained field under both FD and CD scenarios and predict the
main components of the water balance. Statistical performance measures indicated
acceptable to excellent agreement between predicted and measured water table depth and
daily drainage. Results showed clearly that seepage was a significant component of the water
Compared to FD, CD reduced annual load of total nitrogen (TN) in subsurface
drainage by 87% to 95%. The estimated population mean (EPM) of nitrate and TN
concentrations in drainage water for CD treatment (4.10 and 6.95 mg L-1, respectively) were
significantly lower than that from FD treatment (7.52 and 9.06 mg L-1, respectively). The
EPM of nitrate concentration in groundwater at three depths (75–225 cm) in CD plots were
significantly lower than that from FD plots. Annual load reduction of total phosphorus (TP)
through subsurface drain lines in CD treatment ranged from 76% to 95%. The EPM of TP
concentration in drainage water for CD plots was 0.18 mg L-1, which was significantly higher
than that for FD plots (0.1 mg L-1). The difference of P concentration between CD and FD
plots was mainly due to the significant difference of particulate P concentration. Reduced
drainage volume, enhanced denitrification, and to a far lesser extent increased grass uptake of
N and P during dry growing condition contributed to the observed reduction in N and P
loading via subsurface drainage under CD treatment.
All bioreactors significantly reduced nitrate concentrations. Yearly percent nitrate
reduction for CD-bioreactor (CDB) and FD-bioreactor (FDB) systems during study period
ranged from 48 ± 22% to 87 ± 6% and 21 ± 8% to 51± 8%, respectively. Nitrate removal
rates increased with water flow rate, initial nitrate concentration, hydraulic retention time
(HRT), and temperature; however, the temperature effect was not as strong as the other
factors. Longer than needed HRT would also negatively affect nitrate removal rate of
bioreactors. Percent nitrate load reduction was affected by the volume of flow that passes
through bioreactors rather than bypass pipes. The portion of the water flowing through
bioreactors (three out of four) decreased from 2012 to 2014 due to decreasing of estimated
showed sufficient removal of nitrogen loading from drained pasture lands. The practicality of
bioreactors was not only related to carbon consumption longevity, but also related to proper
maintenance of anaerobic condition, suitable hydraulic conductivity, and appropriate HRT,
© Copyright 2017 Yu Liu
The Performance of Controlled Drainage and inline Denitrifying Woodchip Bioreactor for Reducing Nutrient losses from Subsurface Drained Grassland Receiving Liquid Swine
Lagoon Effluent.
by Yu Liu
A dissertation submitted to the Graduate Faculty of North Carolina State University
in partial fulfillment of the requirements for the degree of
Doctor of Philosophy
Biological and Agricultural Engineering
Raleigh, North Carolina 2017
APPROVED BY:
_______________________________ _______________________________
Dr. Mohamed A. Youssef Dr. George M. Chescheir
Chair of Advisory Committee Committee Member
_______________________________ _______________________________
Dr. R. Wayne Skaggs Dr. Wei Shi
ii
DEDICATION To my husband, Wei Hu.
Without your love and support, none of this would have been possible!
iii
BIOGRAPHY
Yu Liu was born on November 1987, to Dunxin Liu and Zhiping Yu in Hunan
province, P. R. China. She lived and studied in Wuhan, Hubei province, P.R. China for the
majority of her formative years. She received bachelor’s degree in irrigation and drainage
engineering from Wuhan University in 2009. She continued studying at Wuhan University as
a graduate student during 2009-2011. She came to the US to pursue a Ph.D. degree in the
department of biological and agricultural engineering at North Carolina State University in
August 2011. She passed the Ph.D. prelim exam and became a Ph.D. candidate in Nov 2014.
Yu met her beloved husband when both of them were sophomores in the same university. Yu
iv
ACKNOWLEDGMENTS
All my knowledge of controlled drainage and DRAINMOD modeling started from
reading papers written by Dr. Skaggs, Dr. Chescheir, and Dr. Youssef. Those papers are
clear, condense, and meaningful. I’m grateful for being able to work with them.
Thanks to my advisor Dr. Youssef. Dr. Youssef had tried his best to help me not only
in the academic area but also surviving in a brand new country. Dr. Youssef was always
patient and never lost hope on me. He spent long hours even during the weekends reviewing
my dissertation and taught me his experience on research and scientific writing. He also
supported me to take part in international conferences, which helped me open the door of
research and realize the fun of working with people in my research area.
Thanks to Dr. Chescheir. Dr. Chescheir was always willing to spend time discussing
with me on solving research problems. The most important thing that I learned from Dr.
Chescheir is that; always check the assumptions before using particular equations. This was a
key point for understanding the working feature of the woodchip bioreactors. Dr. Chescheir
had a great contribution to each of the three chapters in this dissertation. He gave me
suggestions on data analysis, modification of dissertation structure and writing, and solve
problems together with me. He always had great ideas of doing research and teach me solid
ways to verify hypothesizes.
Thanks to Dr. Skaggs. He introduced Dr. Youssef and Dr. Chescheir to me in our first
communication through E-mail. His class of “Theory of Drainage” and “DRAINMOD modeling” built the foundation for my understanding of drainage and modeling. He has a
v He asked me an important question in my prelim exam: where does the water that was
reduced by controlled drainage goes, which is the starting of the modeling chapter in this
dissertation. He helped me did a lot of edits and feedbacks for the DRAINMOD modeling
chapter.
Thanks to Dr. Shi. She taught a class of “Soil Microbiology”, which provided me the
first impression of carbon, nitrogen, phosphorus cycle and interaction of soil microbes and
nutrients. She pointed out my errors in research and writings during committee meetings,
which gave me very nice suggestions on modifying my research.
Thanks to Dr. Appelboom, He is an inventor and problem solver. He showed me how
to transfer knowledge to productive forces. He played a core role in designing and installing
the drainage system and woodchip bioreactor in the experimental field. He taught me the
method of data collection and analysis. His paper introducing bioreactor research opened the
door to bioreactor research for me.
Thanks to Dr. Poole, he proposed the idea of install bioreactors in spray field, which
initiated this project. He taught me the way to analyzing field data, organizing data, and
helped me on field trips, fixing instrumentation, lab bioreactor setting and adjustment, field
survey and edit the research brochure, etc. He has a clear understanding of controlled
drainage and bioreactor research. He is especially good at solving all kinds of problems
related to research and fieldwork. He gave me an understanding of a combination of the
researcher and a producer.
Thanks to Dr. Tian and his wife, Man Jia. They are warm hearted. They helped me a
vi my research and dissertation editing. He also taught me the way to use his newly developed
model DRAINMOD-GRASS.
Thanks to Dr. Julian Cacho. Dr. Cacho gave me suggestions on doing research,
experiment, dissertation and journal paper writing. He is dedicated to education, always
patient on answering any questions raised by students. He is a role model for me as a young
educator.
Thanks to Ihab Ghali for helping me constructing the lab scale bioreactor, field trips,
data collection and analysis, and friendship. Without his help on understanding all those
design and data processing steps, I could not understand the whole research.
Thanks to Dr. Negm. She is always kind to me, willing to listen to me. She even spent
several hours helping me review the chapters when she was very busy. She has a magic that
could help me calm down and be productive again after talking to her.
Thanks to Brian Phillips. He is another teacher in the class of “Theory of Drainage” and “DRAINMOD”. He is the “invisible Heroes” for users of DRAINMOD 6.1. He led us
learning to write in an academic style and gave careful feedback to our homework. He is a
role model of a hard working researcher.
Thanks to all researchers who encouraged, helped, talked with me during my Ph.D.
period. They are Dr. Birgand, Dr. Huffman, Dr. Robertson, Dr. Boyette, Dr. Willits, Dr.
Classen, Dr. Whitaker, Dr. Suggs, Dr. Hesterberg, Dr. Evans, Dr. Cheshire, Dr. Moore, Dr.
Arellano, Dr. Osborne, and Ms. Giovanelli.
Thanks to NCSU staff who helped me during my research. They are Ms. Rachel
vii water research station), Ms. Sharry Li, Mr. Andrew Slate, Dr. Mohan Ramaswamy. Mr.
Brandon Millar, Mr. William Huntley, Ms. Heather Austin, Ms. Carolyn Mitkowski, Ms.
Betsy Maness, Ms. Lacy Parrish, and Ms. Rena Gobble.
Thanks to my colleagues Brandon Miller, Shiqi Fang, Wenlong Liu. They worked
hard and helped me a lot on field work, including data downloading and equipment
maintenance. Thanks to Shiqi, he spent several hours helping me installing software, run
models. He also gave me solid suggestions on time management and data analysis.
Thanks to Dr. Xiugui Wang. Dr. Wang is my supervisor in Wuhan University
(Wuhan U). Without his support, I could not come to study in NCSU nor have enough time
finish my dissertation.
Thanks to the faculties and staffs of Wuhan University who support my decision of
going aboard. They are Dr. Jinzhong Yang, Dr. Bo Wang, Dr. WeiMing Wang, Dr. Weizhen
Zhang, Ms. Xiuhong Chen, Ms. Chunlin Han and all supporting staffs from Wuhan
University.
Thanks to the companion and friendship of all my friends in NCSU and Wuhan U.
They are listed but not limited here: Quan Zhou, Shuzhang Liu, Yijia Zhao, Zhimin Liu,
Manal Askar, Robert Vick, Forrest Brookes, Cynthuja Partheeban, Yousef Abdalaal, Aaron
and Pat Pettit, Xin Liu, Yingxi Geng, Yo-Jin Shiau, Chiao-Wen Lin, Yuting Zheng, Nicole
Dobbs, Yane Ansanay, Rini Triani, Fatemeh Mohammadshirazi, Mandy Liesch, Ryan
Winston, Simon Gregg, Sarah Waickowski, Katy Conroy, Long Qian, Xudong Han, etc.
Thanks to NC state student services center for helping me in every aspect of my
viii writing tutoring to me, NC State student legal service, NC State student health services, NC
State office of international students.
Special thanks to my husband, Wei Hu (胡炜). He supported me with his life, love,
time, future development and economic. He is the one who always believes in my ability on
finish my work even when I was disappointed with myself. Without his support, I would
hardly finish my research or even survive in the US.
Thanks to my parents Dunxin Liu (刘敦新) and Zhiping Yu (余志平). They
waited and waited for the day of my graduation without any complaint. All I received from
them were an encouragement and all kinds of help on finishing my study.
Thanks to my mother-in-law, Ms. Yan Zhang (张艳) for always supporting my
ix
TABLE OF CONTENTS
LIST OF TABLES………..xi
LIST OF FIGURES………...xv
1 CHAPTER 1 PERFORMANCE OF CONTROLLED DRAINAGE FOR REMOVING NITROGEN AND PHOSPHORUS FROM SUBSURFACE DRAINED GRASSLAND RECEIVING LIQUID SWINE LAGOON EFFLUENT ... 1
1.1 Abstract ... 1
1.2 Introduction ... 4
1.2.1 Agricultural drainage ... 4
1.2.2 Hydrologic and water quality impacts of agricultural drainage... 5
1.2.3 Land application of liquid swine manure ... 7
1.2.4 Controlled drainage ... 9
1.2.4.1 Controlled drainage effect on water quality ... 11
1.2.4.2 Controlled drainage effect on crop yield ... 16
1.2.5 Research gap ... 16
1.2.6 Objectives ... 19
1.3 Materials and Methods ... 19
1.3.1 Experimental field site description ... 19
1.3.2 Controlled drainage settings ... 22
1.3.3 Data collection ... 22
1.3.3.1 Drainage flow measurement and drainage water quality sampling ... 22
1.3.3.2 Groundwater table monitoring and groundwater quality sampling ... 23
1.3.3.3 Chemical analysis of nitrogen and phosphorus concentrations ... 23
1.3.3.4 Meteorological data ... 24
1.3.3.5 Grass yield and nutrient content ... 25
1.3.3.6 Swine lagoon effluent and wet deposition of N and P ... 26
1.3.4 Water and mass balance ... 27
1.3.4.1 Water balance calculations ... 27
1.3.4.2 Nitrogen balance calculations ... 29
1.3.4.3 Phosphorus balance calculations ... 31
1.3.5 Statistical analysis ... 32
1.3.5.1 Repeated ANOVA test for drainage water nitrogen and phosphorus concentrations ... 32
1.3.5.2 Repeated ANOVA test for groundwater nitrogen and phosphorus concentrations ... 33
1.3.5.3 Analysis of groundwater table depth using ARIMA and GLIMMIX procedures ... 35
x
1.3.5.5 Repeated ANOVA test for grass N and P uptake ... 36
1.4 Results and discussion ... 36
1.4.1 Hydrology ... 36
1.4.1.1 Precipitation and irrigation ... 36
1.4.1.2 Drainage ... 37
1.4.1.3 Groundwater table depth ... 42
1.4.1.4 Water balance study ... 50
1.4.2 Nitrogen and phosphorus Dynamics ... 52
1.4.2.1 Nitrogen and phosphorus inputs ... 52
1.4.2.2 Nitrogen and phosphorus losses via subsurface drainage ... 55
1.4.2.3 Nitrogen and phosphorus concentration from groundwater sampling wells ... 75
1.4.2.4 Grass biomass yield and nutrient uptake ... 83
1.4.2.5 Nutrient balance for measured nitrogen (N) and phosphorus (P) component ... 88
1.5 Conclusion, future work, and limitations of current study ... 93
1.5.1 Summary and Conclusions ... 93
1.5.2 Limitations of current study ... 98
1.5.3 Future work ... 99
1.6 Reference ... 101
2 CHAPTER 2 MODELING THE HYDROLOGY OF AN ARTIFICIALLY DRAINED FIELD IRRIGATED WITH SWINE LAGOON EFFLUENT ... 107
2.1 Abstract ... 107
2.2 Introduction ... 109
2.3 Materials and methods ... 110
2.3.1 Site description... 110
2.3.2 Measured data ... 112
2.3.2.1 Meteorological data ... 112
2.3.2.2 Irrigation ... 113
2.3.2.3 Subsurface drainage flow and water table depth... 114
2.3.3 DRAINMOD model description ... 114
2.3.3.1 Water balance ... 115
2.3.3.2 Evapotranspiration ... 116
2.3.3.3 Infiltration ... 117
2.3.3.4 Surface runoff and subsurface drainage ... 117
2.3.3.5 Vertical and lateral seepage ... 119
2.3.4 Statistical performance measures and evaluation criteria ... 120
xi
2.3.5.1 Weather inputs ... 121
2.3.5.2 Drainage system inputs ... 122
2.3.5.3 Soil inputs ... 124
2.3.5.4 Seepage inputs ... 132
2.3.6 Model calibration ... 133
2.4 Results and discussion ... 135
2.4.1 Comparison of predicted and observed water table depth and subsurface drainage flow volume for free drainage treatment ... 135
2.4.2 Comparison of predicted and observed water table depth and subsurface drainage flow volume for controlled drainage treatment ... 143
2.4.3 Water balance components for conventional and controlled drainage treatments ... 152
2.5 Conclusions ... 155
2.6 REFERENCES ... 158
3 CHAPTER 3 PERFORMANCE OF IN-LINE DENITRIFYING WOODCHIP BIOREACTORS FOR NITROGEN REDUCTION FROM A SUBSURFACE DRAINED PASTURE RECEIVING SWINE LAGOON EFFLUENT IN EASTERN NORTH CAROLINA ... 161
3.1 Abstract ... 161
3.2 Introduction ... 163
3.3 Materials and Method ... 169
3.3.1 Site description... 169
3.3.2 Construction of woodchip bioreactors ... 170
3.3.3 Changes of hydraulic water head for bioreactors ... 174
3.3.4 Data calculation methods ... 174
3.3.4.1 Mean flow rate through bioreactors under steady state condition ... 176
3.3.4.2 Hourly hydraulic retention time (HRT) ... 177
3.3.4.3 Flow weighted mean hydraulic retention time (HRT) under Steady State Condition ... 178
3.3.4.4 Estimated hydraulic conductivity of woodchips under steady state condition ... 179
3.3.4.5 Flow weighted mean concentration (FWMC) during a specific period ... ... 180
3.3.4.6 Nitrate removal rate... 181
3.3.5 Statistical analysis ... 182
3.4 Results and discussion ... 182
3.4.1 Drainage water flow through bioreactors ... 182
xii
3.4.1.2 Daily drainage flow from field and through bioreactors ... 184
3.4.1.3 Hydraulic properties (flow rate, hydraulic retention time and saturated hydraulic conductivity) for bioreactors under steady state condition ... 191
3.4.2 Nitrate removal of woodchip bioreactor systems ... 199
3.4.2.1 Reduction of nitrate concentrations in response to flow rates from fields (Qin) and through bioreactors (Qout) ... 199
3.4.2.2 Daily mean drainage water temperature (T) ... 201
3.4.2.3 Reduction of nitrate load from subsurface drain lines through bioreactor systems ... 201
3.4.2.4 Annual nitrate removal rate ... 205
3.4.3 Nitrate removal rates during periods between sampling events and impact factors analysis ... 206
3.4.4 Concentration and mass loading of nitrogen and phosphorus species in drainage-bioreactor systems... 213
3.5 Limitation of experimental design, parameter measurement, and calculation ... ... 217
3.6 Future design of bioreactor ... 218
3.7 Conclusion ... 222
3.8 Reference ... 224
APPENDICES ... 229
Appendix A. Supporting materials for Chapter 1 ... 230
A.1 Hydrology ... 230
A.1.1 Differences of Groundwater Table Depth between CD and FD plots .... 230
A.1.2 Water balance calculations for free drainage and controlled drainage field plots ... 232
A.2 Nitrogen and Phosphorus dynamics ... 241
A.2.1 Nitrogen and Phosphorus concentration from irrigation water in June 2014 ... 241
A.2.2 Nitrogen and phosphorus concentration through subsurface drain lines 243 A.2.3 Analysis of nitrogen and phosphorus species concentration in groundwater samples ... 248
A.2.4 Grass uptake of Nitrogen and Phosphorus ... 260
A.2.5 Soil organic carbon (TOC) and nitrogen (N) content ... 261
Appendix B. Supporting materials for Chapter 2 ... 265
B.1 Free drainage ... 265
B.1.1 FD_2013.prj ... 266
xiii
B.1.3 Soil file ... 269
B.1.4 Output file ... 270
B.1.5 Output File: FD_2013.OUT ... 273
B.2 Controlled drainage ... 279
B.2.1 CD_2013. PRJ ... 280
B.2.2 CD_2013. GEN ... 280
B.2.3 Output file ... 282
B.2.4 CD_2013.OUT ... 285
B.3 Snowfall in Jan and Feb 2014 ... 291
B.4 Water balance components for FD without seepage and CD with seepage ... 292
Appendix C. Supporting materials for Chapter 3 ... 293
C.1 Hydraulic and hydrologic related materials ... 293
C.1.1 Hydraulic water head adjustments for the bioreactors ... 293
C.1.2 Drainage water flow rate calculation equation ... 294
C.1.3 Porosity of woodchips and sand ... 295
C.1.4 Darcy’s flow and Reynolds number ... 295
C.1.5 Drainage water flow from field and the portion that went through bioreactors ... 297
C.2 Temporal changes of nitrate concentration and loading through bioreactors 299 C.2.1 Measured nitrate concentration in drainage-bioreactor systems ... 299
C.2.2 Calculated daily nitrate removal rate and controlling sitefactors under steady state condition ... 299
C.2.3 Nitrate loading reduction and controlling factors ... 301
C.3 Loading and concentration of other nitrogen and phosphorus species ... 304
C.3.1 Change of loading of other nitrogen and phosphorus species through bioreactors ... 304
xiv
LIST OF TABLES
Table 1.1 Depths and textures of soil layers. ... 21 Table 1.2 Monthly precipitation during the four-year experiment and 30-year normal
precipitation. ... 37 Table 1.3 Wastewater irrigation dates and amounts for the four-year (2011-2014) experiment
... 37 Table 1.4 Yearly precipitation, irrigation, and subsurface drainage for the free drainage (FD)
and controlled drainage (CD) plots during the four-year (2011-2014) experimental study. ... 38 Table 1.5 Monthly subsurface drainage outflow (average ± standard error) from free drainage
(FD) and controlled drainage (CD) plots during the four-year (2011-2014)
experimental study. ... 40 Table 1.6 Monthly average groundwater table depth for CD and FD plots (2011 to 2014). .. 43 Table 1.7 Estimated yearly ETc turf and NWBC for CD and FD. ... 51 Table 1.8 Yearly mean nitrogen concentration and yearly mass input to Pasture site from
swine lagoon effluent. ... 53 Table 1.9 Mean nitrogen concentration of wet deposition in 2014 (data based on 18 grab
samples collected during 2014) and mass input via wet deposition during 2011- 2014. ... 53 Table 1.10 Yearly mean phosphorus concentration and yearly mass input to Pasture site from swine lagoon effluent. ... 54 Table 1.11 Mean phosphorus concentration of wet deposition in 2014 (data based on 18 grab samples collected during 2014) and mass input via wet deposition during 2011-2014. ... 55 Table 1.12. Summary of measured drainage water flow-weighted mean concentration (mg N
L-1) of different nitrogen species for both controlled drainage (CD) and free drainage (FD) treatments. ... 57 Table 1.13 Summary of measured drainage water flow-weighted mean concentration (mg P
L-1) of different phosphorus species for both controlled drainage (CD) and free drainage (FD) treatments. ... 57 Table 1.14 Observed FWMCs of different N species for controlled drainage (CD) and free
drainage (FD): estimated population means and values at lower and upper 95% confidence limit. ... 57 Table 1.15 Observed FWMCs of different P species for controlled drainage (CD) and free
xv Table 1.16 Yearly Nitrogen mass losses via subsurface drainage from controlled drainage
(CD) and free drainage (FD) treatments during the 2011-2014 experimental period†.
... 65
Table 1.17 Yearly Phosphorus mass losses via subsurface drainage from controlled drainage (CD) and free drainage (FD) treatments during the 2011-2014 experimental period†. ... 67
Table 1.18 Estimated N interval loading by treatments, with 95% confidence limits. ... 68
Table 1.19 Estimated P interval loading by treatments, with 95% confidence limits. ... 68
Table 1.20 Statistical Summary of observed groundwater N concentration. ... 76
Table 1.21 Test of fixed factors for groundwater N concentrations for different N species. . 78
Table 1.22 Estimated population mean (EPM), standard error (SE), and lower and upper 95% confidence limits (L,U) of groundwater nitrogen species concentrations. ... 81
Table 1.23 Estimated population mean (EPM), standard error (SE), and lower and upper 95% confidence limits (L,U) of groundwater phosphorus species concentrations. ... 83
Table 1.24 Grass Oven-dried yield from June 27, 2012, to September 18, 2014, for each replicates from CD and FD plots. ... 84
Table 1.25 Test of Fixed effects of oven-dried grass biomass yield during June 2012-September 2014. ... 85
Table 1.26 Mean carbon (C), nitrogen (N), phosphorus (P) contents of grass samples from FD and CD plots. ... 86
Table 1.27 Yearly grass uptake of carbon (C), nitrogen (N), phosphorus (P) from FD and CD plots from June 2012† to September 2014. ... 88
Table 2.1 Calibration criteria for statistical measures of agreement between predicted and measured water table depth and drainage volume (adopted from Skaggs et al., 2012). ... 121
Table 2.2 DRAINMOD inputs characterizing the drainage design parameters for the simulated pasture site. ... 122
Table 2.3 Weir settings for free drainage plots. ... 123
Table 2.4 Weir settings for controlled drainage plots. ... 123
Table 2.5 Soil water characteristic relationship. ... 124
Table 2.6 Water table depth (WTD) vs. volume drained (Vd) and upward Flux relationships. ... 125
Table 2.7 Green-Ampt infiltration parameters... 126
Table 2.8 Bottom depth of soil layers and saturated hydraulic conductivity values estimated from q vs. m relationship and input parameters in DRAINMOD modeling. ... 130
Table 2.9 The effective rooting depth function used in DRAINMOD simulations of the drained pasture field. ... 132
xvi Table 2.11 Water table depth (WTD) and daily drainage flow for conventional (Free)
drainage treatment (FD), seepage not considered. ... 141 Table 2.12 Water table depth (WTD) and daily drainage flow for conventional (Free)
drainage treatment (FD), with seepage. ... 142 Table 2.13 Water table depth (WTD) and daily drainage flow for controlled drainage
treatment (CD), seepage not considered. ... 150 Table 2.14 Water table depth (WTD) and daily drainage flow for controlled drainage
treatment (CD), with seepage. ... 151 Table 2.15 Predicted and observed water balance components for conventional drainage (FD)
plots, seepage not considered. ... 153 Table 2.16 Predicted and observed water balance components for conventional drainage (FD)
plots, with seepage. ... 153 Table 2.17 Predicted and observed water balance components for controlled drainage (CD)
plots, seepage not considered. ... 154 Table 2.18 Predicted and observed water balance components for controlled drainage (CD)
plots, with seepage. ... 154 Table 3.1 Yearly drainage water flow from field (FD and CD), through bioreactors (FDB and CDB), and through bypass pipe (FDB bypass and CDB bypass). ... 183 Table 3.2 Statistical summary of average daily drainage flow from drainage-bioreactor
systems (daily drainage flow volume that was zero were excluded from the statistical summary). ... 186 Table 3.3 Annual mean drainage flow rate that went through bioreactor (Qout mean), hydraulic
retention time (HRT), and saturated hydraulic conductivity of bioreactor media (Ks) under steady state condition, and accumulated time when flow through bioreactor was larger than zero. ... 192 Table 3.4 Statistical summary of observed flow weighted mean nitrate concentration at
bioreactor inlet and outlet during each period between sampling events for FDB and CDB bioreactors... 199 Table 3.5 Annual nitrate loading and percent nitrate load reduction for FDB bioreactors. . 203 Table 3.6 Annual nitrate loading and percent nitrate load reduction for CDB bioreactors. . 203 Table 3.7 Yearly flow-weighted mean nitrate concentration and nitrate removal rate for each
bioreactor. ... 206 Table 3.8 Statistical summary of HRTmean, inlet nitrate concentration (Cin), mean drainage
flow through bioreactors (Qout, mean), drainage water temperature (T), nitrate removal rate (rnitrate) from each bioreactor and all bioreactors as a whole data set. ... 209 Table 3.9 Nitrate removal rate (rnitrate) multiple regression model parameter estimates
xvii Table 3.10 p-values for Repeated ANOVA test on concentrations of nitrogen and phosphorus
species at FDB and CDB bioreactors inlet and outlet manifolds... 214
Table 3.11 T-test for difference between inlet and outlet N, P concentration. ... 214
Table 3.12 p-values for Repeated ANOVA test on N and P loadings from the field and out of CDB and FDB system. ... 215
Table 3.13 Nitrate, AN, ON accountability in N load and percent N load reduction. ... 216
Table 3.14 Orthophosphate accountability in P load and percent P load reduction. ... 217
Table A.1 Assumption of different grass growing stages. ... 236
Table A.2 Average grass height and typical Kc at different times of the year. ... 237
Table A.3 Estimated non-measured water balance components (NWBC) for CD and FD plots, as well as potential evapotranspiration (ET) under standard condition for hay (ETc hay) and cool season turf grass (ETc turf). ... 238
Table A.4 Differences between non-measured water balance components (NWBC) and potential evapotranspiration (ET) under standard condition for different kind of grass and drainage management treatments. ... 238
Table A.5 Test of fixed factors, p-values from ANOVA test for nitrogen species concentration between controlled drainage (CD) and free drainage (FD) treatments. ... 246
Table A.6 Test of fixed factors, p-values from ANOVA test for phosphorus species concentration between controlled drainage (CD) and free drainage (FD) treatments. ... 246
Table A.7 Statistical summary of observed phosphorus species concentration in groundwater samples………...255
Table A.8 Test of fixed factors for phosphorus species concentration in groundwater samples………...255
Table A.9 Multiple comparisons of grass oven-dried yield between CD and FD plots from June 27, 2012, to September 18, 2014………...261
Table C.1 Estimated Reynolds number (Re) based on hourly flow...296
Table C.2 Summary of yearly drainage (CD1 and FD1) from field drain lines, flow into the bioreactor (CDB1 and FDB1) at controlled drainage (CD) and free drainage (FD) fields, and portions flowing through the bioreactor...297
Table C.3 Statistical summary of hourly drainage water flow rate from Drainage-bioreactor systems...297
Table C.4 Statistical summary of average daily drainage flow in drainage-bioreactor systems (daily drainage flow volume that was zero were excluded from the statistical description table)...298
xviii Table C.6 Daily mean flow through bioreactors (Qout mean), theoretical hydraulic retention
time (HRT), estimated saturated hydraulic conductivity (Ks), nitrate concentration from inlet (Cin) and outlet (Cout) pipe of bioreactors, drainage water temperature (T), and nitrate removal rate (rnitrate) under steady state condition for CDB1...299 Table C.7 Daily mean flow through bioreactors (Qout mean), hydraulic retention time (HRT),
estimated saturated hydraulic conductivity (Ks), nitrate concentration from inlet (Cin) and outlet (Cout) pipe of bioreactors, drainage water temperature (T), nitrate removal rate (rnitrate) under steady state condition for CDB2...300 Table C.8 Daily mean flow through bioreactors (Qout mean), hydraulic retention time (HRT), estimated saturated hydraulic conductivity (Ks), nitrate concentration from inlet (Cin) and outlet (Cout) pipe of bioreactors, drainage water temperature (T), nitrate removal rate (rnitrate) under steady state condition for FDB1...300 Table C.9 Daily mean flow through bioreactors (Qout mean), hydraulic retention time (HRT),
estimated saturated hydraulic conductivity (Ks), nitrate concentration from inlet (Cin) and outlet (Cout) pipe of bioreactors, drainage water temperature (T), nitrate removal rate (rnitrate) under steady state condition for FDB2...301 Table C.10 Summary of calculated percentage of nitrate load reduction, reaction percentage
of nitrate load reduction, and accumulated flow ratios...301 Table C.11 Total percent nitrate load reduction (R%total) multiple regression model parameter
estimates (standard errors in parentheses) for independent factors of bioreactor percent nitrate load reduction (R%bioreactor), accumulated flow ratio (Acc. Flow ratio), flow rate (Qout.mean), hydraulic retention time (HRT), influent nitrate
concentration(Cin) for four denitrifying woodchip bioreactors in coastal area, North Carolina...302 Table C.12 Statistical description of the concentration of AN, nitrate, ON, and TN from inlet
xix
LIST OF FIGURES
Figure 1.1 Hydrology and nitrogen transformations in an artificially drained field. ... 7 Figure 1.2 Hydrology and phosphorus transformations in an artificially drained field... 7 Figure 1.3 A typical swine production operation is showing hog houses, a lagoon receiving
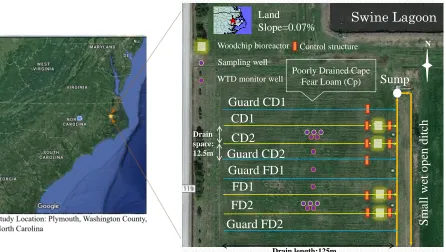
animal waste, and spray field receiving the lagoon effluent. ... 9 Figure 1.4 Geographic location and general layout of the experimental field site at the
Tidewater Research Station in the North Carolina lower coastal plain. ... 21 Figure 1.5 A map showing the relative locations of the experimental site and nearby weather
stations. ... 25 Figure 1.6 Water balance in field, from Skaggs et al., 2012b... 29 Figure 1.7 Monthly precipitation, irrigation, average drainage volume (cm) during
2011-2014... 41 Figure 1.8 Daily Observed vs. downloaded precipitation, air temperature and drainage. ... 41 Figure 1.9 Box Plot for hourly CD and FD Groundwater Table Depth (WTD). ... 43 Figure 1.10 Observed hourly precipitation, irrigation, and groundwater table depth from CD
and FD plots (2011). ... 46 Figure 1.11 Observed daily precipitation, irrigation, and drainage volume from CD and FD
plots (2011). ... 46 Figure 1.12 Observed hourly precipitation, irrigation, and groundwater table depth from CD
and FD plots (2012). ... 47 Figure 1.13 Observed daily precipitation, irrigation, and drainage volume from CD and FD
plots (2012). ... 47 Figure 1.14 Observed hourly precipitation, irrigation, and groundwater table depth from CD
and FD plots (2013). ... 48 Figure 1.15 Observed daily precipitation, irrigation, and drainage volume from CD and FD
plots (2013). ... 48 Figure 1.16 Observed hourly precipitation, irrigation, and groundwater table depth from CD
and FD plots (2014). ... 49 Figure 1.17 Observed daily precipitation, irrigation, and drainage volume from CD and FD
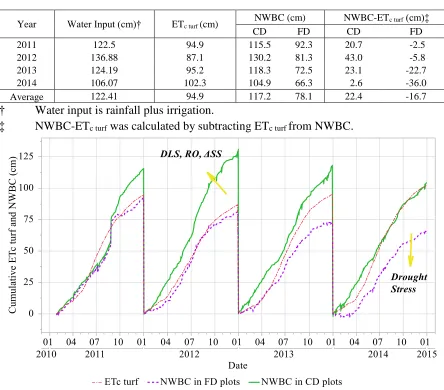
plots (2014). ... 49 Figure 1.18 Estimated accumulated daily non-measured water balance components (NWBC) for CD, FD plots, and ETc turf under standard condition. Standard field condition is no water logging or deficit stress, salinity stress, crop density, pest, diseases, weed infestation, low fertility, the presence of hard or impenetrable soil horizons in the root zone, etc. ... 51 Figure 1.19 Concentration of nitrate, AN, ON, and TN from rainfall samples in the year of
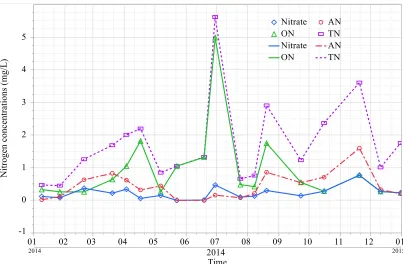
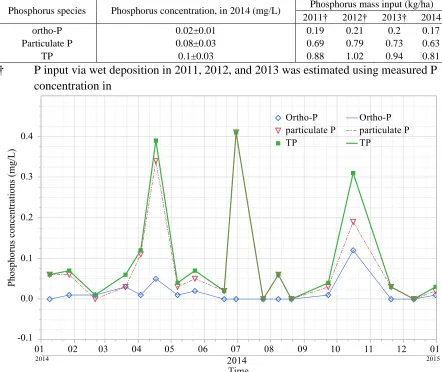
xx Figure 1.20 Concentration of ortho-P, particulate P, and TP from rainfall samples in the year
of 2014. ... 55 Figure 1.21 Observed flow-weighted mean concentration of N species during the four-year
study period. Median FWMC in each year of each treatment were shown in
annotation box for better comparison between treatments. ... 61 Figure 1.22 Observed flow-weighted mean concentration of P species during the four-year
study period. Median FWMC in each year of each treatment were shown in
annotation box for better comparison between treatments. ... 62 Figure 1.23 Accumulated loading for different nitrogen species via subsurface drain lines in
CD and FD plots. ... 65 Figure 1.24 Accumulated loading for different nitrogen species via subsurface drain lines in
CD and FD plots from May 23, 2012, to Dec 31, 2014. ... 67 Figure 1.25 Daily nitrate-N and TN losses via drainage water for FD plots from 2011 to
2014. This figure includes: (a) Daily precipitation, irrigation depth, N species input from irrigation water for FD plots;(b) Daily water table depth (WTD), flow weighted mean concentration of nitrate-N and TN concentration for FD plots; (c) Cumulative drainage flow volume, nitrate N and TN losses through subsurface drain lines in FD plots. Concentration and loading were calculated from mean values from two
replicates in FD plots. ... 69 Figure 1.26 Daily AN and ON losses via drainage water for FD plots from 2011 to 2014.
This figure includes: (a) Daily precipitation, irrigation depth, N species input from irrigation water for FD plots;(b) Daily water table depth (WTD), flow weighted mean concentration of AN and ON concentration for FD plots; (c) Cumulative drainage flow volume, AN and ON losses through subsurface drain lines in FD plots.
Concentration and loading were calculated from mean values from two replicates in FD plots. ... 70 Figure 1.27 Daily nitrate-N and TN losses via drainage water for CD plots from 2011 to
2014. This figure includes: (a) Daily precipitation, irrigation depth, N species input from irrigation water for CD plots;(b) Daily water table depth (WTD), flow weighted mean concentration of nitrate-N and TN concentration for CD plots; (c) Cumulative drainage flow volume, nitrate N and TN losses through subsurface drain lines in CD plots. Concentration and loading were calculated from mean values from two
replicates in CD plots. ... 71 Figure 1.28 Daily AN and ON losses via drainage water for CD plots from 2011 to 2014.
xxi Concentration and loading were calculated from mean values from two replicates in CD plots. ... 72 Figure 1.29 Daily ortho-P, particulate P, and TP losses via drainage water for FD plots from
2011 to 2014. This figure includes: (a) Daily precipitation, irrigation depth, P species input from irrigation water for FD plots;(b) Daily water table depth (WTD), flow weighted mean concentration of P species for FD plots; (c) Cumulative drainage flow volume, ortho-P, particulate P and TP losses through subsurface drain lines in FD plots. Concentration and loading were calculated from mean values from two
replicates in FD plots. ... 73 Figure 1.30 Daily ortho-P, particulate P, and TP losses via drainage water for CD plots from
2011 to 2014. This figure includes: (a) Daily precipitation, irrigation depth, P species input from irrigation water for CD plots;(b) Daily water table depth (WTD), flow weighted mean concentration of P species for CD plots; (c) Cumulative drainage flow volume, ortho-P, particulate P and TP losses through subsurface drain lines in CD plots. Concentration and loading were calculated from mean values from two
replicates in CD plots. ... 74 Figure 1.31 Groundwater Nitrate concentration in three different depths. ... 77 Figure 1.32 Mean Carbon, Nitrogen, Phosphorus uptake (with standard error bars) by grass at
nine different harvest time. ... 88 Figure 1.33 TN Input, Grass Uptake, Loss from Drain Lines, ΔN and DiffN. 2012.5~12
represents the period from May 12, 2012, to Dec 31, 2012... 91 Figure 1.34 TP Input, Grass Uptake, Loss from Drain lines, ΔP, and Diff P. ... 92 Figure 2.1 Geographic location and general layout of the experimental field site at the
Tidewater Research Station in the North Carolina lower coastal plain. ... 112 Figure 2.2 Map showing the locations of the pasture site, the TRS site, and three nearby
weather stations. ... 113 Figure 2.3 Water balance components of the artificially drained soil system simulated by
DRAINMOD (adapted from Skaggs et al., 2012). ... 116 Figure 2.4 Relationship between water table elevation and drainage equations (adapted from
Skaggs et al., 2012). ... 118 Figure 2.5 A schematic diagram showing different variables used to quantify vertical and
lateral seepage fluxes by DRAINMOD (Adapted from Skaggs et al., 2012). ... 120 Figure 2.6 Graphical representation of the water table depth vs. volume drained relationships
used by Burchell (2003) (Burchell_initial_Vd, Burchell_Vd), Poole (2006)
(Poole_Vd), and the calibrated relationship used in this study (Vd). ... 125 Figure 2.7 Graphical representation of the water table depth vs. upward flux relationships
xxii Figure 2.8 A schematic diagram showing the subsurface drainage system along with layered
soil profiled (depth and Ksat values of the different soil layer were obtained using the q-m relationship). ... 128 Figure 2.9 Measured and estimated q-m relationships for FD plots. ... 131 Figure 2.10 Comparison of observed and predicted water table depth (WTD), daily drainage,
and cumulative drainage for conventional drainage (FD) plots in 2011. Model predictions are given for both scenarios, with and without consideration of lateral seepage. ... 137 Figure 2.11 Comparison of observed and predicted water table depth (WTD), daily drainage,
and cumulative drainage for conventional drainage (FD) plots in 2012. Model predictions are given for both scenarios, with and without consideration of lateral seepage. ... 138 Figure 2.12 Comparison of observed and predicted water table depth (WTD), daily drainage,
and cumulative drainage for conventional drainage (FD) plots in 2013. Model predictions are given for both scenarios, with and without consideration of lateral seepage. ... 139 Figure 2.13 Comparison of observed and predicted water table depth (WTD), daily drainage,
and cumulative drainage for conventional drainage (FD) plots in 2014. Model predictions are given for both scenarios, with and without consideration of lateral seepage. ... 140 Figure 2.14 Observed and predicted cumulative drainage volumes, with and without lateral
seepage, for conventional drainage (FD) during the entire 4-year period of
observation. ... 141 Figure 2.15 Comparison of observed and predicted water table depth (WTD), daily drainage,
and cumulative drainage for controlled drainage (CD) plots in 2011. Model predictions are given for both scenarios, with and without consideration of lateral seepage. ... 146 Figure 2.16 Comparison of observed and predicted water table depth (WTD), daily drainage,
and cumulative drainage for controlled drainage (CD) plots in 2012. Model predictions are given for both scenarios, with and without consideration of lateral seepage. ... 147 Figure 2.17 Comparison of observed and predicted water table depth (WTD), daily drainage,
and cumulative drainage for controlled drainage (CD) plots in 2013. Model predictions are given for both scenarios, with and without consideration of lateral seepage. ... 148 Figure 2.18 Comparison of observed and predicted water table depth (WTD), daily drainage,
xxiii Figure 2.19 Observed and predicted cumulative drainage volumes, with and without lateral
seepage, for controlled drainage (CD) during the entire 4-year period of observation. ... 150 Figure 3.1 Nitrogen cycling in the soil profile (Abbreviation definitions: “a” is aqueous
phase, “g” is gaseous phase, “s” is solid phase, Nar is nitrate reductase, Nir is nitrite reductase, Nor is nitric, averill, and Tiedje oxide reductase, Nosis nitrous oxide reductase). ... 164 Figure 3.2 Geographic location and general layout of the experimental field site at the
Tidewater Research Station in the North Carolina lower coastal plain. ... 170 Figure 3.3 Photographs showing the steps of the bioreactor construction. ... 172 Figure 3.4 A photograph showing the bioreactor after completing construction and before
covering with soil. ... 173 Figure 3.5 A schematic diagram showing the bioreactor and the upstream and downstream
drainage control structures. The blue color arrows indicate the direction of water flow. The flow that goes through FD-Bioreactor system is shown here. “FD” is the subsurface drainage flow from the field, “FDB bioreactor” is the flow that goes through bioreactor from the inlet to outlet manifold, “FDB bypass” is the flow that goes through bypass pipe, “FDB system (FDB)” is the flow that goes out of the drainage-bioreactor system. The Difference between CDB system and FDB system was the weir level of the inlet structure. ... 173 Figure 3.6 Designed hydraulic water head (∆H) between bottom of bypass pipe and bottom
of outlet weir V-notch for bioreactor systems. ... 173 Figure 3.7 Water input, mean daily drainage water flow from the field and through
bioreactors in 2011. Pump failure events which caused no drainage water being drained from the experimental field after heavy rain occurred twice in 2011. The first incident occurred during March 24-April 3, 2011. The second incident occurred during August 27-September 14, 2011. ... 187 Figure 3.8 Water input, mean daily drainage water flow from the field and through
bioreactors f in 2012. There were three pump failure events that caused no drainage water being drained from the experimental field after heavy rain in 2012. The first incident occurred onMay 30, 2012. The Second incident occurred on July 12, 2012. The third incident occurred during August 26 -August 30, 2012. ... 188 Figure 3.9 Daily drainage water flow from the field and through bioreactors in 2013. The
light purple ribbons (1st and 2nd) represent a period when the inlet weir of CDB systems (drainage outlet of CD plots) was lowered to release soil water before
application of irrigation water in the field. ... 189 Figure 3.10 Water input, mean daily drainage water flow from the field and through
xxiv Figure 3.11 (a) Size of woodchips filled bioreactors at the onset of the experiment; (b) top of
field bioreactors covered by plastic liner; (c) mulch under dry condition and (d) mulch at the top layer of lab-scale bioreactor under moist but not saturated condition for 44 months from January 2012 to September, 2015. ... 196 Figure 3.12 Daily mean Ks under steady state condition for each bioreactor during
experimental period. ... 197 Figure 3.13. Mean flow rate and flow-weighted mean nitrate-N concentration at the inlet and outlet of FDB bioreactor (n=70). ... 200 Figure 3.14. Mean flow rate and flow-weighted mean nitrate-N concentration at the inlet and outlet of CDB bioreactor (n=70). ... 200 Figure 3.15 Daily average drainage water temperature from FDB and CDB systems.
Measurement of drainage water temperature started on September 6, 2013. Before this date, groundwater temperature from the field was shown here as a substitute for the drainage water temperature. ... 201 Figure 3.16 Accumulated nitrate loading for FDB bioreactors. ... 204 Figure 3.17 Accumulated nitrate loading for CDB bioreactors. ... 204 Figure 3.18 Nitrate removal rate vs. Qout, mean for each bioreactor. ... 210 Figure 3.19 Nitrate removal rate vs. inlet nitrate concentration (Cin) for each bioreactor. ... 210 Figure 3.20 Nitrate removal rate vs. HRTmean for each bioreactor. ... 211 Figure 3.21 Nitrate removal rate vs. mean drainage water temperature (T) for each bioreactor. ... 211 Figure 3.22 Nitrate removal rate vs. HRTmean, inlet nitrate concentration, Qout, mean,
temperature for all bioreactors together. ... 212 Figure 3.23 proposed design for upflow bioreactor. ... 221 Figure A.1 Trend and correlation analysis for average daily groundwater table depth (WTD)
in CD plots………230 Figure A.2 Trend and correlation analysis for average daily groundwater table depth (WTD)
in FD plots……….231 Figure A.3 Histogram and box plots of hourly mean groundwater table depth (WTD) midway
between experimental drain lines for controlled drainage (CD) and free drainage (FD) plots………232 Figure A.4 The linear relationship between wind speed measurements at PLYM-TRS and
TRS SCAN stations………...234 Figure A.5 Relationship between mean grass oven-dried yield and NWBC from nine cutting
periods for both controlled drainage (CD) and free drainage (FD)………...239 Figure A.6 Mean oven-dried grass yield with standard error bars, CD & FD NWBC, ETc
turf, and absolute differences between NWBC and ETc turf………240 Figure A.7 The relationship between the concentration of AN and TKN from liquid swine
xxv Figure A.8 The relationship between the concentration of TP and TP from irrigation water
samples………...243 Figure A.9 Statistical diagnostics figures for observed flow weighted mean nitrate nitrogen
concentration from drainage water samples. These figures included “residuals by predicted values plot”, “histogram of residuals”, and “normal quantile plot of the residuals”………247 Figure A.10 Statistical diagnostics figures for observed flow weighted mean nitrate nitrogen
concentration (after logarithmic transformation) from drainage water samples…...247 Figure A.11 Nitrate nitrogen concentration from shallow groundwater samples, plot in log
axis………248 Figure A.12 Ammonia/ammonium nitrogen (AN) concentration from shallow groundwater
samples, plot in log axis……….249 Figure A.13 Organic nitrogen (ON) concentration from shallow groundwater samples, plot in log axis………...250 Figure A.14 Total nitrogen (TN) concentration from shallow groundwater samples, plot in
log axis………...251 Figure A.15 Ortho-phosphate (Ortho-P) concentration from shallow groundwater samples,
plot in log axis………252 Figure A.16 Particulate phosphate concentration from shallow groundwater samples, plot in
log axis………...253 Figure A.17 Total phosphorus (TP) concentration from shallow groundwater samples, plot in
log axis………...254 Figure A.18 Mean total organic carbon and nitrogen contents in five soil layers from CD and
FD plots (with labeled mean values and standard errors)………..263 Figure B.1 Observed vs. Predicted FD WTD without or with Lateral Seepage. NoS:
withoutseepage; LS: with lateral seepage………..265 Figure B.2 Observed vs. Predicted FD Flow without or with Lateral Seepage. NoS: No
seepage; LS: with lateral seepage………..266 Figure B.3 Predicted vs. Observed CD WTD with Lateral Seepage……….279 Figure B.4 Predicted vs. Observed Daily CD Flow with Lateral Seepage Setting…………279 Figure B.5 Daily observed vs. downloaded precipitation, air temperature and observed
drainage from FD plots………..…291 Figure B.6 Water balance for CD and FD plots, sink terms were predicted by
DRAINMOD………..292 Figure C.1 Hydraulic water head adjustments for bioreactors………...293 Figure C.2 Scenarios of water flow through the weir. h is the height difference from the top
of the weir to the bottom of the V-notch of the weir; H1 is the height difference between upstream water level and the bottom of the V-notch; H0 is the height
1
1 CHAPTER 1 Performance of controlled drainage for removing nitrogen and phosphorus from subsurface drained grassland receiving liquid swine lagoon effluent
1.1 Abstract
Over application of livestock manure has become a significant nutrient source in
surface and ground water. Controlled drainage (CD) has been proposed to reduce nitrogen
(N) and phosphorus (P) load from agricultural wastewater application fields. The main
purposes of this study were to evaluate the performance of CD for reducing N and P losses
from a subsurface drained pasture receiving swine lagoon effluent (SLE) and identify
controlling mechanisms affecting the performance of CD. Field experiments were carried out
on a 1.25 ha pasture (tall fescue and ryegrass) located in the lower coastal plain of North
Carolina. Eight subsurface drains (1.0 m depth and 12.5 m spacing) were installed in the
naturally poorly drained field in 2010. Four of them were set as CD plots with drainage outlet
set at 36 cm below the ground surface while the remaining four were managed in free
drainage (FD). The restrictive layer was 3 m deep.
Annual subsurface discharge from FD plots ranged from 20% to 42.5% of the water
input (precipitation and application of SLE) from 2011 to 2014. Annual reduction of
subsurface drainage volume by CD compared to FD ranged from 88% to 98%. Mean hourly
groundwater table depth differences between CD and FD plots was 15 cm. A water balance
study suggested the possibility of the existing of deep and/or lateral seepage and surface
runoff in the experimental field, especially for the CD treatment. The estimated population
2 treatments were 4.10 and 6.95 mg L-1, respectively. Both of which were significantly lower
than that from drainage outlet of FD treatment (7.52 and 9.06 mg L-1 for EPM of nitrate and
TN concentration). The EPM of ammonium nitrogen (AN) and organic nitrogen (ON)
concentration from drainage outlet of CD treatment were significantly higher than that from
FD plots. The EPM of TP concentration from drainage outlet of CD plots was 0.18 mg L-1,
which was significantly higher than that for FD plots (0.1 mg L-1). The difference of P
concentration between CD and FD plots was mainly due to the significant difference of
particulate P concentration. Annual TN load reduction through subsurface drain lines in CD
plots compared to FD plots ranged from 87% to 95% during 2011-2014. Annual TP load
reduction through subsurface drain lines in CD treatment ranged from 76% to 95% during
2013-2014.
The EPM of nitrate concentration from CD plots in three depths of groundwater
sampling wells were significantly lower than that from FD plots. The EPM of TN
concentration from groundwater sampling wells from CD plots in shallow and medium wells
were also significantly lower than that from FD plots. However, there were no significant
differences of EPM of TN concentration between deep wells in CD and FD plots. The EPM
of orthophosphate (ortho-P) concentration from both CD and FD plots increased from
medium to deep depths. The major part of TP in deep wells for both CD and FD was ortho-P.
Significant difference of EPM of ortho-P and TP concentration were found in shallow wells
of groundwater sampling wells. However, the differences of EPM of TP concentration from
deep wells between CD and FD plots was not significant. Grass uptake of TN and TP in the
CD plots were 3.2% and 15.0% greater than that from FD plots during June 2012 - Sept
3 grass uptake of N and P during dry growing condition contributed to the observed reduction
in N and P loading via subsurface drainage under CD treatment.
KEYWORDS: Agriculture drainage, controlled drainage, swine lagoon effluent, water
4
1.2 Introduction
1.2.1 Agricultural drainage
Agricultural drainage is essential for crop production on naturally poorly drained
soils, often with shallow groundwater table. In humid regions, adequate drainage is needed
for rain-fed crop production systems to remove excess water from plant root zone, improve
crop growth and yield, and provide trafficable conditions for farm machinery to perform
timely field operations such as tillage, fertilization, planting and harvest (Chang and Silva,
2014; Evans and Fausey, 1999; van Schilfgaarde, 1999). In arid and semi-arid regions, where
agriculture relies solely or mostly on irrigation, drainage is frequently used to prevent
waterlogging and salt accumulation in the shallow soil profile ( Ayars et al., 2006).
Artificial drainage systems are categorized as surface or subsurface drainage. Surface
drainage is provided by land grading or other forms of land surface shaping such as furrow
bedded systems. Excess water leaves the agricultural field as surface runoff via open ditches.
Subsurface drainage is usually provided by subsurface tiles or perforated plastic pipes. These
lateral subsurface drain pipes either outlet into a subsurface main pipe or an open ditch.
Subsurface mains eventually outflow into a surface drainage canal or a stream. In addition to
providing surface drainage, field ditches also provide subsurface drainage.
Worldwide, there are approximately 1,525 million hectares (ha) of cropland, of which
41% needs to be improved drainage to sustain crop production. Globally, only 13% of the
total cropland is artificially drained, which indicates the potential for increasing global food
production via agricultural drainage improvement projects (Ayars and Evans, 2015). In the
United States, there are 178 million ha of arable land, of which 48 million ha or 27% are
5 which 24.4 million ha were prone to water logging and flooding. The water logging and
flooding conditions of 21.1 million ha have been improved by the installation of drainage
systems (Wang et al., 2007).
1.2.2 Hydrologic and water quality impacts of agricultural drainage
Major processes affecting the nitrogen cycle in the artificially drained agricultural
land are demonstrated in Figure 1.1. Nitrogen is added to agricultural systems through
inorganic or organic fertilization and precipitation. Nitrogen in ammonium form (NH4+) is mostly adsorbed to soil particles and can be lost via sediment transport and surface runoff.
Ammonia in the gaseous form can be lost through volatilization. For typical soil
carbon-to-nitrogen ratios (8 to 12), net ammonification occurs transforming organic N to NH4+. In the unsaturated zone, NH4+ is nitrified to NO3¯ under aerobic conditions. Both NH4+ andNO3¯ within the root zone are available for plant uptake. Nitrate is highly soluble and susceptible to
leaching with the downward movement of water from the root zone to the shallow
groundwater. Assimilation of NO3¯ to NH4+, a minor process among other transformations of
NO3¯, requires energy and is regulated by NH4+ concentration. Respiratory denitrification is the major form of dissimilatory nitrate reduction in the soil. Dinitrogen and nitrous oxide are
the major products of the denitrification process. Dissimilatory nitrate reduction to
ammonium (DNRA) is another process of nitrate transformation under anaerobic condition
(Myrold, 2005).
Unlike the nitrogen cycle, microbial mediated transformations of phosphorus do not
include oxidation-reduction reactions (Mullen, 2005). In another aspect, increasing of
solubilization of inorganic phosphorus from relatively insoluble phosphate minerals makes
6 plants and microorganisms (Figure 1.2). Key processes affecting phosphorus dynamics in
agricultural land include P mineralization and immobilization occurring during organic
matter decomposition, application of mineral P fertilizers and animal manure,
adsorption/desorption, and solubilization of inorganic phosphorus, as well as crop uptake
(Mullen, 2005). Phosphorus is highly immobile in mineral soils. However, large P input over
the long term causes soil P saturation resulting in potentially high P losses via surface and
subsurface pathways.
Subsurface drainage systems increase subsurface water movement in the soil profile,
lower the water table, increase soil aeration, and reduce surface runoff and soil erosion
(Robinson and Rycroft, 1999). These changes in field hydrology influence nitrogen and
phosphorus dynamics. Well aerated soils promote organic matter decomposition, enhance
nitrification, and slow down or inhibit denitrification. The accelerated downward movement
of water through the soil profile promotes leaching losses of nitrate which eventually leaves
the field via drainage water. The fast movement of shallow groundwater reduces nitrate
residence time in the saturated zone before it reaches the drainage system, which reduces the
denitrification of nitrate in the saturated zone causing relatively high nitrate concentration in
subsurface drainage water.
Agricultural drainage reduces surface runoff, soil erosion, and sediment transport to
streams. As a result, it reduces the agricultural chemicals that are adsorbed to sediments such
as phosphorus, ammonium nitrogen, organic nitrogen, and pesticides (Gilliam et al., 1999).
Recently, losses of dissolved forms of P via drainage have become a public concern,
7 Figure 1.1 Hydrology and nitrogen transformations in an artificially drained field.
DNRA: dissimilatory nitrate reduction to ammonium; Nar: nitrate reductase; Nir: nitrite reductase; Nor: nitric, averill, and Tiedje oxide reductase; Nos: nitrous oxide reductase.
Figure 1.2 Hydrology and phosphorus transformations in an artificially drained field.
1.2.3 Land application of liquid swine manure
North Carolina is the second in swine production in the U.S. (Christenson and Serre,
2015), with more than 2,300 regulated swine feeding operations (NCDEQ, 2016) raising
approximately 8.9 million hogs (Peach, 2014). Traditionally, swine waste (feces and urine)
are flushed from barns to outdoor lagoons. Typically, water usage for cleaning swine
production areas ranges from 0.05 to 0.1 gallons per head per day for in breeding/gestation,
8 and Hoehne, 2001). Swine lagoon effluent (SLE) (sometimes called liquid swine manure) is
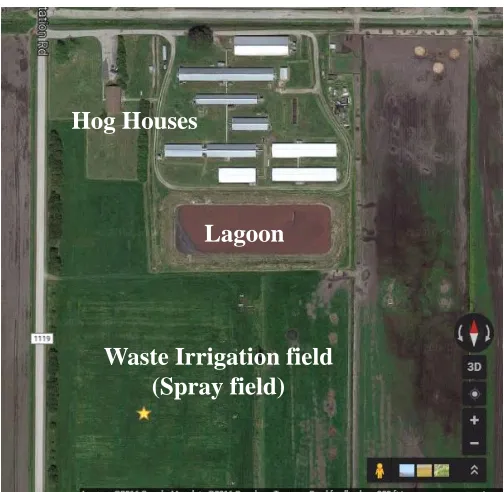
periodically applied via irrigation to a nearby cultivated field (Figure 1.3), referred to as “spray field”. Nutrients in the applied SLE are ideally taken up by plants grown on the field.
The land application of SLE should occur when the soil profile is dry enough to allow for
complete infiltration of irrigated SLE without generating any surface runoff. Irrigation should
be avoided on rainy days or on days preceding imminent storm events to minimize surface
runoff and subsurface leaching losses. Windy days should also be avoided to minimize
irrigation drift and odor associated with SLE irrigation (Adeli et al., 2008). Over application
of manure is linked to transport of nitrogen, phosphorus and pathogens to ground and surface
water, emission of greenhouse gases (N2O) and odor (Larney et al., 2011).
Like other agricultural fields, spray fields on naturally poorly drained soils require
improved drainage to enable land application of SLE at maximum allowable rates to avoid
overflow of lagoons. As a result of improved drainage, the soil profile is drier, the water table
is deeper, and water ponding and surface runoff are less frequent. All of these conditions
favor increasing the rate of land application of SLE, provided that the maximum nutrient
input not be reached for the field. However, artificial drainage on spray fields should be used
with caution as it increased the leaching losses of dissolved nutrients including nitrates and
9 Figure 1.3 A typical swine production operation is showing hog houses, a lagoon receiving animal waste, and spray field receiving the lagoon effluent.
1.2.4 Controlled drainage
Controlled drainage is a drainage water management practice that has been proposed
to reduce nitrogen losses from naturally poorly drained agricultural land with artificial
drainage (Evans et al., 1995; Skaggs et al., 2012a). Controlled drainage is implemented using
drainage control structures that are installed at drain outlets to vary the levels of these outlets
and thus adjust the intensity of drainage as needed (Skaggs, 1999). As previously stated,
drainage is necessary for removing excess water from the root zone during the growing
season and providing timely access for performing field operations. Thus, the required level
of drainage varies during the year and also varies from year to year depending on cropping
practices and weather patterns. Drainage systems that are not controlled (referred to as
conventional or free drainage systems), drain the field with the same outlet elevation
regardless of the actual need for drainage as dictated by crop needs and timing of field
operations. This excess drainage, which does not have any agronomic benefit, increases the
Lagoon
10 export of nitrate via drainage water to receiving streams. Controlled drainage prevents excess
drainage by regulating the level of drainage according to the agronomic and farming needs.
Controlled drainage has been adapted to both subsurface tile-drainage and open-ditch
drainage systems with a variety of drainage control structures designed for both drainage
systems (Littlejohn et al., 2014; Kröger et al., 2015). Controlled drainage has been combined
with sub-irrigation in growing season to achieve higher crop yield (Tan and Zhang, 2011;
Nelson et al., 2011).
Controlled drainage was initially introduced in early 1940’s as a practice to maintain
shallow water table to reduce subsidence of peat soils in Florida (Clayton and Jones, 1941). Controlled drainage was later used since late 1970’s as a practice for reducing nitrogen loss
from drained agricultural land (Gilliam et al., 1979; Drury et al., 1996; Drury et al., 2009;
Evans et al., 1991; Evans et al., 1992; Evans et al., 1995; Fausey, 2005; Jaynes, 2012; Mejia
and Madramootoo, 1998; Poole, 2015; Tan et al., 1998; Tan et al., 2002; Wesström and
Messing, 2007; Williams et al., 2015; Wright et al., 1992). Controlled drainage was accepted
as best management practices (BMP) for reducing non-point source water pollution in North
Carolina. Farmers who voluntarily implement BMPs are compensated for 75% of the cost
from the North Carolina’s Agriculture Cost Share Program authorized in 1984. Additionally,
the Natural Resources Conservation Service of the U.S. Department of Agricultural
(USDA-NRCS) and other federal and state agricultural and environmental agencies promoted
controlled drainage for water conservation and water quality improvement (Evans and
Skaggs, 2004). More than 4000 controlled structures were installed in eastern North Carolina
11
1.2.4.1 Controlled drainage effect on water quality
Controlled drainage reduces nitrogen loss from drained cropland via three
mechanisms: 1) reducing tile drainage outflow, 2) enhancing denitrification in the soil
profile, and 3) increasing crop nitrogen uptake. The reduction in drainage outflow and
increase in nitrogen uptake can easily be quantified experimentally. The difficulty of in-situ
measurement of denitrification makes it quite difficult to quantitatively assess the effect of
controlled drainage on this important biochemical reaction. The increase in nitrogen plant
uptake is associated with higher crop yields under controlled drainage during dry growing
seasons (Skaggs et al., 2012a; Poole et al., 2013).
Several experimental studies have demonstrated the effectiveness of controlled
drainage for reducing nitrogen losses from artificially drained agricultural lands. However,
the reported performance of the practice has varied widely as it depends upon several factors
characterizing local field conditions including climatological conditions, soil properties,
cropping system and farming practices, drainage system design (drain depth and spacing),
and management protocol of control structures. Reported N reduction by controlled drainage
ranges from 18% to more than 75% (Skaggs et al., 2010; Skaggs et al., 2012a; Wesström and
Messing, 2007; Lalonde et al., 1996).
Many experimental studies have been carried out to investigate the performance of
controlled drainage for different soils, climatic conditions, drainage system settings, nitrogen
fertilizer application rates, and crop rotations. Proper and careful management of drainage
control structures is essential during crop growing season in order to prevent the potential
negative effect of the practice on crop growth and yield caused by increased wet stresses on
12 Soils classified as somewhat poorly drained, or very poorly drained with shallow
water tables (positions of seasonal water table under natural drainage condition within 0.5 m)
would benefit from controlled drainage. Otherwise, lateral seepage might become a problem
for naturally well-drained soil (Fouss et al., 1999). In order to control large enough drainage
area to ensure the economic viability of the practice, control structures are usually installed
on land with a slope less than 0.5%. Slopes less than 0.1% might be most practical (Evans et
al., 1992). As slope approaches 1%, the implementation of controlled drainage becomes cost
prohibitive (Fouss et al., 1999; Skaggs and Chescheir, 2003; Cooke et al., 2008). According
to Jaynes et al. (2010), there is 10 million ha of artificially drained arable land in Midwestern
U.S.A. (about 12.5% of total cropland in the U.S. Midwest region) suitable for CD with less
than 0.5% slope.
The performance of controlled ditch drainage was tested in a waste irrigation (swine
lagoon effluent) field near Kinston, NC from 1997 to 2000 (Jia et al., 2006). However,
experimental treatments were not replicated; swine lagoon effluent was not evenly applied to
each treatment, and waste water applications were not properly scheduled (wastewater
irrigation on wet days contributed to unnecessary surface runoff, nitrogen was not fully taken
up by Bermuda grass before it was drained to field ditches). The results of this experiment
did not show a positive effect of controlled drainage on the reduction of nitrogen loss from
the spray field. More research is needed to investigate the performance of controlled drainage
for reducing N losses from land application of liquid animal manure.
Research on the performance of controlled drainage implementation on an open ditch
system in a rice field in Ningxia, China showed that drainage volume was reduced by up to