INTRAGENIC COMPLEMENTATION AMONG TEMPERATURE SENSITIVE MUTANTS
OF
BACTERIOPHAGE T4D’HARRIS BERNSTEIN, R. S. EDGAR A N D G. H. DENHARDT
Department of Genetics, University of California, Dauis,2 and Division of Biology.
California Institute of Technology, Pasadena
Received January 14, 1965
gene. in phage, may be defined as the hereditary information determining
A
the primary structure of a polypeptide chain. In the absence of information concerning mutational alterations of specific proteins, the operational definition of a gene is usually derived from complementation tests. Cells containing two functioning genomes with different recessive mutations in the trans configuration are expected to exhibit a mutant phenotype if the mutations are in the same gene. a wild-type phenotype if the mutations are in different genes.The interpretation of such complementation tests is complicated by the phe- nomenon of intragenic complementation ( CATCHESIDE and OVERTON 1958). Ex- tensive studies have been made on the complementation properties of mutations in a number of genes in a variety of organisms. In general, it is found that the mutants fall in two classes. “Complementing” mutants complement with at least some other mutants of this class defective in the same gene. “Noncomplementing~’ mutants complement neither with each other nor with the complementing mu- tants defective in the same gene. The complementation phenotype is generally intermediate between mutant and wild type. The results of the intragenic com- plementation tests can usually be presented as a complementation map of simple form.
Previous studies of complementation properties of conditional lethal mutations of the bacteriophage T4 (EDGAR and LIELAUSIS 1964; EDGAR, DENHARDT and EPSTEIN 1964) showed that amber mutants ( a m ) were of the noncomplementing type while temperature sensitive mutants ( t s ) were of the complementing type.
It is the purpose of this paper to show that gene complementation maps of simple form can be derived from the complementation patterns of ts mutants.
MATERIALS A N D METHODS
The phage and bacterial strains employed in these studies have been described previously by EDGAR and LIELAUSIS (1964.), EPSTEIN et al. (1963) and EDGAR, DENHARDT and EPSTEIN (1964). The assays for complementation, namely the spot test and burst-size (virus yield per infected bacterium) determination, have also been described by EDGAR, DENHARDT and EPSTEIN (1964). Burst size. after growth at 39.5 to 40.5”C, is expressed in each case in terms of percent of wild-
1 T h i s investigation was aided by grants from the National Foundation, the Public Health Service (E-4267 and RG-6965) and the National Science Foundation (GB-1907).
988 H. BERNSTEIN et al.
C D
F G or H _----
H or G
----
FIGURE I .-A hypothetical complementation matrix and the corresponding complementation
map. Each letter represents a single mutant defect.
type burst at the same temperature. In order to minimize the effect of day-to-day variability in the experimental conditions, wild-type burst size was redetermined along with each separate set of complementation tests. Usually there were about ten complementation tests per set.
Principles of complementation mapping: When a set of mutants defective in the same gene are tested in a large number of pairwise combinations, the results are conventionally scored (in Neurospora and yeast) as a matrix of positive or negative growth responses. The hypothetical matrix shown in Figure 1 is intended as an aid for the discussion of map construction.
The rules for map construction are: (1) When two mutants give a negative (-) comple- mentation response, their defects are represented respectlvely by parallel overlapping lines. (2) When two mutants give a positive ($) responss, their defects are reprssented respectively by nonoverlapping lines. These lines may be drawn either as linear segments or as arcs of a circle
(GROSS 1962, KAPULER and BERNSTEIN 1963). ( 3 ) As successive tests are incorporated into the
map, line segments are rearranged, where possible, s3 as to avoid gaps i n any line representing the defect of a single mutant. (4) The map must be drawn such that wherever one line ends
(except for terminal ends) a new line must begin.
A map in which each single mutant can be repressnt-d by a single uninterrupted line is said to be a one-to-one map. If it is possible to construct only a single linear or circular map from a given matrix of +'s and -'s this map is designated as uniqus. In Figure 1 , if only mutants A
to F are considered, the map is unique. However G and H have been added to illustrate a case of
ambiguity. Although the relative map position of these two mutants to mutants A-F is defined, their position with respect to each other is ambiguous. If a linear complementation map is both one-to-one and unique then each mutant defect is necessarily represented by a line of completely defined position along the horizontal axis. Any set of mutant defects which do not overlap (e.g. in Figure 1, D, E and F) can be said to have a linear order (i.e. D left, E middle, F right). Similarly a radial order could be defined for nonoverlapping mutants in a one-to-one. unique, circular map.
RESULTS
COMPLEMENTATION IN P H A G E T4D 989 for temperature sensitive mutants of four genes, 37,1O, 12 and
34
of bacteriophageT4D.
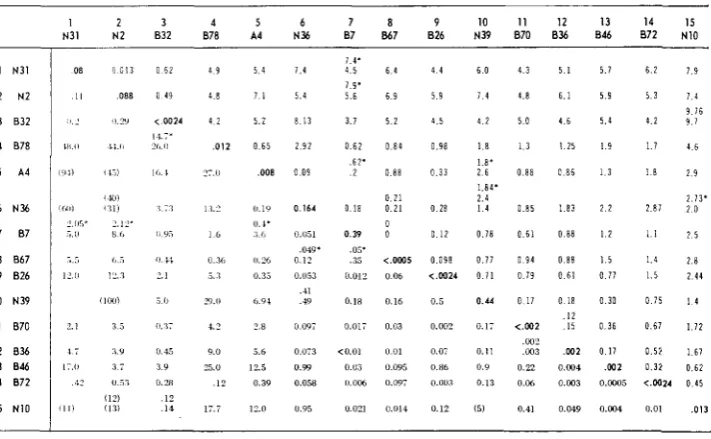
The total available data for genes 37 and 10 are presented in Tables1
and 2. The data for genes 12 and 34 have been presented previously by EDGAR,DEN-
HARDT and EPSTEIN ( 1964) and are presented again here in Tables 3 and 4. In each table the mutants defective in a given gene are listed in identical order both horizontally and vertically so as to form a matrix of painvise responses. The values in the upper right half of a table are recombination frequencies, and the values on the other side of the diagonal are the burst sizes obtained on pairwise infection under restrictive conditions (39.5 to 40.5"C), and presented as percent wild-type burst. The values along the diagonal are the burst sizes obtained on single infection at 39.5" to 40.5"C and are a measure of the ''leakiness'' of each strain under the restrictive condition.
The conventional complementation assay for auxotrophic mutants of Neuro- spora or yeast is a qualitative
(4-
or -) assay depending on the detection of growth o n minimal medium within a specified period of time. In the present case how- ever complementation is measured quantitatively in terms of burst size. The matrix of burst sizes can nevertheless be converted into a matrix of +'s and -'s, formally similar to the Neurospora and yeast matrices, by adopting an arbitrary cut-off burst size. For any given cut-off, burst sizes below the cut-off can be designated as negative (-), and those above as positive (+). When this is done, map construction can proceed according to the standard rules presented under MATERIALS and METHODS.TABLE 1
Complementation and recombinaiion betueen mutants in gene 37
1 N31 2 N2 3 832 4 878
1 2 3 4 5 6 7 8 9 IO 11 12 13 14 15
N31 N2 832 078 A4 N36 8 7 867 826 N39 870 836 846 072 N10
08 ! I
8 :
lli(l
6 N 3 6 7 8 7
8 867 9 826 5 A 4 ~ p l l
I f N
11,',* i ! l
i i
I1 !I
IO N39 11 870 12 836
13 046
14 872
1 5 N 1 0 2 1
t i
1 - 0
I ?
i l l 1
0 6 2 4 9 5 4
0 4 9 4 8 7 1
< 0024 4 2 5 . 2
11.1-
L f , I, ,012 0 6 5
0 4.5 9.0 5.6
3 9 25.0 12.5
0.28 . I 2 0.39 . I ?
.I4 l7.i 12.0 7.4
5 . 4
8 1 3
2 9 2
0 09
0.164 0.U51 0.12 0.053 .-I1 4 9
0 097
0.0:3 U.59 0.058 .01Y' 0.95 1 4. 4 5
7 9' 5 . 6
3.7
0.62 .62'
2
0 18
0.39 .U>* .35 0.012 0.IR 0.017 to.O1 0.03 II.0M 0.021 6 4 6 9 5 2
0 8 4
n 88
0 21 0 . 2 1 0 0
<.OW5
0 06 0.16
0.03
0 01
0.0Y5
0.097
0.!111
4 4 6 0 4 3
5 9 7 4 4.8
4.5 4 2 5 0
0.98 1 8 1 3
1.8' 0.33 2 6 0 88
1.84'
2 . 4
0 28 I 4 0.85 0 I 2 0 . 7 8 0.61
0 098 0 . 1 7 0 9 4
<.CO24 0 7 1 0 19
0.5 0.44 0 17 0.002 0.1: <.w2
.ws 0.01 0.11 . w 3
O.Hb O.Y 0.22
0.UU3 0.13 0.N
0.12 (5) 0.41
5 1
6.1
4 6
I 25 C 86
1 8 3
0 88
0 8 8
0 61
0 18
. I 2
15 .w2 0.W4 0.W3 0.049 5.7 5 9
5 . 4
1 9
1 3
2 2
1 2
I 5
0 11
0 30
0 36 0 1 1 . w 2 0.0005
0 . ~ 4
6 2 7 9
5 3 7 4
4.2 9 1
1.7 4 6
9 16
1 0 2 9
2 73-
2 8 7 2 0
i l 2 5
1.4 2 8 1.5 2 4 4
0 7 5 I 4
0.67 1 1 2
0.51 1 6 1
0.32 0 . 6 2
C W 2 4 0 4 5
0.01 ,013
2
b
3
m
s
-
F
TI
-
5
$
3E:
.-
.- e
v1
i
Y
m
0
il 4-
)I c1
v1 U
.-I
4
.I
*g
+:
q
E: 'j
0 .9
G - C , E
E O
a - z
" E::
G o
.=
K,:
5 E
% E $
a 2 E
.5
v a
$ 2
m s E : %m %
8 ;
E 3 .-
Y
% _ m b
m c 1
M E : ._
m m
.z a
5
E : u 0 '$ O C I
m E :
.- e
E : &
E .-
3
8 4
a 6
7;
: z
$ z
2 .E?
LIZ m
Y
COMPLEMENTATION I N P H A G E T4D 991
Gene 37: In Table 1 the total available recombination and complementation data for 15 mutants in gene 37 are given. The complementation data will be con- sidered first.
By choosing four separate cut-offs, 7.5, 2.5, .75 and .25, the matrix of comple- mentation burst sizes could be converted into four separate matrices of +'s and
-'S. The ratios of
+/-
responses at these cut-offs were respectively 22/82,37/67,47/57 and 62/42. The differences in ratio show that the matrices differed con- siderably from each other.
The four complementation maps constructed from these matrices are shown in Figure 2. The 7.5, 2.5 and .75 cut-off maps are linear, one-to-one and unique. None of the 104 tests performed were exceptional to these three representations. Also at the .25 cut-off the map can be considered linear, one-to-one and unique, but a qualifying comment must be added. Two tests (9
+
15 and 5 f 14) are not consistent with the map as drawn. The burst sizes in these two cases are .12 and .39 respectively. These burst sizes are close to the cut-off, .25. Owing to experi- mental variability, a few such exceptions are certainly to be expected.Under MATERIALS and METHODS it was shown how a linear order of mutant defects in the complementation map could be defined. It is quite clear, merely by inspection of the four complementation maps in Figure 2, that the relative left-right order of mutant defects from map to map is completely consistent. The validity of this assertion can be tested by considering any set of nonoverlapping defects in one of the maps, and comparing the order within this set to the order of the same defects in any other map. For example, consider in the .25 cut-off map the nonoverlapping defects 2, 3, 13, 10, 9, 5, 4. These have the relative left-right order indicated. The order of these same mutant defects in the .75
cut-off map is - 2,3, 13, 10,9,5,4. (An underline is used to indicate an ambiguity of order due to an o v e r l a p T is because of such overlaps that it is necessary to refer to consistency of order rather than identity of order.)
Now the recombination data in Table 1 will be considered.
A
genetic map based on these data is shown in Figure 2. The distances between nearest neighbor sites in this map have been drawn proportional to the frequency of recombination between the mutants defective at these sites. The order of sites is considered re- liable except for 1, 2 and 3, which could possibly be in the wrong sequence with respect to each other.One rather important feature of the map had to be checked by three-point crosses. It can be noted in Figure 2 that there is a relatively long gap in the ge- netic map between sites 3 and 4. This reflects the high recombination frequencies between all mutants in the 1-3 cluster in crosses with all mutants in the 4-15 series. Because of this gap it could not be unambiguously determined from the two-factor cross data whether mutant sites 1-3 were to the left or the right of 4-15. By employing an outside marker in the rll region in three-factor crosses, the following relationships were determined: 5-1 5-rZZ; 1-5-rZZ; 5-1 3 4 Z . These relationships restrict the 1-3 cluster to the left side of 6 1 5 .
It should be noted that the mutant defects in each of the complementation maps (Figure 2) are listed, for convenience, in a vertical sequence which corresponds to the genetic-map sequence.
992 H. BERNSTEIN et al.
Now referring again to Figure 2, it can be seen that the relative left-right order of mutant defects 4-15 in each of the complementation maps corresponds to the order of mutant sites 4-15 in the genetic map. The correspondence can be ex- tended to mutants 1-3 only if the genetic map is drawn as a "hairpin." It should also be noted that a gap is apparent in each of the complementation maps between the sets 1-3 and 4-15. This corresponds to the gap in the genetic map.
The possible significance of these correlations will be taken up in the DIS-
Gene 10: In Table 2 the total available recombination and complementation data for ten mutants in gene 10 are given. The complementation maps for the three cut-offs 7.5, 2.5 and .75 are presented in Figure 3. The ratio of
+/-
re- sponses at each of these cut-offs are 12/33,23/22 and 30/15 respectively. In each case a linear, one-to-one map was obtained. At the 7.5 and 2.5 cut-offs the maps are unique. At the .75 cut-off the map is unique except for the mutant 1 and mutant 10 defects which could be placed either on the extreme left or on the extreme right of the map. There are no inconsistencies in the left-right order of mutant defects from map to map. When a .25 cut-off was used the+/-
ratio was 37/8. At this ratio there are not enough overlaps to allow meaningful map construction.The genetic map based on the recombination data in Table 2 is shown in Figure 3. The distances between neighboring sites have been drawn proportional to the frequencies of recombination between the mutants defective at these sites. CUSSION.
TABLE 2
Complementation and recombination between mutants in gene 10
1 2 3 4 5 6 7 8 9 10 A10 A19 A18 A45 864 877 097
N32 a n ~ 3 3
1 N32
2 B71
3 A33 4 A10 5 A19
b A18
7 A45 8 ab4
9 B77
10 897
1.9 0.79 1.8 1 . 7 2 . 7 3.0 3 . 3 4 . 5 2 . 6 3.1
15 0.01 0 . 8 4 0.86 1.5 1.8 2.4 3.5 1.8 2.6
9.5 0.05 0.18 0 . 2 4 0.89 1.0 2.0 2.3 2 . 0 2.4
4.1 0.03 0.02 0.004 0.8 0 . 8 1 1.9 2.9 2 . 1 3.3
1 . 2 0.44 0.12 0.34 2.3 0 . 1 2 1.6 1.7 1 . 6 2.3
2.5' 3.2'
1 3 0.08 0.12 0 . 0 9 1.8 0.16 1.8 2 . 3 1 . 9 2.5
2 2 . 1.7'
0 . 6 7 1 . 5
53 7.0 12 5.5 8.5 9.5 0.12 0.63
I 5 0.45 1 . 2 0.33 2.8 0 65 3.2 0.001 0 . 2 1 1 . 0
0 . 2 4
38 2.7 4.2 2.1 11 4 . 3 0.95 0.37 0 . 0 2 0 . 4 9
6.2' 1.4'
40 3.1 2.9 1.1 8.7 2.9 0.75 1.8 0.8 0.87
CUTOFF 7 5
1
-
L
5
I
IO
COMPLEMENTATION I N PHAGE T4D
CUT-Off 2 5
I
-
2
3
4
5
6
7
-
1
I
L
CUT Of F 7s
1
-
L 993
1 1 3 4 S b 7
6
I aI Q 9 8
1 I 3 1 5 1 10 9 I 7
5
-
6
7
-
I
-
10d I 2 J ? 2 i 7
FIGURE 3.-Complementation maps and possible genetic maps for gene 10. The numbers not
in italics refer to the mutants listed in Table 2. The italicized numbers in the genetic map refer to map distances in terms of percent recombination.
It should be noted that there is again a gap in the genetic map, in this case between sites 6 and 7. Because of this gap it is not certain if the genetic order 1, 2, 3,4, 5, 6, 7, 8, 9, 10 is correct, or whether the order should be 1 , 2 , 3 , 4 , 5, 6, 10,9, 8, 7. It can also be seen in Figure 3 that there is a good correspondence between the left-right order of mutant defects in the complementation map and the order of sites in the genetic map. The correspondence can be made complete, at least for the 7.5 and 2.5 cut-off maps, by drawing the genetic map either as linear or as a hairpin, depending on which genetic order is assumed.
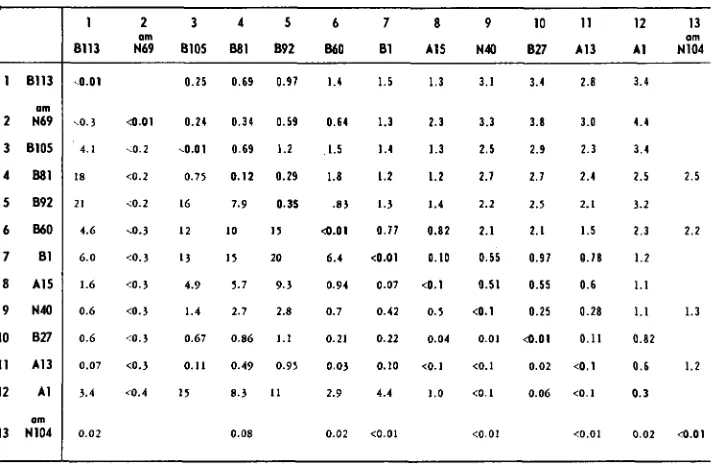
Gene 12: In Table 3 the total available recombination and complementation data are given for 13 mutants defective in gene 12. In Figure 4 the complementa- tion maps for the three cut-offs (7.5, 2.5 and .75) are presented. The ratio of
+/-
responses at these cut-offs are 14/59,25/48 and 32/41 respectively. Included in these maps are two amber mutants am N69 and am N104, which illustrate the generalization, mentioned earlier, that amber mutants show low or negligible intragenic complementation.At each cut-off a linear, one-to-one complementation map can be drawn, such that the relative left-right order of the mutant defects is consistent from map to map. However the maps for the 2.5 and .75 cut-offs have several ambiguities. For instance, in these maps an inversion of the left-right order of 12, 7, 6 and 1 would be consistent with the data, since there is no set of overlaps to restrict the relative order of these mutant defects.. Although not illustrated in Figure 4, a
994 H. BERNSTEIN et al.
TABLE 3
Complementation and recombination between mutanis in gene f 2
1 6113
am
2 N69
3 6105
4 681
5 892
6 660
7 81
a AIS 9 U40
10 827
11 A13
12 A1
am
13 N104
1 2 3 4 5 6 7 8 9 1 0 1 1 12 13
om om
8113 N69 8105 681 692 860 61 A15 N40 627 A13 A1 N104
kO.01
.o. 3
4.1 I8 21 4.6 6.0 1.6 0.6 0.6 0.07 3.4
0 . 0 2
0.25 0.69 0.91 1.4
4 . 0 1 0.24 0.34 0.59 0.64
4 . 2 4 . 0 1 0.69 1.2 1.5
<0.2 0.75 0.12 0.29 1.8
~ 0 . 2 16 7.9 0.35 .83
<0.3 12 10 I5 4 . 0 1
<0.3 I 3 I5 20 6.4
< 0 . 3 4.9 5.7 9.3 0.94
<0.3 1.4 2.7 2.8 0.7
cO.3 0.67 0.86 1.1 0.21
<0.3 0.11 0.49 0.95 0.03
c0.4 15 8.3 11 2.9
0.08 0.02
1.5 1.3 3.1 3.4 1.3 2.3 3.3 3.8
1.4 1.3 2.5 2.9 1.2 1.2 2.1 2.1
1.3 1.4 2.2 2.5
0.11 0.82 2.1 2.1 <0.01 0.10 0.55 0.91
0.07 <0.1 0.51 0.55 0 . 4 2 0.5 4 . 1 0.25
0.22 0.04 0.01 4 . 0 1
0.10 <O.I <0.1 0.02
4.4 1.0 tO.1 0.06
<0.01 <0.01
2.8
3.0
2 . 3
2.4
2. I
1.5
0 . 1 8
0.6 0.28 0.11 4 . 1
<o. 1
<0.01
3.4
4.4
3.4 2.5 2.5
3.2
2.3 2.2 1.2 1.1 1.1 1.3 0 . 8 2 0.6 1.2
0.3
0.02 4 . 0 1
See footnote to Table 1.
~~ 10 11 lL I) CUTOFF 2.5 1
-
I 7-
I I -U- I3C U T O R .75
I
-
I
I,
A
FIGURE 4.-Complementation maps and genetic map for gene 12. The numbers not in italics
COMPLEMENTATION I N P H A G E T4D
TABLE 4
Complementation and recombination between mutants in gene 34
8104
995
B6 3 A44
1
3 B l l l
7 8 2 2 8 am58
10 8104 11 8 4 5 12 B63 13 A44
7 8 9 10 11 12 13 N l 1 8 3 2 8111 3 A20 4 AS1 5 841 6 822 om58 833 8104 845 863 A44
0.03 4.4 6.7 8.1 7.2 8.2 16 12 17 I7
10 0.06 2.1 5.7 6.7 IO 14 13 I2 19 20 25
65 2 8 0.005 2.4 5 . 2 4.3 7.6 9.6 7.5 1 2 15 25 I5 6 2 0 0.017 3.1 6.8 9.7 9.9 13 16 I8 26 21
100 50 100 I8 0.32 1.6 I 1 8.3 IO 12 15 20 23 4 2 34 6 4 1 3 0. 0 9 0.016 11 7.4 12 I5 20 23
I 4 16
4 5 36 7 27 88 75 0.094 3.0 13 I7
0.8 0 . 9 0 . 6 0.11 1.2 1.2 0.12 d . 0 1 1.9 7.6 1 4 I 4 I 3
0.12 0.02 12 21 20 14
30 17 28 I 1 77 5 2 5 5
38 2 3 2 9 28 4 3 67 68 0.09 4 1 0.001 I S I 5 16
0.002 2 11
41 25 S O 28 100 70 62 0 . 3 3 49 53
3 3 17 74 80 77 0.36 29 30 0.41 0.3 IO
0 7 3.5 2 0.3 3.7 3.0 1.1 0.05 0.28 0.32 0.28 1.6 4 . 0 \
I
See footnrite to Table 1.
In the case of this gene, because of the several ambiguities in the complementa- tion maps, it would be premature to speak of a correlation between the genetic and complementation maps. However, it should also be noted that a simple correlation between the two maps is certainly not ruled out by the data.
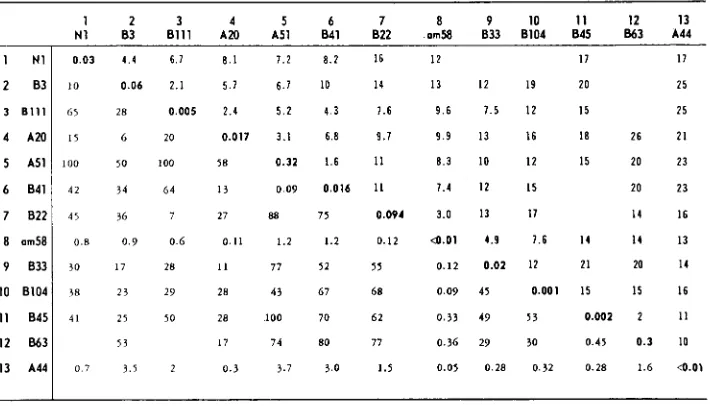
Gene 34: In Table 4, the total available recombination and complementation data are given for 13 mutants defective in gene 34. In Figure 5, the genetic map of the mutant sites in gene 34 is shown. Distances are again represented as pro- portional to the recombination frequencies between nearest neighbor sites. The overall length of gene 34 is about ten times greater than the length of each of the three genes previously considered.
The attribute that all mutants in this region have in common is that they showed no or little complementation with seven amber mutants and the t s mutant A44. However the data for only one of the amber mutants, am 58, is included in Table 4. Unlike the cases discussed previously, a high proportion, 42/65, of the tests (excluding those involving amber mutants and A44) gave burst sizes greater than 35% of the wild-type burst.
0 IO 9 0 so Y O 50
FIGURE 5.-Genetic map of gene 34. The numbers not in italics and prefixed by letters refer
996 H. BERNSTEIN et al.
At the highest cut-off used previously, 7.5, the
+/-
ratio is 61/4 (omitting the amber and A44 tests). Complementation map construction would be meaningless at this extremely high proportion of positive responses, since little overlapping is possible. These results will be considered further in the DISCUSSION.Negative complementation: In Tables 1 to 4 the burst size obtained on single infection at 39.5 to 40.5”C with each individual mutant is recorded along the diagonal. The size of these bursts in each case is a measure of residual function and serves as a control for the complementation tests.
The burst sizes on pairwise mixed infection under the restrictive condition fall into three classes with respect to these controls. These are: (1) The burst size on mixed infection is higher than either control (complementation). (2) The burst size on mixed infection falls between the two controls. (3) The burst size on mixed infection is less than in either of the controls. This last class could be designated by the term “negative complementation.”
For the data in Table 1 (gene 37), the distribution of pairwise tests in the three classes is 83, 16 and 2 respectively. In four cases, where the (<) sign was used, the data are ambiguous. In Table 2 (gene 10) the distribution is 41,8 and 3
respectively. For the data in Table 3 (gene 12) the distribution was 49, 2 and 0 respectively with 22 ambiguous cases, and for Table 4 (gene 34) the distribution
was 75, 1 and 0 respectively.
For all genes the great majority of pairwise tests showed at least some positive complementation. In the cases not showing positive complementation, one might expect an amount of function approximately equal to the mean of the two con- trols. This would be expected if lack of complementation were due to lack of interaction of the mutant polypeptides, and if the input multiplicities of the two mutants were equal.
However among the 27 cases in class (2) there are several instances where the burst size on mixed infection is much less than the mean of the two controls (e.g. in Table 1, B7
+
B26; B7+
B70). In one case, not included in the tables, but involving gene 34, this effect was especially striking. N46 is a very leaky mutant, giving a burst size approximately 35 to 78% of the wild-type burst under the restrictive condition employed. A44, gives a low yield, less than 1% of the wild-type burst. On mixed infection with both N46 and A44 the burst was surprisingly low, less than .5% of the wild-type burst.Of the total of five cases in class (3) the best examples are B7
+
N36 andB7
+
N39, both in Table 1.DISCUSSION
COMPLEMENTATION IN PHAGE T 4 D 997
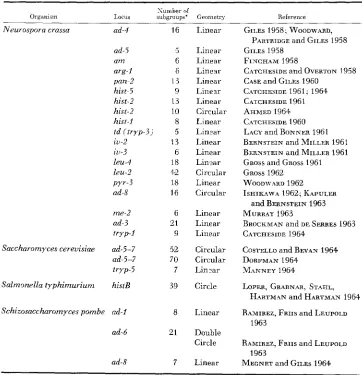
Genes in other organisms for which complex (five or more subgroups) com- plementation maps have been found are listed in Table
5.
In six of the systems listed in Table
5
(CASE and GILES 1960; KAPULER andBERNSTEIN 1963; RAMIREZ, FRIIS and LEUPOLD 1963; DORFMAN 1964; LOPER,
GRAPNAR, STAHL, HARTMAN and HARTMAN 1964; MEGNET and GILES 1964) recombination mapping has been performed, and in each case a correlation has been observed between the order of mutants in the complementation and recom- bination maps. This correlation is also found f o r three of the genes reported on here.
T h e molecular basis of complementation: In vitro complementation studies in
TABLE 5
Complex complementation maps
Neurospora crassa ad-4
ad-5 a m arg-l pan-2 hist-5 hist-2 hist-2 hisr-I td (tryp-3) iu-2 iu-3 leu-4 leu-2 PYY-3 ad-8 me-2 ad-3 tryp-I
Saccharomyces cereuisiae ad-5-7 ad-5-7 tryp-5
Salmonella typhimurium histB
Schizosaccharomyces pombe ad-l
ad-6 16 5 6 6 13 9 13 10 8 5 13 6 18 42 18 16 6 21 9 52 70 7 39 8 21 7 Linear Linear Linear Linear Linear Linear Linear Circular Linear Linear Linear Linear Lin-ar Circular Linear Circular Linear Linear Linear Circular Circular Lin2ar Circle Linear Double Circle Linear
GILES 1958, WOODWARD,
GILES 1958
FINCHAM 1958
CASE and GILES 1960 CATCAESIDE 1961, 1964 CATCHESIDE 1961
AHMED 1964
CATCHESIDE 1960 LACY and BONNER 1961 BERNSTEIN and MILLER 1961 BERNSTEIN and MILLER 1961
GROSS and GROSS 1961
GROSS 1962
ISHIKAWA 1962, KAPULER
and BERNSTEIN 1963 MURRAY 1963
BROCKMAN and DE SERRES 1963 CATCHESIDE 1964
COSTELLO and BEVAN 1964 DORFMAN 1964
MANNEY 1964
LOPER, GRARNAR, STAEIL,
PARTRIDGE and GILES 1958
C4TCHESIDE and O V E R T O N 1958
W O O D \ + 9RD 1962
H A R T M ~ N and HARTMAN 1964 RAMIREZ, FRIIS and LEUPOLD
1963
RAMIREZ, FRm and LEUPOLD
MECNET and GILES 1964 1963
998 H . BERNSTEIN et al.
Neurospora employing extracts of separately grown mutants have been carried out by WOODWARD ( 1 959) and LOPER (1961 ). The occurrence of complementa- tion in these experiments under conditions unsuitable for further protein syn- thesis argue that complementation results from cytoplasmic interaction of pre- formed proteins. PARTRIDGE (1960) showed for the first of these systems that the active enzyme, adenylosuccinase, formed on in vitro complementation differed in its physical properties from the wild-type enzyme. This has also been shown by FINCHAM ( 1959) for glutamate dehydrogenase formed by complementation in vivo. Further in vitro experiments by FINCHAM and CODDINGTON (1963a, b) employing purified proteins from several mutants suggest that complementation leading to restored glutamate dehydrogenase activity results from the formation of mixed aggregates containing about eight subunits. Finally, in vitro comple- mentation studies by SCHLESINGER and LEVINTHAL (1963) have shown that intragenic complementation between mutants defective for alkaline phosphatase in E. coli is due to the formation of hybrid aggregates (in this case dimers).
These results all support the theory that intragenic complementation, in gen- eral, results from the interaction of differently defective polypeptide monomers to form an active aggregate. The term “multimer” (CRICK and ORGEL 1964) may be used to denote such an aggregate.
The mechanism of intragenic complementation: The linear order and relative spacing of mutational sites in the recombination map of a gene corresponds to the order and relative spacing of amino acid defects in the polypeptide specified by the gene ( SARABHAI et al. 1964; YANOFSKY et al. 1964).
It is generally observed that any given.mutant will not complement or will complement poorly with any other mutant defective at a very closely linked site. This suggests that the first mutant specifies a polypeptide with a sterically altered region which “overlaps” the steric alteration in the homologous polypeptide specified by the second mutant. Two such mutants would not complement if homologous portions of neighboring polypeptides are adjoined in the mixed pro- tein aggregate. The intimate apposition of a defective and an unaltered region could be expected to lead to amelioration of the defect, whereas apposition of two overlapping defective regions could be expected to lead to no or relatively less amelioration. Cases where mutants far apart in the recombination map also fail to complement, may indicate a “turning back” on itself of the polypeptide chain.
A molecular model of complementation for gene 37: The major results obtained with gene 37 were: (1) The complementation maps at all cut-offs were linear. (2) Each mutant was representable by a single line in each of the complementa- tion maps (although two exceptional tests were noted). ( 3 ) The left-right order of mutant defects was consistent for all of the complementation maps. (4) The order of mutant defects in the genetic and complementation maps could be cor- related when the former map was drawn as a hairpin. ( 5 ) There was a gap in the complementation map which corresponded to the gap in the genetic map.
COMPLEMENTATION I N P H A G E T4D 999 more than one type” and that “twofold axes are likely to be most common.” This viewpoint led to the following predictions concerning complementation maps and their correlation with genetic maps.
“Mutants affecting the same region. near a rotation axis, will often be near together on the genetic map. Thus in many cases such mutants will not comple- ment each other. The length of a ‘segment’ in a complementation map will be a rough measure of the length of the region misfolded by the mutants in that seg- ment. If misfolding spreads along the length of the polypeptide chain there will be a general tendency for the genetic map and the complementation map to be co-linear, but there will be exceptions. If it spreads not along the chain but to adjacent folded segments, the complementation map may remain linear but it may not be co-linear with the genetic map. Complicated misfoldings may easily produce non-linear, circular o r spiral complementation maps.”
This proposal by CRICK and ORGEL, although not too explicit, seems to predict more disorderliness of mapping than was actually found in the present study. A
model such as the one presented by KAPULER and BERNSTEIN (1963) which in- volves homologous stacking in contrast to symmetrical aggregation seems better to accommodate the orderliness of the data.
Gene 34: The results obtained with gene 34 differed in two ways from the results obtained with the other genes. (1 ) The total measured recombination map length of gene 34 was about ten times greater than in the other cases. (2) Most pairwise tests between mutants defective in the region gave high burst sizes
(comparable to that expected of intergenic tests).
An explanation encompassing both the long recombination length of gene 34 and the generally high complementation values can be offered. If gene 34 specifies replicas of an unusually long polypeptide which undergoes aggregation and com- plementation, the steric defects in any two different mutant monomers are likely to be quite far apart in the mixed aggregate. Thus most pairwise complementa- tion tests would give high values.
Gene 34 is known to specify a structural component of the phage tail fibres (EPSTEIN et al. 1963)
,
perhaps the main component. It is not unreasonable to suppose that these fibres are composed of a small number of long polypeptide chains in some simple aggregated arrangement.Negative complementation: It was postulated that in a mixed aggregate mole- cules with nonoverlapping defects would complement and molecules with over- lapping defects would not complement. Now it is proposed that two defective molecules each with residual activity and mutually overlapping defects may interact in a negative way so as to decrease residual function.
1000 H. BERNSTEIN et al.
The nature of complementation between temperature sensitiue mutants: Sev- eral differences between complementation tests for genes controlling enzymes in biochemical pathways and the studies reported here should be noted. Since our assay is the production of active phage, we have no assurance that this measure is proportional to the amount of active gene-product protein produced. Some genes control the production of structural proteins of the phage (gene 34 and 37
for example) which in some cases (the head protein for example) may be required in large amounts for phage assembly. Still other gene products may be required in amounts much lower than are normally produced for the production of normal phage yields. Thus the successful construction of complementation maps based on burst size measurements may not be possible for all phage genes.
In the studies reported here, complementation occurs under continuous restric- tive conditions, that is, high temperature during the whole growth cycle. There is evidence (L. B. BOICE, unpublished) that for some temperature mutants at least, the step in protein synthesis sensitive to temperature is prior to the forma- tion of finished multimer. This may well be a general phenomenon. If formation of a finished multimer were a two-step process, the formation of irreversibly folded monomer subunits and then their aggregation, one might expect in many cases that the denaturation by high temperature of the mutant monomers would render them incapable of subsequent aggregation and complementation. The fact that virtually all temperature mutants do show some degree of complementation suggests that there is no free irreversibly folded monomer stage, even for the case of complementation multimers where the different polypeptide chains must be made on different messenger RNA's.
SUMMARY
Studies of intragenic complementation were carried out with respect to four genes of phage T4. These studies were made possible by the use of temperature sensitive mutants which, as a class, are defective in many if not all of the genes of the phage. The quantitative measure of intragenic complementation employed here was burst size, determined after mixed infection with two mutants at 39.5 to 40.5"C. From the matrices of complementation responses for three genes it was possible to construct linear complementation maps. In these maps each mutant could be represented by a single continuous line. In the first two cases, for which unique complementation maps could be obtained, a correlation was demonstrated between the order of mutant sites in the recombinational map with the order of corresponding mutant defects in the complementation maps.
LITERATURE CITED
AHMED, A., 1964
in Neurospora. Ph.D. thesis. Yale University, New Haven, Cmnecticut.
BERNSTEIN, H., and A. MILLER, 1961
of Neurospora crassa. Genetics 46: 1039-1052.
BROCKMAN, H. E., and F. J. DE SERRFS, 1963
by 2-aminopurine. Genetics 48: 597-604.
Regulation and gene enzyme relationships in the biosynthesis of histidine in
Complementation studies with isoleucke-valine mutants
C O M P L E M E N T A T I O N I N P H A G E T 4 D 1001
CASE, M. E., and N. H. GILES, 1960
CATCHESIDS, D. G., 1960
Comparative complementation and genetic maps of the
pan-2 locus in Neurospora crassa. Proc. Natl. Acad. Sci. U.S. 46: 659-676.
Complemmtation among histidine mutants of Neurospora crassa. Proc. Roy. Soc. London B 153: 179-194. -- 1964 Inter-allelic complementation. Brook-
haven Symp. Biol. 17: 1-14.
Cdd Spring Harbor Symp. Quant. Biol. 23: 137-140.
Genetics 50: 1219-1230.
CATCHESIDE, D. G.: and A. OVERTON, 1958
COSTELM, W. P.. and E. A. BEVAN, 1964
CRICK, F. H. C.. and L. E. ORGEL: 1954
Complementation bctween alleles in heterokaryons.
Complement3tion between ad-5-7 alleles in yeast.
The theory of inter-allelic complementation. J. Mol. Biol. 8: 161-165.
DORFMAN, B. Z., 1964 Complemzntatisn and meioti recombinaticn at the ad-5-7 locus in
Saccharomyces czreuisiae. Genet:cs 5 0 : 1231-1243.
EDGAR, R. S., G. H. DENHARDT, and R. H. EPSTEIN, 1964 A ccmparative genetic study of con- ditional lethal mutations of bacteriophage T4D. Genetics 49 : 635-648.
EDGAR, R. S., and I. LIELAUSIS, 1964 Temperature-sensitive mutants of bacteriophage T4-D: their isolation and genetic characterization. Genetics 49 : 649-662.
EPSTEIN: R. H., A. BOLLE, C. M. STEINBERG, E. KELLENBERGER, E. BOY DE LA TOUR, R. CHEVALLEY,
R. S. EDGAR, M. SUSMAN, G. H. DENHARDT, and A. LIELAUSIS, 1963 Physiological studies
of conditional lethal mutants of bacteriophage T4D. Cold Spring Harbor Symp. Quant. Biol. 28: 375-394.
The role of chromosomal loci in enzyme formation. Proc. 10th Intern. Congr. Genetics 1 : 355-363. ~ 1959 On the nature of the glutamic dehydrogenase
produced by inter-allelic complementation at the am locus of Neurospora crassa. J. Gen. Microbiol. 21 : 600-61 1,
Complementation at the am locus of Neurospora crassa: a reaction between different mutant forms of glutamate dehydrogenase. J. Mol. Biol. 6: 351-373. __ 1963b The mechanism of complementation between am mutants of Neurospora crassa. Cold Spring Harbor Symp. Quant. Biol. 28: 517-527.
Mutations at specific loci in Neurospora. Proc. 10th Intern. Congr. Genetics
1 : 261-1179, FINCHAM, J. R. S., 1958
FINCHAM, J. R. S., and A. CODDINGTON, 1963a
GILES, N. H., 1958
GROSS, S. R., 1962 On the mechanism of complementaticn at the leu-2 locus of Neurospora. Proc. Natl. Acad. Sci. U.S. 48: 922-930.
GROSS, S. R., and H. S. GROSS, 1961 Some features of complementation at the leucine-4 locus of Neurospora. (Abstr.) Genetics 46: 868-869.
ISHIKAWA, T., 1962 Genetic studies of ad-8 mutants in Neurospora crassa. 11. Inter-allelic complementation at the ad-8 l x u s . Gen2t:cs 47: 1755-1770.
KAPULER. A. M., and H. BERNSTEIN, 1963 A mdecular model for an enzyme based on a corre- lation between the genetic and complemmtation maps of the locus specifying the enzyme. J. Mol. Biol. 6 : 443-451,
LACY, A. M., and D. M. BONNER, 1961
LOPER, J. C., 1961
Complementation between alleles of the td locus in
Neurospora crassa. Proc. Natl. Acad. Sci. U S . 47: 72-77.
Enzyme complementation in mixed extracts of mutants from the Salmonella histidine B locus. Proc. Natl. Acad. Sci. U.S. 47: IMO-1450.
LOPER: J. C., M. GRABNAR, R. C. STAHI., 2. HARTMAN, and P. E. HARTMAN, 1964 Genes and
1002 H. BERNSTEIN et al.
MANNEY, T. R., 1964
MFGNET, R., and N. H. GILES, 1964
MURRAY, N. E., 1963
PARTRIDGE, C. W. H., 1960
Action of a super-suppressor in yeast in relation to allelic mapping and complementation. Genetics 50: 109-121.
Allelic complementation at the adenylosuccinase locus in
Schizosaccharomyces pombe. Genetics 5 0 : 967-971.
Polarized recombination and fine structure within the me-2 gene of
Neurospora crmsa. Genetics 48 : 1163-1 183.
Altered properties of the enzyme, adenylosuccinase, produced by inter-allelic complementation at the ad-4 locus in Neurospora crmsa. Biochem. Biophys. Res. Comm. 3: 613419.
Allelic recombination and complementation in adenine-requiring mutants of Schizosaccharomyces pombe. (Abstr.) Proc. 1 l t h Intern. Congr. Genetics 1 : 7.
SARABHAI, A. S., A. 0. W. STRETTON, S. BRENNER, and A. BOLLE, 1964. Co-linearity of the gene with the polypeptide chain. Nature 201: 13-17.
SCHLESINGER, M. J., and C. LEVINTHAL, 1963 Hybrid protein formation of E. coli alkaline phosphatase leading to in vitro complementation. J. Mol. Biol. 7: 1-12.
WOODWARD, D. O., 1959 Enzyme complementation in vitro between adenylosuccinaseless mutants of Neurospora crmsa. Proc. Natl. Acad. Sci. U.S. 45: 846850.
WOODWARD, D. O., C. W. H. PARTRIDGE, and N. H. GILES, 1958 Complementation at the acl-4
locus in Neurospora crassa. Proc. Natl. Acad. Sci. U S . 44: 1237-1244.
WOODWARD, V. W., 1962 Complementation and recombination among pyr-3 heteroalleles of
Neurospora crassa. Proc. Natl. Acad. Sci. U.S. 48: 348-356.