USE OF CTOD AS CRACK DRIVING FORCE PARAMETER
FOR LOW-CYCLE THERMAL FATIGUE
Juha Kuutti1, Iikka Virkkunen2
1 Senior Scientist, Structural Integrity, VTT Technical Research Centre of Finland 2 Professor (adj.), Engineering Materials, Aalto University, Finland
ABSTRACT
Repeated exposure to rapid temperature transients causes gradual damage in material. This is called thermal fatigue. Thermal fatigue is an important degradation mechanism in nuclear power plant components and can limit the plant lifetime where thermal loads are present, e.g., due to turbulent mixing or change in plant operating conditions. The effects of the thermal load cycles include residual stresses, hardening or softening of the material and, finally, crack initiation and growth.
Traditionally, thermal fatigue crack growth rates are estimated from the stress intensity factors calculated using uncracked stress distributions and the Paris’ law. In the low-cycle regime, the use of weight function based stress intensity factor solutions derived under linear elastic assumptions is questionable due to considerable plasticity. On the other hand, numerical contour integral techniques are ill-suited for thermal cyclic loading.
In this work, the use of the crack opening displacement as the crack driving force parameter is evaluated through simulations of low-cycle thermal fatigue experiments. The use of the crack tip opening displacement parameter avoids the traditional limitations in the numerical evaluation of the J-integral. The unique relationship between the crack opening displacement and J-integral is derived and the crack driving force is used in a crack growth assessment. The results show that the crack driving force calculated from the uncracked stress distributions overestimates the crack driving force significantly (as compared to values calculated from the crack opening displacement). The crack growth rate calculated with the Paris’ law is in good agreement with the experimental results, when the crack driving force is computed from the crack opening displacement.
INTRODUCTION
The aim of this work is to present a numerical approach for assessing the severity and growth rate of cracking caused by cyclic thermal loading. This work studies the crack manufacturing process performed by Trueflaw LTD (Trueflaw, 2017).
Trueflaw LTD manufactures cracks using thermal fatigue loading in different types of specimens. Each flaw producing process can be considered as a thermal fatigue experiment done on a real component. In the experiments, the thermal fatigue loading is applied with alternating high frequency induction heating and water spray cooling. A more detailed description on the experiments can be found in the references of the website publication list (Trueflaw, 2017). Typical material effects caused by the low-cycle thermal loading of the crack manufacturing process are the steep stress and strain gradients near the heating regions, considerable cyclic plasticity, initiation and propagation of a crack in the heating area and crack halting after the crack has propagated outside of the high stress and strain gradient region.
In early stages of the current research, the thermal fatigue crack growth was studied using FE-modelling with an uncracked specimen model. The stress and strain results obtained from the simulations of several test specimens in the uncracked state together with the experimentally determined cycle counts were utilized in constructing a S-N plot for thermal fatigue. The resulting S-N plot is shown in Figure 1.
experiments. The validity of the utilized method of determining the stress intensity factor using the weight functions and the stress fields in the crack location in the uncracked state could not be confirmed. These issues are addressed in this work by incorporating the effect of the crack in the analysis and evaluating the crack driving force and growth rate using the simulation results.
Figure 1. S-N plot with the selected Trueflaw LTD fatigue data. Clean inspections (no crack) are shown with open triangles. Inspections where a flaw was found are shown with filled triangles. The strain range
is calculated using FE-analyses for each case separately.
In this work, the crack that initiates and propagates in the experiments, is included in the assessment. The aim of the finite element simulations is to assess the effect of the crack on the stress and strain fields near the loading region, to determine the crack driving force under cyclic thermal loads and to assess the crack growth behaviour. A comparison between the current “cracked” results and previously obtained “uncracked” results is made.
BACKGROUND ON MODELLING THERMAL FATIGUE
and the subsequent growth is modelled with the traditional fatigue crack growth models using the crack driving forces simulated for the actual crack.
The method utilized in the current work is very similar to the method utilized by Paffumi et al. (2008). They studied the effects of cyclic thermal load on nuclear stainless steels using experimental and numerical approaches. In their experimental set-up they utilized a thick tubular pipe section (Ri/t=1.4) that
was subjected to thermal cycling such that the external surface of the pipe was held at constant temperature while the inner surface was exposed to repeated quenching with room temperature water with frequency of approximately 0.02 Hz. The numerical section of their work compared the crack loading and lifetime predictions obtained from the stress and strain amplitudes evaluated at the component’s uncracked state with the actual crack driving forces, growth rates and growth curves calculated from the finite element simulations with the actual crack included in the model. They found that cycles to initiation can be estimated using the standard isothermal fatigue curves. The use of elastic stresses produced overly conservative crack growth rates but the growth rates calculated with elastic-plastic stresses were in bounds of the experimental results. The stress intensity factors estimated from the crack tip opening displacements were lower than those calculated from the elastic-plastic uncracked stress results. The current work aims to determine whether these two last-mentioned findings hold also for the studied Trueflaw’s crack manufacturing process. In the currently studied thermal loading case both the heating and cooling loads are acting on the same surface and the thermal load frequency studied in this work is approximately 0.5 Hz.
DESCRIPTION OF THE PERFORMED ANALYSES
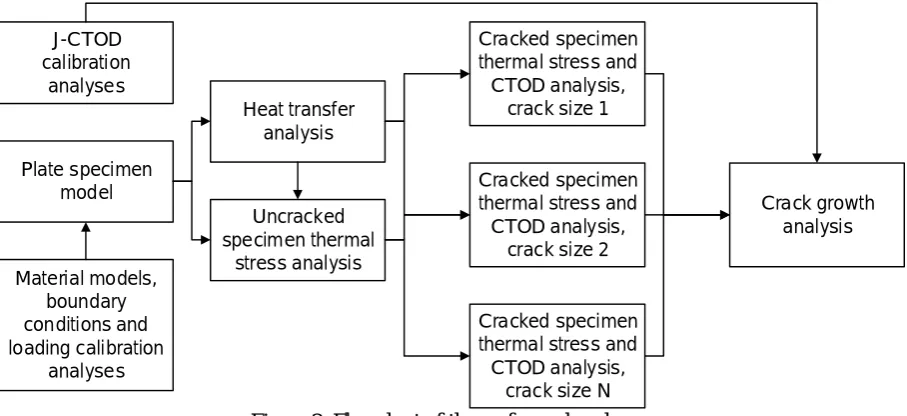
This work studies the low-cycle thermal fatigue case using thermal, structural and fracture mechanical FE-analyses. The simulation scheme starts with heat transfer and thermal stress analyses of the uncracked specimen model. Several load cycles were solved to obtain a stabilized stress-strain cycle. The stress and strain state of the uncracked model was mapped into several models containing pre-defined flaws of different sizes. The response of each model with a flaw was then solved for several thermal load cycles. The crack tip opening displacement (CTOD) maxima over the crack front during the stabilized load cycle were extracted for each model. The CTODs were transformed into J-integrals for an evaluation of the crack growth that was performed with Matlab using numerical integration of the Paris Law. The multi-phase analysis scheme is explained in detail in Figure 2.
J-CTOD calibration
analyses
Plate specimen model
Material models, boundary conditions and loading calibration
analyses
Heat transfer analysis
Uncracked specimen thermal
stress analysis
Cracked specimen thermal stress and CTOD analysis,
crack size N Cracked specimen thermal stress and CTOD analysis,
crack size 1
Cracked specimen thermal stress and CTOD analysis,
crack size 2
Crack growth analysis
Figure 2. Flowchart of the performed analyses.
acting on an ellipsoidal area in the middle of the specimen top surface. The cyclic thermal load, that is alternating high frequency induction heating and water spray cooling, was modelled using a temperature boundary condition in the heating area that depends on time and coordinates within the heating area.
SIMULATION CASE
The geometry, boundary conditions and applied loading of the studied case are shown in Figure 3a. The boundary conditions of the thermal analyses were calibrated using experimental measurements of the specimen temperature. The thermal cycle is modelled with a slow temperature increase from 20 °C to 350 °C and a rapid decrease back to 20 °C followed by a hold phase. The thermal load was assumed to act with its full intensity at the heating area centre point and linearly reduce to 80 % of its full value at the elliptical heating area edges. Dozens of load cycles were applied to obtain a stabilized thermal and structural response in the specimen after which the crack was introduced in the simulation. It was assumed that the crack does not affect the heat flux in the system and thus the heat transfer analysis was performed only for the uncracked state. Simply supported and symmetry boundary conditions were utilized in the mechanical analyses.
10
m
m
Adiabatic, symmetry plane Heating area
a) b)
S
tr
e
s
s
(M
P
a
)
c) d)
Figure 3. Studied plate component under cyclic thermal loading (a), element meshes used in the thermal analysis (b) and stress and crack opening analysis (c), uniaxial cyclic stress-strain curves calculated with
the Chaboche model utilized in the assessment (d).
Semi-elliptical surface cracks were assumed to be initiated in the middle of the heating area with the crack normal parallel to the minor axis of the ellipse. Three separate crack size ratios were considered; a/c = 1.0 (perfectly circular), a/c = 0.5 and a/c = 0.25 (long and shallow crack). The smallest considered crack is a = 0.5 mm; c = 0.5 mm and the largest considered crack is a = 2.75 mm; c = 11 mm. Ten different crack depths were modelled and the total number of modelled individual cracks is 30.
Simulation models with unique meshes were utilized for heat transfer analysis, in uncracked thermal stress analysis and in all crack opening analyses as shown in Figure 3b-c. The CTODs used for
0 0.5 1 1.5 2
Time (s) 0
characterizing the crack driving force were extracted from the nodes closest to the crack tip located at the distance r = 50 m. In the simulation models with cracks, a rigid plate in the crack plane region was included to model the effect of crack closure. Frictionless non-cohesive contact between the crack plane and the rigid plate was assumed.
All analyses were carried out using Abaqus/Standard quasi-statically, i.e. neglecting the effect of inertias and strain-rate related aspects. A fixed time step of 0.1 seconds corresponding to the definition of the loading cycle time increments was used.
The plate material is stainless steel SS316. The elastic and thermal material properties utilized in the analyses were adopted from the ASME material handbook (ASME 2011). The structural analyses utilized the Chaboche cyclic plastic material model (Lemaitre and Chaboche 1990) that contains both isotropic and kinematic hardening components. The resulting uniaxial cyclic stress-strain curves are plotted in Figure 3d. The original source of the cyclic material properties is according to Crooker et al. (2011).
RELATIONSHIP BETWEEN THE J-INTEGRAL AND CTOD
The path-dependence of the contour integrals due to the transient residual and thermal stresses prevents the traditional calculation of the J-integral. The continuous cyclic loading, thermal inertia and considerable plasticity also prevent the traditional residual stress correction techniques in the J-integral evaluation. Therefore, an alternative method of evaluating the J-integral based on the CTODs was applied. The relationship between the crack opening and J-integral is known to be unique, for a given material. This relationship is derived in this chapter. The formulae are taken from the fracture mechanics textbook (Anderson 2005).
In the LEFM regime, the relation between the crack flank opening and the stress intensity factor is obtained from the crack tip stress analysis. The Mode I stress intensity factor can be evaluated from the extrapolation of the crack opening displacement as
r u E
K y
r I
2 4 ' lim
0 , (1a)
where uy is the crack flank opening, E’ is the plane strain or plane stress elastic modulus and r is the
distance measured from the crack tip. A J-integral parameter for the LEFM regime is obtained by utilizing the relationship between the stress intensity factor and J-integral:
'
2
E K
J I
LEFM . (1b)
In the EPFM regime, the relation between the J-integral and CTOD is of the general form
CTOD m
JEPFM y , (2)
where y is the material yield stress and constantm is in the range from 1.0 to 2.0, depending on the stress
state and strain hardening. Comparing the relations (1a-b) and (2) between the CTOD and J-integral in both the LEFM and EPFM regimes, we observe that in the LEFM regime, the J-integral is a quadratic function of CTOD and in the EPFM regime, the J-integral is a linear function of the CTOD. Simulations show that the transition between the regimes does not occur at a discrete CTOD point but over a transition regime. Therefore, a third relation to cover this transition regime is utilized. A power-law function is assumed for the transition region:
b trans aCTOD
J . (3)
The parametersa andb are calibrated such that the transition curve meets the elastic and plastic relations (1b) and (2) at the transition points that are the additional model parameters.
Determination of Resistance to Stable Crack Extension Under Low-Constraint Conditions (ASTM 2006), the CTOD and CTOA are geometrically related:
r CTOD r CTOD CTOA 2 tan 2 1 1 , (4)
wherer is the distance measured from the crack tip. The approximation in the above is due to the small angle assumption. The CTOA is also not defined when r approaches zero. By assuming that the crack opening shape is triangular, the CTOA can be evaluated from the CTOD values located at a finite distance
R from the crack tip. All regimes combined, the model using the CTOA parameter reads:
2 2 1 1 2 for for for 2 8 ' 1 CTOA CTOA R CTOA m J CTOA CTOA CTOA R aCTOA J CTOA CTOA R R CTOA E J y b . (5)
The free parameters in the above are the yield stress y, coefficient m and the transition points
CTOA1 and CTOA2. The parameters were calibrated by means of numerical simulation. The
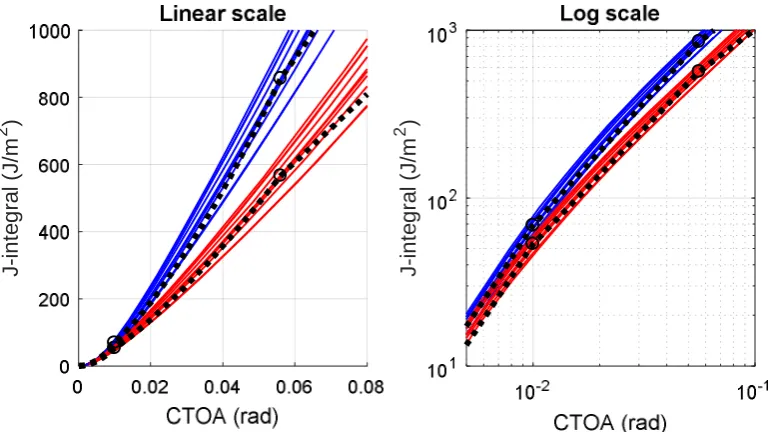
surface-cracked plate models built for the thermal fatigue assessment were subjected to uniform tensile loads and the J-integrals were calculated by Abaqus using the normal contour integral evaluation routine. The simulated J-integrals are plotted as a function of the CTOA in Figure 4. As can be seen from the exponents in the model, a logarithmic representation of the results is useful to identify the location of the transition points. The calibrated model prediction is shown also in the figure.
J -i n te g ra l (J /m 2 ) J -i n te g ra l (J /m 2 )
Figure 4. Simulated CTOA and J-integral values for 10 different crack sizes (colored solid lines) and the fitted J-CTOA model predictions (black dashed line). Results are shown for simulations performed using the material parameters for temperatures of 20 °C and 350 °C in both linear and logarithmic scales. The
dots correspond to the transition points of the model.
FINITE ELEMENT ANALYSES
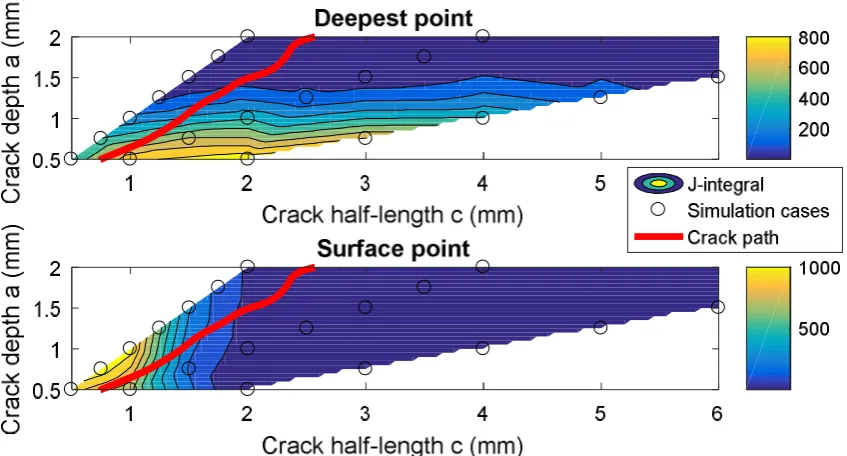
the model and converted into J-integrals using the formulated model as shown in Figure 6. The maximum deepest and surface point CTOAs for all studied flaws are presented as the background contour plot in Figure 7.
Heating at maximum (121.0 s)
End of cooling (121.3 s)
End of hold, start of next cycle (120.0/122.0 s)
S
tr
e
s
s
(M
P
a
)
Figure 5. Stress (Pa) normal to flaw plane contour plots (flaw is located at the upper right corner in the figures) and through-thickness stress distributions over a single thermal load cycle.
CRACK GROWTH ANALYSIS
The CTOAs were utilized in the crack growth computations. The crack growth was computed using a Paris Law type power law model that utilizes the J-integral as a crack driving force parameter:
n J C dN
da
, J Jmax Jmin, (6)
whereda is the crack depth increment,dN is the cycle increment,Jmax andJmin are the maximum
and minimum J-integral values obtained during a single cycle andC andn are material parameters. For the current case, all Jmin values are zero (indicating crack closure at some point during the cycle) and thus
the J-integral range equals its maximum value. The parameters C and n are determined from the parameters given by the ASME Section XI Article C-8000 (ASME 2004) for the Paris Law, converted to be applicable for the J-integral and adjusted based on the initial crack growth rate. An initial crack depth of 0.5 mm was assumed and the crack initial aspect ratio was selected after a few iterations to be a/c = 0.67.
Heating at maximum (121.0 s) End of cooling (121.3 s)
End of hold, start of next cycle (120.0/122.0 s)
C
T
O
A
(r
a
d
)
J
-i
n
te
g
ra
l(
J
/m
2 )
–
Deepest point CTOA,–
Surface point CTOA,–
Deepest point J-integral,–
Deepest point J-integralFigure 6. Crack opening displacement (m) contour during the heating-cooling cycle and crack opening angle and corresponding J-integral for the deepest and surface points for a flaw of sizea=1 mm, 2c=2
mm. Dark grey color in the contours indicates crack closure.
C
ra
c
k
d
e
p
th
a
a
n
d
h
a
lf
-l
e
n
g
th
c
(m
m
)
J
-i
n
te
g
ra
l
(J
/m
2 )
–
Crack depth, deepest point J-integral,–
Crack half-length, surface point J-integral, Measured crack depth value, Measured crack half-length value,--
Deepest point J-integral calculated using intact specimen stresses,--Surface point J-integral calculated using intact specimen
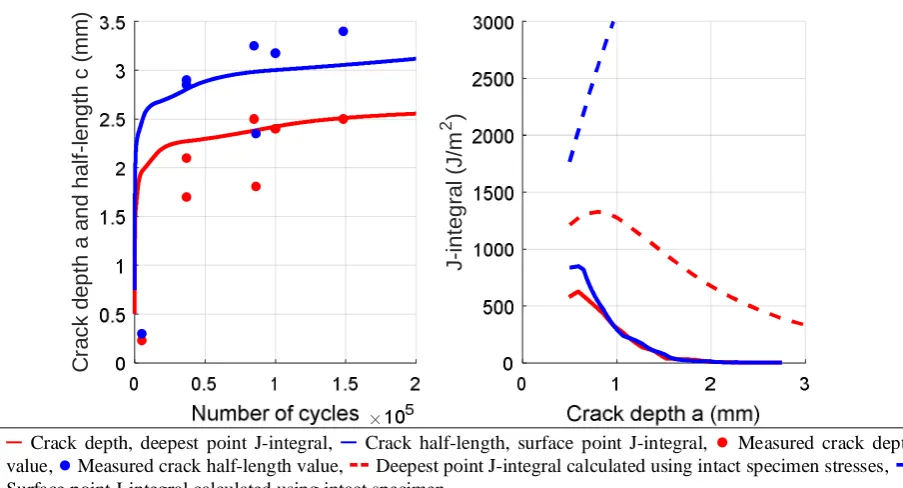
Figure 8. Left: crack depth and length as a function of cycles calculated in the crack growth assessment compared with experimental measurements. Right: J-integrals during crack growth compared the
corresponding results calculated using the uncracked stress distributions.
DISCUSSION
Figure 7 and 8 show that the crack opening and crack driving forces in the deepest point are the greatest at shallow crack depths. The opening angles at the surface point are at their maximum values when the crack is deep but short. A shallow crack thus prefers to grow in the depth direction and a deep crack prefers to grow in the length direction. The surface point crack driving force reduces significantly for the cases where the crack surface tip is outside of the heating area that is atc = 1.0 mm.
The initial crack aspect ratio was selected based on the value which it maintains for the first thousands of cycles. After this, the aspect ratio increases and the crack shape becomes more and more circular. This increase in the aspect ratio occurs shortly after the crack half-length has exceeded the extent of the heating area.
Figure 8 shows that crack propagation is rapid for small crack sizes. The crack quickly reaches the depth around 1.5 mm at which point the crack driving force value is relatively small and the crack growth rate diminishes significantly. It requires a large number of cycles to propagate the crack further as the crack driving force becomes even smaller as the growth progresses. The experimental data points show a similar trend to that obtained in the simulations.
The J-integrals obtained in the simulation models with the flaws included compared with the corresponding results using uncracked stresses show that the traditional approach overestimates the crack driving forces significantly (Figure 8). The trend in the deepest point J-integral is similar between the approaches but the surface point J-integral behaves differently. This is because that only the stress distributions taken from a line from the crack centre point in the through-thickness direction are considered when computing the stress intensity factor using the weight-function solutions. The stresses along the surface (along the crack length axis) rapidly decrease and the through-thickness stress distribution at the crack surface tip location is considerably smaller than that for the crack centre (see Figure 5 contour plots).
assessed to be due to the principle of elastic superposition utilized in the weight function formulation. The current results show that considerable plastic dissipation occurs in the crack location, most of which is not concentrated at the crack tip but caused by the severe thermal overload.
CONCLUSIONS
A thermal fatigue crack behaviour and growth analysis is presented. The key ingredient in the analysis is the determination of the J-integrals using a separately derived relation between the crack opening and J-integral.
It is found that the thermally induced crack propagates initially quickly, but the crack growth is halted shortly after that. The crack propagates towards a circular shape with the growth in the length direction (along the surface) is limited by the extent of the load area.
The simulated crack driving force results compared with the traditional weight function based results indicate that the weight function results exceed the simulated crack driving forces significantly and the crack driving force at the crack surface point (intersection with the free surface) behaves in a completely different manner than predicted by the simulations. This was identified to be caused by taking into consideration only the crack centre point through-thickness stress distribution and not the stresses acting on the crack surface point location. The simulated growth rates and final crack depths show are in agreement with the experimental findings. Final crack depths predicted by the uncracked stresses are in agreement with the experiments as the uncracked stress distributions turn compressive and halt the crack growth as the crack propagates into the compressive stress domain.
The current study is limited only to a single specimen consisting of uniform material under specified loads. Additional research on different materials, loadings and material types are required to confirm the findings and determine the limits when the superposition based approach can be utilized.
REFERENCES
Anderson, T.L. Fracture mechanics: fundamentals and applications (2005). CRC press.
ASME Boiler and Pressure Vessel Code, “Rules for Inservice Inspection of Nuclear Power Plant Components, Section XI, Division 1”, (2004). ASME, New York
ASME Boiler and Pressure Vessel Code, Section II - Materials. 2010 Edition. (2011). American Society of Mechanical Engineers.
ASTM E2472-06, Standard Test Method for Determination of Resistance to Stable Crack Extension under Low-Constraint Conditions (2006). ASTM International, West Conshohocken, PA
Crooker, P. and Rathbun, H. Weld Residual Stress Finite Element Analysis Validation Meeting. Introduction and Overview. 2011 June 14-15, Rockville, MD.
Fissolo, A., Amiable, S., Ancelet, O., Mermaz, F., Stelmaszyk, J.M., Constantinescu, A., Robertson, C., Vincent, L., Maillot, V., Bouchet, F. Crack initiation under thermal fatigue: An overview of CEA experience. Part I: Thermal fatigue appears to be more damaging than uniaxial isothermal fatigue (2009a). International Journal of Fatigue, 31 (3), pp. 587-600.
Fissolo, A., Gourdin, C., Ancelet, O., Amiable, S., Demassieux, A., Chapuliot, S., Haddar, N., Mermaz, F., Stelmaszyk, J.M., Constantinescu, A., Vincent, L., Maillot, V. Crack initiation under thermal fatigue: An overview of CEA experience. Part II (of II): Application of various criteria to biaxial thermal fatigue tests and a first proposal to improve the estimation of the thermal fatigue damage (2009b). International Journal of Fatigue, 31 (7), pp. 1196-1210.
Haddar, N., Fissolo, A. 2D simulation of the initiation and propagation of crack array under thermal fatigue (2005). Nuclear Engineering and Design, 235 (9), pp. 945-964.
Haddar, N., Fissolo, A., Maillot, V. Thermal fatigue crack networks: An computational study (2005). International Journal of Solids and Structures, 42 (2), pp. 771-788.
Lemaitre, J., and Chaboche, J.-L. Mechanics of Solid Materials (1990). Cambridge University Press. Paffumi, E., Nilsson, K.-F., Taylor, N.G. Simulation of thermal fatigue damage in a 316L model pipe