Uniformly Probable Design Response Spectra
Diniz de Almeida Andrtia 1), Roehl Jo~o Luis 1~
1) Pontificia Universidade Cat61ica- PUC, Rio de Janeiro, Brasil
ABSTRACT
In the seismic analysis of nuclear power plant structures a common practice is to prescribe a site dependent design response spectrum as the basic formulation of the ground motion to be applied to stmctmal system analyses. A complementary requirement on the amount and distribution of the seismic power, on the main interest frequency range of the problem, has been proposed through a target power spectral density.
One methodology based on non-exceeding probability computation of the design response spectrum ordinates obtained directly from the power spectral density functions is proposed to evaluate the existing compromise between these two functions and to develop uniformly probable design response spectra.
Applications are made on two pairs of function values and conclusions are oriented on the direction of the convenience to use the procedure to improve the consistency on the choice of target power spectral density functions and to generate uniformly probable design response spectra.
INTRODUCTION
In the seismic analysis of nuclear power plant (NPP) structures a common practice is to prescribe a site dependent design response spectrtma (DRS) as the basic formulation of the ground motion to be applied to the structural system analyses. As far as response spectrum analyses are used this definition should be enough.
However, if one wishes to develop a time history or a probabilistic analysis, this definition remains incomplete. In the former case, this happens because the generation of an accelerogram to match a response design spectrum to a given tolerance is not an unique solution problem and the resultant time histories may vary significantly; for the latter situation, because no information is given to reasonably characterize the site ground motion random process.
To overcome these difficulties the prescription of a target power spectrum density function (PSDT) has been adopted [2] given information about the total power of the ground motion process and its distribution along the frequency axis main interest region.
in a previous work [4], one proposes a methodology based on a random structural analysis technique to identify and to quantify in probabilistic terms the relation between these two functions, DRS and its PSDT. Sequentially, one shows also how to use this procedure to choose among a set of accelerograms, generated to match to a given tolerance a DRS, the one which most conveniently will envelop the DRS.
Now, one works on the idea of a uniformly probable response spectrum, i.e., its ordinates represent a barrier with equal probability not to be exceeded by the response of a single degree of freedom system (SDOF) excited at its base by ground motions belonging to a stationary random process defined by a PSDT function. In sequence, the idea is applied to criticize the fitness of DRS and PSDT function pairs.
The methodology is based on the systematic resolution of a first passage problem [3] in the back forward direction, in which the PSD of the one degree of freedom system response functions is computed as the multiplication of the similar ground motion function by the system frequency response squared modulus.
This computation formulation is implemented and applied, in the design context of a Brazilian NPP, to criticize two pairs of DRS and PSDr functions. The concepts of minimum (0.8 PSDT), target and 1.3 PSDT functions [2] are analyzed under the same point of view.
METHODOLOGY
I 1 --r 2 1
F ( r ) - - e -i- -exp
In the above:
r - the reduced response level, t - ground motion duration; Li- the i-th order spectral moment;
¢,
1 1 2 z ( - r E 1 ~/~
- ~ " 2 o o ' e X p - ~ • - e x p - •
r-
j),
1
a
/,, -- .____._
U0
2,, = yco~ea (¢o)dco
(1)
(2)
(3)
where a is the acceleration response level and o3 is the circular frequency. In this way, one may write:
• (co) = [n(co)l • (co)
(4)
in which, ~R~(O) is the response power spectral density, H(w) is the frequency response function of a base excited SDOF system and ~c~(o3) the ground motion acceleration PSD function.
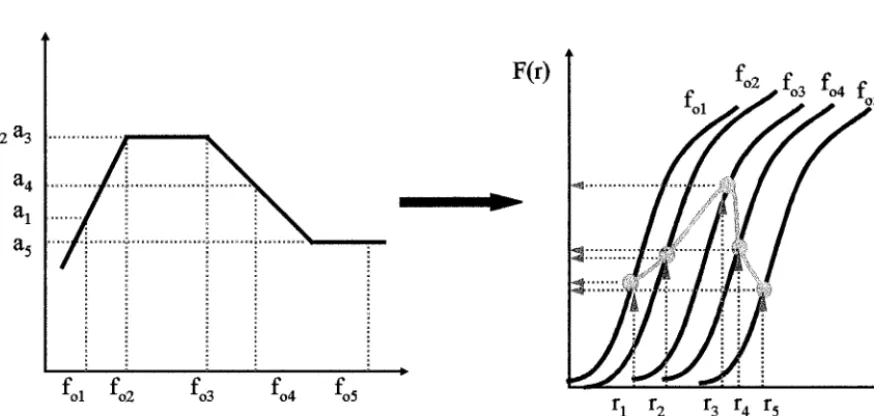
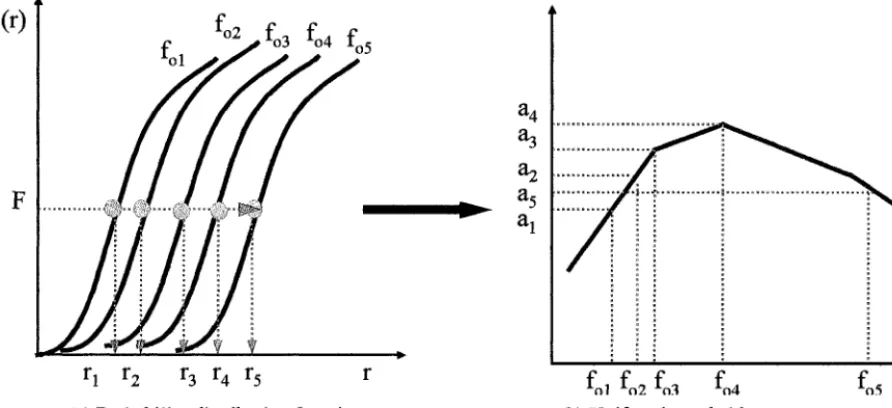
Naturally, the problem can be solved on the back forward direction, when one search for a reduced barrier level, r, starting from a given distribution probability, F(r). So working one may to determine a uniformly probable response spectra, i.e., its ordinates represent a barrier with equal probability of not to be exceeded by the response of a SDOF system excited at its base by ground motions proceeding from a stationary random process defined by a PSDr fimction. Figures (1) and (2) show computational procedure schematic views of these two situations.
a2 a 3
a4
al a5
, .. . . . , ~
fol G
fo3
fo4
fo5
- w
F(r)
fol
fo2 fo3 f o4 fo5
r I r 2 r 3 r 4 r 5 r
(a) Design response spectrum (b) Probability distribution functions
Figure I Computational procedure schematic view. Probability function of a SDOF system response function not to exceed a specified level
F
fol
fo2 fo3 fo4 fo5
r 1 r 2 r 3 r 4 r 5 r (a) Probability distribution function
m,.._
II
a4
a3
ae
a 5 al
il
r ' ' I P
fo,
fo,
(b) Uniformly probable response spectrum Figure 2 Computational procedure schematic view. Uniformly probable response spectrum
A P P L I C A T I O N
In the context of a Brazilian NPP design, the just described methodology is applied to a pair of sets, DRS-PSDT functions, to evaluated the existing probabilistic association in the set and to analyze them under the uniform probability point of view. The two examples are formed as follows:
• Example I: The 2% damped design response spectrum [ 1] and its target power spectrum density function [2], scaled to 1.0g, both recommended by USNRC.
• Example II: An alternative approach to a site dependent design response spectrum.
Tables 1 and 2 and Figures 3 and 4 show a comparative view of the four functions, two by two.
Table 1. Design response spectrum functions- Example I (USNRC) and H
fo (Hz) Example I Example H
Acceleration (m/s 2) Acceleration (m/s 2)
2.5 42.5 35.0
5.0 38.0 35.0
9.0 35.4 33.0
20.0 16.0 14.0
33.0 10.0 10.0
Table 2. Power spectrum density functions - Example I (USNRC) and H
fo 0-Iz)
2.5 5.0 9.0
Example I (m2/s 3) 4.17 x 10 1 1.20 x 10 "1 4.17 x 10 -2 1.25 x 10 -3
Example II (m2/s 3) 2.98 x 10 -1
1.09 x 10 -1
20.0
33.0 0.00 0.00
t'-,l
100.0
1 0 . 0
1 . 0
-
-~ U S N R C l
i ! !
! i
! ! ~ i i ! !
0.1 1.0 10.0 100.0
fo (Uz)
Figure 3 Design response spectrum f u n c t i o n s - Example I (USNRC) and H
1 . E + O 0
1 . E - O 1
1 . E - 0 2
¢q
e 1 . E - 0 3
1 . E - 0 4
1 . E - 0 5
i i i i i ~ I i i i i i i i L i ' i i i i i ~ ~ ! '
~
ternalave-USNRC
! ~ ~ Et i i i ~ ' i ~
i i i i i i i i i i I
H
0 . 1 1 . 0 1 0 . 0 1 0 0 . 0
f o(Hz)
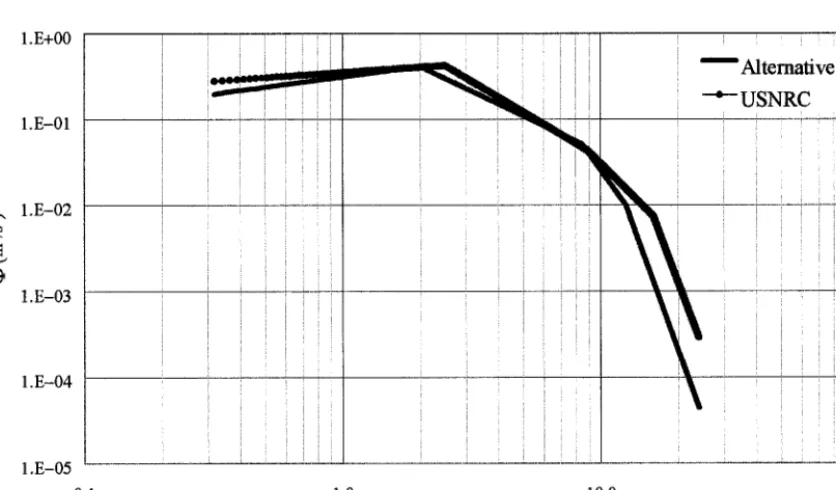
Figure 4 Power spectrum density functions - Example I (USNRC) and II
RESULTS AND DISCUSSION
system to a ground motion belonging to the trial-space defined by three PSDT levels
eo
Example I (USNRC)
0.8xPSDT .... PSDT 1.3xPSDT
0.5 0.52 0.39 0.26
. . . .
2.5 0.82 0.64 0.38
. . . .
5.0 . . . 0.83 . 0.57 0.23
9.0 0.93 0.73 0.31
20.0 . . . . 0.90 0.60 . . . . 0.11
33.0 , 0.45 0.10 0.0027
fo (HZ)
Example II (Alternative)
0.8xPSDT PsDT ..1.3xPSDT ..
0.5 0.34 0.23 0.14
2 . 5 0.743 0.53 .... 0.28 ...
5.0 0.78
, ,
0.88
0.5'1 . . . . 0.18 0.61
9.0 0.19 ....
20.0 0.99 0.94 0.65
33.0 , , 0.77 0.41 0.06
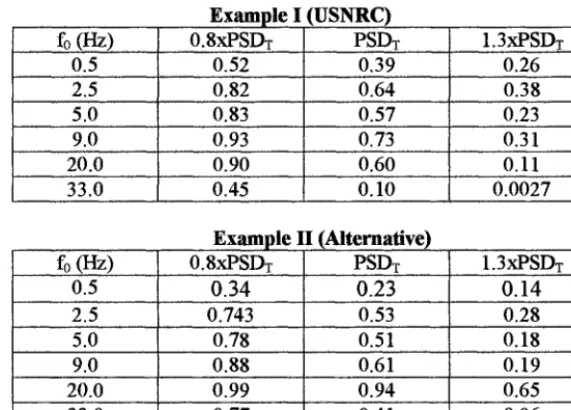
This makes it possible to analyze the compromise between the DRS and their associated PSDT. Tables 3 show that the probabilities of the DRS acceleration levels not to be exceeded by the response spectrum ordinates, produced by ground accelerograms belonging to the trial-space defined by the corresponding PSDT functions, vary along the main interest frequency band; from 0.57 to 0.73, in Example I, and from 0.51 to 0.94, in Example II. In all cases, the accelerogram duration is made equal to 15 seconds.
One also verifies, as it could be expected, that the power reduction from 1.3 to 0.8 PSDT produces a non-exceeding probability value increasing all over the frequency axes. The very low non-exceeding probability values at the (33.0 Hz - 1.3 PSDT) table comers confirm that on the very-high frequency region of the spectra the system acceleration values go to 1.0g with probability 1. Similar behavior occurs on the very-low frequency region where the system acceleration values tend to zero.
c , l
60.0
50.0 -~
40.0
30.0
20.0
10.0
o.o
! '
i
: !
- - z l r - - t a r g e t - 8 4 %
+ t a r g e t - 5 0 % - - - I I - - D R S
!
' : i :
0.0 5.0 10.0 15.0 20.0 25.0 30.0 35.0
f o (Hz)
Figure 5 Uniformly, 50% and 84%, probable response spectra and design response spectrum PSDT - Example I (USNRC)
Now, if one imagines a uniformly probable response spectrmn, the question is: Which non-exceeding probability value should be desirable?
region the uniformly probable spectra are asymptotic to abscissa values greater than 1.0g indicating, in general terms, that the PSDT has some power excess. The uniformly 50% probable spectrum is enveloped by the DRS and this one by its turn, is enveloped by the 84% specmnn. In this way, one can say that the DRS approaches a uniformly probable spectrum with non exceeding probability between 50 and 84%.
So, the answer to the question is a subject of the plant acceptability criterion. Naturally, this situation changes importance depending on the usage which is made of the PSDT function, if just to choose the more convenient accelerogram to employ in a time domain analysis or if one intends to develop directly a probabilistic analysis.
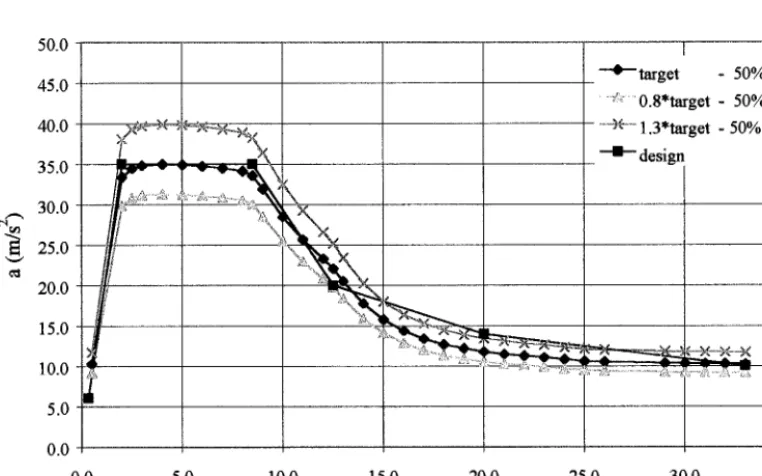
Finally, after that, uniformly 50% probable response spectra are computed for the same three PSDT levels, and compared with the prescribed DRS, Figures 6 and 7.
50.0 -
4 5 . 0 ~ , % ~
4 o o .
35.0 . . .
30.0 ! . . . ~.,,,,:~,~:,,~:-~~~
20.0 - 15.0 - 10.0 - 5.0- 0.0-
]
-'O--target - 50% ... ~A .... 0.8*target- 50% --N-- 1.3*target - 50% + d e s i g n
. . . .
0.0 5.0 10.0 15.0 20.0 25.0 30.0 35.0
fo (nz)
Figure 6 Uniformly 50% probable response spectra and prescribed IIRS - E x a m p l e I (USNRC)
50.0 ] 45.0 40.0 35.0 30.0 25.0 20.0 15.0 10.0 5.0 0.0
0.0
I
]- I ...O._target _ 50% I
. . . . ~>I!~,:,,,, 0.8*target - 50%
J/~'Y~'~: 4 ~~->'~Sg ' --t--3'-1.3*target - 50%
,- , ,, J design
r'i
~ ' , ,
, ,
5.0 10.0 1E0 20.0 25.0 30~0 35..0
f0 0-Iz)
response spectra with 50% non-exceeding probability, follow very closely the shapes of the respective DRS.
Figure 6 also shows
that,
in _general, the median uniformly probable response spectrum related to the 0.8 PSDT is enveloped by the DRS and the one made from a 1.3 PSDT envelops the DRS ordinates. For the full PSDT function, the median uniformly probable response spectra follows very closely the USNRC/DRS, except along the 2.0-15.0 Hz frequency band, where some more power would be necessary to make them even.Similarly in Example II, Figure 7 shows up that exists some lack of power on the frequency range from 14.0 to 33.0 Hz. To reduce this lack of power one may introduce a scale factor on the PSDT in such a way to get an optimized matching of the two curves~
CONCLUSION
The methodology using the design response spectrum ordinates as a barrier in the first passage problem solution can be used with advantage in the following situations regarding the compromise between a design response spectrum and its associated spectral density functions:
,, to choose among a set of ground motion time-histories, generated to match to a given tolerance a design response spectrum, the one which more conveniently approaches the target power spectral density function;
,, to criticize the compromise between a design response spectrum and its target power spectral density function and to recommend a way to adjust them;
,, to generate a uniformly probable design response spectrum associated to a given target power spectral density function of the ground motion and, in this way, to contribute in establishing the acceptability criteria in a structtwal probabilistic seismic analysis.
ACKNOLEDGMENTS
This study was partially sponsored by "Coordenaq~o de Aperfeiqoamento de Pessoal do Nivel Superior - CAPES" and by "Eletrobras Termonuclear S.A. - ELETRONUCLEAR" as a part of a joint research project of the last named organization with "Pontificia Universidade Cat61ica do Rio de Janeir0, PUC-Rio".
REFERENCES
1. USNRC, "Regulatoryguide 1.60: design response spectra for seismic design nuclearpowerplant. "" [S.1], (1973). 2. USNRC, "Standard review plan: office of reactor regulation", NUREG-0800, formally NUREG-75/087, [S.1],
(1989).
3. Vanmarcke, E.H., "On the distribution of the first-passage time for normal stationary random processes", Journal of Applied3/Iechanics, 42, 1975, pp. 215-220.