ABSTRACT
JIMENEZ MADRIGAL, JOSE PABLO. Tropical Pine Hybrid Verification using Single Nucleotide Polymorphisms (SNPs) Marker Technology: Case Studies and Applications to the Forestry Industry. (Under the direction of Gary R. Hodge and Ross W. Whetten).
Natural hybridization, and consequent introgression, is an essential evolutionary process contributing to the adaptive variation and speciation of living organisms. This source of variation is as important in forestry as it is in nature. The forest industry and tree breeding programs are always seeking improvement in growth rate, wood quality, pest resistance and overall yield. Selective breeding is the most common way to achieve it, but sometimes tree breeders go beyond the species boundaries to obtain special characteristics. These artificial hybrids can be successful if they either are vigorous and outperform their progenitors, particularly for growth traits, or show complementary traits that allow commercial forests to be grown in areas outside the normal productive range of the two parental species. Pine interspecific hybrids have been commercially deployed across a wide geographical range, however, due to phenotypic plasticity and the lack of well characterized diagnostic traits identification of hybrid individuals can be difficult.
Verification of true hybrid status becomes important for effective forestry operations, consequently the objective of the current research was to investigate the use of single
nucleotide polymorphism (SNP) markers as a cost effective method for the forest industry to accurately verify hybrid status on controlled crosses.
Tropical Pine Hybrid Verification using Single Nucleotide Polymorphisms (SNPs) Marker Technology: Case Studies and Applications to the Forestry Industry
by
Jose Pablo Jimenez Madrigal
A thesis submitted to the Graduate Faculty of North Carolina State University
in partial fulfillment of the requirements for the degree of
Master of Science
Forestry
Raleigh, North Carolina 2011
APPROVED BY:
_______________________________ ______________________________
Gary R. Hodge, Ph.D. Ross W. Whetten, Ph.D.
Committee Co-Chair Committee Co-Chair
DEDICATION
BIOGRAPHY
Jose P. Jimenez Madrigal was born in San Jose, Costa Rica. He attended the University of Costa Rica and graduated in 2005 with a Bachelor of Science degree in
Biology. During his undergraduate studies, he worked as a research assistant for the PIOSA program. This program is an inter-institutional effort to achieve a sustainable balance in the OSA and Golfo Dulce region of Costa Rica. In order to accomplish this, he worked testing molecular markers to study the tropical tree Peltogyne purpurea, an endangered species which is constantly exploited because of the commercial value of its wood.
As a result of his training in molecular genetics, after graduation, he started working in plant breeding and genetic improvement of potatoes, yams, cocoyam and manioc at the Centro de Investigaciones Agronomicas. During his time there he participated in the
molecular identification and definition of species boundaries for Costa Rican wild potatoes at UW-Madison under the supervision of Dr. David Spooner.
ACKNOWLEDGMENTS
I would like to express my appreciation to Dr. Gary R. Hodge and Dr. Ross W. Whetten for their guidance and support throughout my research. I would also like to thank committee member and Minor degree advisor Dr. Consuelo Arellano for her support and good suggestions.
I would like to acknowledge the help and guidance of Dr. Ted Shear and all the graduate students in his lab group. The advice and support in lab work from Saul Garcia, in addition to my friend and former mentor Federico Hernandez, who taught me the basic of genetics, ethics and laboratory work.
Special thanks to Camcore (International Tree Breeding and Conservation Program) and the Fulbright Program for Foreign Students, without their financial support this study would not been possible.
Lastly, I would like to thank fellow graduate students David Cerda, Funda Ogut, Luis Peña and Jaime Zapata for helping me with the experiments and sharing thoughts and
TABLE OF CONTENTS
LIST OF TABLES ... vi
LIST OF FIGURES ... vii
INTRODUCTION ... 1
Pine Hybrids... 4
Molecular Markers ... 9
The Camcore – FORBIRC Project ... 12
MATERIALS AND METHODS ... 16
Plant materials:... 16
DNA Extraction: ... 16
Genotyping:... 17
Data Analysis: ... 18
RESULTS ... 21
DISCUSSION ... 25
CONCLUSION ... 33
REFERENCES ... 35
TABLES ... 42
LIST OF TABLES
Table 1. Camcore-FORBIRC Project: genes identification and function………..42
Table 2. Single nucleotide polymorphisms (SNPs) potentially useful for hybrid verification………43
Table 3. Sequenom Mass ARRAY iPLEX assay design………...…46
Table 4. WASP & Primer 3 assay design………..47
Table 5. Verified hybrid crosses………48
LIST OF FIGURES
Figure 1. Approach 2 (WASP-Primer3) genotypes scoring………51 Figure 2. Comparison between the frequencies of crosses classified as true
INTRODUCTION
The genus Pinus (Pinaceae, naturally occurring and planted pine trees) is a group of approximately 110 species distributed almost exclusively throughout the Northern
Hemisphere, with close to 40% of the species in the world occurring in Mexico, Central America and the Caribbean. The genus consists of perennial, arborescent species, many of which attain great age and size (Farjon and Styles 1997).
Pines are ecologically important as a major component of many boreal, subalpine, temperate and tropical forests, and arid woodlands (Gernandt et.al. 2005), as well as active carbon sinks (Kolari et. al. 2004). Pines also provide suitable habitats for a wide range of organisms including insects, birds, parasitic angiosperms, and foliar fungi, along with being host in symbiotic relationship with mycorrhiza (Liston et. al. 1999). Economically, pines are an important source of wood, paper, resins, charcoal, food and ornamentals; and additionally recent studies have looked at the potential use of pines for biofuel production (Finell et. al. 2009, Eriksson and Gustavsson 2008). In the Southern United States almost 1 billion
loblolly pine (P. taeda) seedlings are planted annually (McKeand et. al. 2006). Species such as P. caribaea, P. patula, P. pinaster and P. radiata are cultivated worldwide (Gernandt et.al. 2005).
these characteristic features may help readily distinguish pines from other members of the family, classification within the genus is far more complicated. Several studies have tried to come up with an indisputable taxonomic and systematic classification of the genus, but so far none has come to a clear and conclusive result. Farjon and Styles (1997) have one
comprehensive review on the Mexican, Central American and Caribbean representatives of the genus; and is particularly important for the current research. Their classification is based mostly on morphological characters with special emphasis on leaves, cones, pollen, seeds and wood anatomy, but also includes biogeographical information as well as biochemical characters such as monoterpenes. However, there is much overlap in the quantitative traits between species descriptions, making classification difficult and ambiguous at times.
In 1999, Liston and collaborators published a study on phylogenetic relations in pines based solely on nuclear ribosomal DNA internal transcribed spacer (ITS) regions sequences. While their study did not include all species in the genus they did sample species
representing 16 subsections, and found significant differences in their gene tree compared to more traditional species trees based only on morphological features. Their results help illustrate the value of molecular data in phylogenetic and evolutionary studies.
(from 17 to 11 subsections). Despite the advances this study presents, the authors
acknowledge that several of the groups are not clearly delineated based on their knowledge of informative morphological characters in the genus and recommend additional work on the topic.
Recently, Kaundun and Lebreton (2010) followed this recommendation and revisited the taxonomy and systematics of the genus Pinus. Their approach involved the use of morphometrics, biogeographical and biochemical parameters. In this case their innovation was the use of flavonoids (plant polyphenolic compounds) as a diagnostic trait. Kaundun and Lebreton’s work is limited in scope (they sampled only 45 pine species), but still they managed to differentiate between ancestral and potentially derived taxa (e.g. the subgenus Strobus when compared to subgenus Pinus) based on the number of needles and the amount of O-methylated flavonols. Despite the fact that phenolic markers may fail to completely distinguish between closely related taxa, they do provide useful information to resolve section and subsection conflicts and should be considered as a valid trait in future studies.
As Syring et. al. (2005) best put it, despite all the progress, it seems that a
Pine Hybrids
The reason for the lack of agreement may be due to the continuous variation
displayed in several of its characters and the extensive worldwide distribution of the genus. Moreover, many species ranges overlap allowing for possible introgressive hybridization between two species, and a few examples of this common phenomenon will be described below:
Lanner (1974) described natural hybridization between P. edulis and P. monophylla in the American Southwest based only on morphological features (mainly needle count and number of leaf resin canals). From his data, Lanner concluded that hybridization between these species was widespread and far more common than expected. No areas were found where both species were sympatric in the absence of intermediate forms. Lanner goes as far as to question the distinct entity of P. edulis, calling it “an assortment of biotypes that comprise a narrow portion of the range of variability of hybridized and introgressed populations”.
Evidence of natural hybridization between P. attenuata and P. radiata dates back to the early 1930s, despite many distinct differences in their morphology, biochemical
New Zealand, where both parental species have been introduced and planted commercially (Bannister 1958).
Several reports of naturally occurring hybrids between loblolly pine (P. taeda) and shortleaf pine (P. echinata) date back as long as to the early 1950s. Nowadays, through molecular marker data analysis, introgression has been proved to be bidirectional between the two species, and in some cases is so strong as to question the long-term integrity of each species (Tauer et. al. 2007). A similar case was reported for sympatric populations of two Eurasian pine species P. sibirica and P. pumila; putative natural hybrids between the species were confirmed using allozymes. The authors could not determine for how many generations the crosses had occurred, nor could they provide insight into the level of introgression
between the species. Still, their study is the first to provide genetic evidence of natural hybridization between Siberian stone pine and dwarf Siberian pine (Politov et. al. 1999).
Just as the examples above, there are many more cases populating the scientific literature that illustrated the frequency and ease in which natural hybridization and
instances produce fertile hybrid progeny (“hybrid derivatives”), further complicating the classification of these intermediate forms.
Natural hybridization, and consequent introgression, is an essential evolutionary process contributing to the adaptive variation and speciation of living organisms (Mallet 2008). This source of variation is as important in forestry as it is in nature. The forest industry and tree breeding programs are always seeking improvement in growth rate, wood quality, pest resistance and overall yield. Selective breeding is the most common way to achieve it, but sometimes tree breeders go beyond the species boundaries to obtain special characteristics. These artificial hybrids can be successful if they either are vigorous and outperform their progenitors, particularly for growth traits, or show complementary traits that allow commercial forests to be grown in areas outside the normal productive range of the two parental species. Pine interspecific hybrids have been commercially deployed across a wide geographical range, including Australia, Korea, Brazil, and throughout Africa (Dungey 2001).
A successful and widely distributed pine hybrid is the cross of P. elliottii var. elliottii by P. caribaea var. hondurensis (hereafter referred to as PEE x PCH). In Queensland, Australia PEE x PCH hybrids have been planted since the year 1958. These trials
between both parental species, to satisfy the structural sawn timber market (Harding and Copley 2000).
One of the reasons for the success of the PEE x PCH hybrid is that it combines the initial vigorous growth of P. elliottii (early spring vigor and a winter dormant phase) with the uniform and longer growing season of P. caribaea, achieving appreciable winter growth. The only disadvantage reported for this hybrid was the low number of viable seed produced per cone and the difficulty in vegetative multiplication of hybrid seedlings; however, these problems have been overcome by the establishment, during the early 80’s, of F1 hybrid orchards. The boost in hybrid seed production allowed PEE x PCH commercial deployment, which by the year 2000 accounted for a plantation area of ca. 26 000 ha or 21% of the
lowland Pinus estate in Australia (Nikles 2000).
PEE x PCH hybrids have also been tested in several different sites in South Africa, where at higher altitudes (colder sites) P. caribaea alone is expected to fail due to frost sensitivity. Preliminary height and survival data, at two years of age, identified outstanding individual hybrid trees; however, performances seem to be site specific in the hybrid
families, evidence of genotype by environment interactions. Special attention must be made to site selection in order to maximize the effective use of this hybrid seed in colder
Other hybrids that have been tested in Australia are P. caribaea by P. oocarpa (PCH x POOC) and P. caribaea by P. tecunumanii (PCH x PTEC). The rationale for making these crosses was to combine the genetically improved characteristics of P. caribaea with the coppicing ability of P. oocarpa and the fast growth rates of P. tecunumanii; plus the
possibility that hybridization with P. caribaea may allow the extension of plantations with P. oocarpa or P. tecunumanii hybrid material to sites where the potential for wind damage (a problem for P. oocarpa in Queensland) and fluctuating water tables (a major deterrent for P. tecunumanii) may have restricted the use of the pure parental species. So far the results suggested that these hybrids had early growth rates superior to those of their parental species, increased resistance to wind damage and wood density similar to P. tecunumanii. Overall, PCH x PTEC seems the better of the two hybrids (Nikles, 2000; Dieters et. al. 1997).
A cross between Virginia pine (P. virginiana) and sand pine (P. clausa) was produced by the Institute of Forest Genetics in the 1950s. The hybrids grew faster, higher and with a greater diameter when compared to pure Virginia pines at age 10. They also produce a high seed set, a desirable feature for commercial deployment (Genys 1971).
volume response than loblolly, but retained certain sensitivity to winter damage (Groninger et. al. 2000). In a different study by Fox and Kreh (2003) it was shown that pitch x loblolly hybrids growth increased significantly following crown touching release, up to a
63%increase in diameter and a 9% increase in height, suggesting that this treatment could produce sawlog-size trees in a relatively short rotation. Overall, this hybrid has the potential for great productivity given the proper silvicultural treatment.
Molecular Markers
Due to phenotypic plasticity, pine hybrid performance is often dependent on
environment, and the lack of well characterized diagnostic traits makes the identification of hybrid individuals difficult. Verification of true hybrid status becomes important for
hybrid verification. Hence, the use of molecular markers to aid the verification process has been adopted.
The term genetic marker refers to any character for which alleles at an individual locus segregate in a Mendelian manner, this could be either visible traits or any other
assayable phenotype. Molecular markers are a type of genetic marker, specifically referring to enzyme expression or DNA based polymorphism (White et. al. 2007). Such molecular markers include allozymes, restriction fragment length polymorphism (RFLPs), random amplified polymorphic DNA (RAPDs), amplified fragment length polymorphism (AFLPs) and single sequence repeats (SSR also known as microsatellites), all of which have been successfully used to identify plus trees, study genetic diversity, establish phylogenetic relations and to certify true hybrids from controlled crosses (Xu et. al. 2008; Dvorak et. al. 2001; Politov et. al. 1999, Changtragoon 1998, Shurkhal et. al. 1992).
A new era of molecular markers began with the discovery of the polymerase chain reaction (PCR). RAPDs were the first molecular markers to be PCR-based. One of their main advantages is that no prior DNA sequence information is necessary for primer design. Small generic primers (10bp on average) bind randomly, depending on the primer sequence, to the template DNA. Since each primer can bind at different locations many different fragment sizes are generated, after PCR amplification a particular profile is formed.
Similarly to both RFLPs and RAPDs, AFLPs combines the PCR platform with surveying the genome for the presence of restriction fragment polymorphism. Furthermore, it seems to be more reliable (i.e. more repeatable than RAPDs). Finally, microsatellites are another highly informative marker system, which works by surveying short, tandem-repeated sequences of two to four nucleotides found throughout the entire genome. The number of tandem repeats at a given locus can vary greatly from individual to individual, making it a highly
polymorphic marker (White et. al. 2007). Comparative studies between RAPDs, AFLPs and microsatellites effectiveness showed the ability of RAPDs and AFLPs to detect minor intraspecific variation but pointed towards SSRs as the marker of choice for segregation studies and genome mapping (Belaj et. al. 2003).
Nonetheless, all of these types of markers present certain restrictions on the
smallest fragment size bands need to be excluded from analysis in order to ensure 100% reproducibility, excluding 15% of the same bands in RAPDs analysis also increases the repeatability, but not to the same extent (Bagley et. al. 2001).
In order to accurately verify hybrids between two closely related parental species, a high resolution marker is needed. Single nucleotide polymorphisms (SNPs) provide such resolution, since they represent an abundant form of genome variation. SNPs are mutations at a single nucleotide position, where each possible nucleotide represents a different allele. Such polymorphisms may consist of two, three and even four alleles however; triallelic and tetraallelic variants are extremely rare (Brookes 1999). These inherent characteristics (abundance, mutational stability and biallelic nature) make SNP markers amenable for high-throughput genotyping techniques and use in tree breeding studies (Zhang and Zhang 2005). In fact, Eckert and collaborators (2009) are already using SNP markers and high-throughput genotyping techniques in loblolly pine tree improvement programs in an effort to map wood quality, drought tolerance, and disease resistance candidate genes.
The Camcore – FORBIRC Project
confirm as true hybrids 6 out of the 48 crosses; however, it did not provide enough
information for the remaining crosses. Consequently the Camcore – FORBIRC project was started.
The purpose of this study was to determine species-specific molecular profiles based on recent pine tree DNA sequence information for commercially important pine species. For this reason pine consensus sequences were used to identify and select potential species-diagnostic SNP markers. These sequences comprise fragments from 10 different genes involved in drought stress response and wood synthesis (Table 1). The compiled consensus sequences, for all species involved in the hybrid crosses, are the work of former North Carolina State University (NCSU) graduate student George F. Khan (2010).
The resulting sequences were aligned and trimmed so that every individual sampled had a representative sequence and the consensus sequences were further edited personally by Khan, to include ambiguity codes to represent within-species variation. Finally, the
consensus sequences of each gene from each species were realigned and further trimmed so that there was representation throughout the alignment for every species, resulting in a total of 2988 base pair s (bp) with sequence length varying from 248 bp to 366 bp per gene for the different species. However, due to sequencing error or reaction failure, the number of
individual sequences varied per gene per species. The original intended number of
individuals sampled was 24 per gene per species; after trimming and realignment the average was 14 individuals per gene per species and dropped to as few as 4 individuals for certain genes in certain species.
Khan’s analysis of the sequence data showed significant levels of variation across the different genes and pointed to several SNPs that could be potentially used for species
1. The sequencing was done using PCR amplified gene products and single Sanger reads. Amplification of paralogous sequences or heterozygous sites can lead to poor sequence quality.
2. Since there was no method to distinguish errors introduced during the PCR reaction or the sequencing reaction, not enough confidence could be placed in a single sequence read as an accurate representation of an individual.
3. Differential gene amplification (some genes amplified better than others) resulted in variation in product yield making quantification of the samples very challenging. For example, in P. oocarpa sequences some of the genes are the consensus of 10 individuals sampled while other genes are the consensus of only 4 individuals sampled.
4. Finally, high heterozygosity in pine species makes SNP discovery difficult using this method.
Overall, Khan concluded that SNPs could be useful as a new class of molecular marker for tree improvement. Furthermore, SNPs can be a valuable marker technology in the selection and breeding of trees, although the level of information obtained depends on the number of genes analyzed and the level of genome coverage desired.
MATERIALS AND METHODS
Plant materials:
Putative hybrid seeds were obtained from Camcore (International Tree Breeding and Conservation Program) members. These seed lots were produced using a pollen mix of 5 to 10 males from one pine species crossed with 5 to 6 females from a different pine species. Tissue samples from the parental trees used in the crosses were unavailable. The bulk seed lots are the offspring of controlled crosses between the following pine species: Pinus taeda, P. elliottii, P. radiata, P. patula, P. tecunumanii, P. oocarpa, P. maximinoi, P. herrerae, P. caribaea var. hondurensis, P. pringlei, P. pseudostrobus, and both P. greggii var. australis and P. greggii var. greggii.
Seeds were stratified for 24 hours in distilled water followed by 3 weeks at 6°C for all crosses involving P. taeda parents, 2 weeks at 6°C for all crosses involving P. elliottii or P. radiata parents, and 24 hours at room temperature for the remaining crosses involving tropical pines species. Seeds were sown and harvested at one month of age. Young seedling tissues were collected and stored at -80°C for later DNA extraction.
DNA Extraction:
DNA was extracted using DNeasy 96 Plant Kit (Qiagen, Cat. No. 69181) and
Genotyping:
Pine consensus sequences from the Camcore – FORBIRC project were used to identify and select potential species diagnostic SNP markers (Table 2). Two approaches were tested for hybrid verification.
The first approach involves SNP genotyping using the Sequenom MassARRAY iPLEX platform. For this approach 12 SNPs were selected, each one diagnostic for a particular species (Table 3). The assay was designed with Sequenom Inc. proprietary software and was meant to run in a multiplex reaction, meaning that all markers were tested against every hybrid individual, resulting in a genotype profile specific for each hybrid cross. Sequenom MassARRAY iPLEX assay design and genotyping were outsourced to the
Sequenom Technology Core Center in Washington University in St. Louis.
which was increased to a final concentration of 3mM per reaction, and Thermo Prime Taq polymerase which was increased to a final concentration of 1.00 U per reaction. The thermo cycling program used was as follows: Initial denaturation: 95°C for 2 minutes, followed by 39 cycles: 95°C for 25 seconds, annealing temperature according to each primer pair (Table 4) for 35 seconds, 72°C for 65 seconds, followed by a final extension of 72°C for 5 minutes then hold at 10°C. The PCR and specific primers were set individually for each hybrid cross to be tested, based on alleged pollen parent. Results were visualized with UV light in a 1.8% agarose gel with ethidium bromide, loading dye and a 50bp molecular ladder (Promega, Cat. No. G4521). Genotypes were scored manually based on the presence or absence of the expected amplified fragment (for an example see Figure 1).
Data Analysis:
Since no genotype data from the parental trees used in the hybrid crosses was
available and the consensus sequences from the Camcore-FORBIRC Project were generated from the same seed sources and provenance as the parents used in the hybrid crosses, it was assumed that such sequences truly represent the gene frequencies in each species population. Also, given the natural interspecific crossability of pines, all individuals were treated as a single population and each species as a subpopulation for which a particular allele was fixed (e.g. out of 100 individuals, if 25 are from species X and species X is fixed for allele A1 while all other species and individuals are fixed for allele A2, then the overall allele
homozygotes for contrasting alleles, making any hybrid progeny a heterozygote for that particular locus. Since these were controlled crosses and the mother tree and species is known, true hybrid status was declared only when the obligatory parental allele from the pollen parent species was present in the progeny.
Base on this criteria, total number of hybrids per cross were quantified, proportion and 95% confidence intervals are provided. As well, Paternity index (L) calculations were performed for each hybrid cross tested, based on known allele frequencies from the
consensus sequences, for the diagnostic SNPs selected and genotyping results from the alleged hybrid progeny. Formulas for paternity calculations were used according to Weir (1996, p212). Since these were controlled crosses where the identity of both parents was known the prior probabilities were set to 0.5. Consequently, the paternity index statistics can be interpreted as follows:
1) Pr (E│C) = expresses how probable event E is when condition C holds. For this instance, it refers to both hybrid progeny and pollen parent sharing the same diagnostic allele (E) when this diagnostic allele was actually transmitted by the alleged pollen parent (C). Therefore it can be interpreted as the probability of a true hybrid identification based on the markers used.
individual in the population, or in our case any other species (Ĉ). Therefore it can be interpreted as the probability of a false positive result.
3) Paternity index (L) = the likelihood of each cross yielding a true hybrid progeny. L is the proportion of Pr (E│C) divided by Pr (E│Ĉ), so it can be interpreted as how many times is more likely that the hybrid showing the markers is a true hybrid versus a false positive.
RESULTS
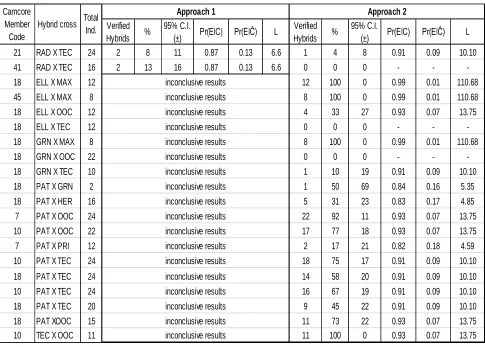
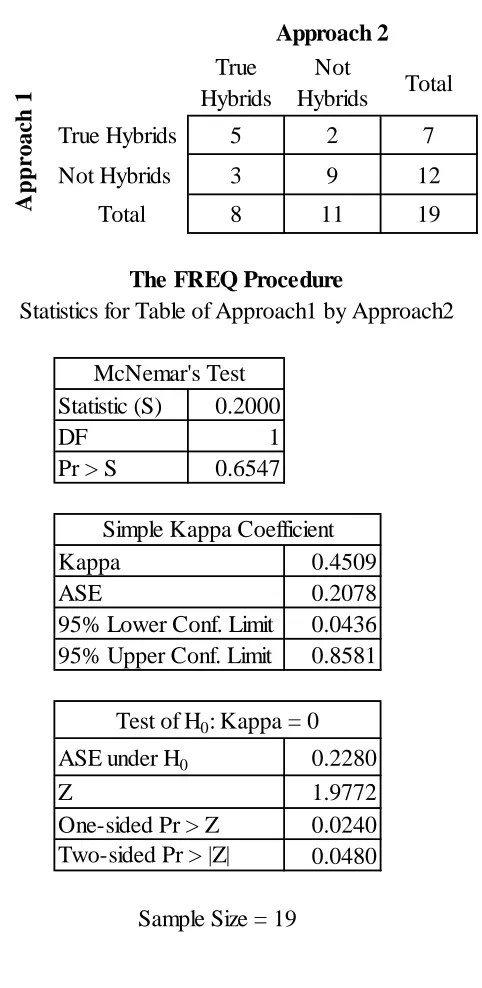
A total of 39 crosses from 9 different Camcore members were tested. Putative hybrid crosses, total number of individuals tested, percentage of hybrid seeds, confidence intervals and paternity index statistics for the two methodological approaches are summarized in Table 5. Moderate agreement between the two approaches was found (Kappa=0.4509, n=19), when comparing true hybrid status calls vs. not hybrids (Table 6).
Following the first approach (Sequenom MassARRAY iPLEX platform) out of the 39 putative hybrid crosses tested (with several seedlot per cross and several individuals per family representing each putative hybrid), 8 resulted in more than 50% individuals being confirmed as true hybrids. These verified hybrids include: P. elliottii x P. taeda, P. greggii var. australis x P. maximinoi; P. taeda x P. maximinoi, P. taeda x P. oocarpa, P.
tecunumanii x P. caribaea var. hondurensis, P. greggii var. australis x P. oocarpa, P. taeda x P. tecunumanii and P. maximinoi x P. pseudostrobus. From the remaining 31 crosses, 13 showed less than 50% hybrid individuals. The other 18 crosses did not amplify correctly or failed to provide conclusive information to determine hybrid status, despite the 99.7% genotyping accuracy claimed by the manufacturer.
“G” alleles. Similarly, 112_2649 was biased toward “C” alleles and 105_949 was biased towards “T” alleles. On the other hand, SNP marker 101_200 detected more heterozygotes than expected, showing heterozygotes even in crosses where both parents were homozygotes for the same allele. The inconsistencies made the information from these markers unreliable.
The remaining 4 SNP markers (105_717, 111_2444, 112_2691 and 113_2906) were able to resolve all crosses involving P. greggii var. australis, P. radiata, P. pseudostrobus, P. caribaea var. hondurensis or P. taeda with an average certainty of 85% and probability of false positive of 15%.
Following the second approach (WASP and Primer3 design) out of the same 39 putative hybrid crosses tested (with several seedlot per cross and several individuals per family representing each putative hybrid), 19 crosses resulted in more than 50% individuals being confirmed as true hybrids. These verified hybrids include: P. elliottii x P. taeda, P. greggii var. australis x P. maximinoi; P. taeda x P. maximinoi, P. taeda x P. oocarpa, P. tecunumanii x P. caribaea var. hondurensis, P. radiata x P. maximinoi, P. radiata x P. patula, P. radiata x P. pringlei, P. elliottii x P. maximinoi (from two different Camcore members), P. greggii var. greggii x P. maximinoi, P. patula x P. greggii var. greggii, P. patula x P. oocarpa (from two different Camcore members), P. patula x P. tecunumanii (both high and low elevation varieties, and from three different Camcore members) and P. tecunumanii x P. oocarpa.
determine hybrid status. The two cases of inconclusive results were due to failure from the P. pseudostrobus specific primers (Table 4, markers PH7, PH19 and PH20). In those two instances, P. maximinoi x P. pseudostrobus and P. radiata x P. pseudostrobus, the SNP markers amplified indiscriminately all samples as well as the positive and negative controls. Positive controls are usually samples of the pollen parent pure species DNA, while the negative control represent samples of the seed parent pure species DNA. A later test showed the lack of specificity from PH7 primer pair (Figure 3), despite having 13 SNPs allegedly specific for P. pseudostrobus within the 27 bases comprising the oligo sequence.
Since this second approach used more markers per hybrid cross tested the average certainty or true hybrid probability increased to 93% with only a 7% average probability of false positives.
For this study the average cost of DNA extraction and quantification was $2.68 per sample using commercially available kits. The genotyping cost was $4.15 per sample with the first approach (including 45% surcharge for Non-Washington University in Saint Louis (WUSTL) clients), and $2.20 per sample (testing two markers per sample in separate
DISCUSSION
Different results were obtained with the two genotyping approaches, mainly due to the high number of inconclusive results in the first approach (Figure 2). Although each approach used a different set of diagnostic SNPs, valuable information can be obtained from comparing and contrasting both methods. The following discussion will explore how each technique works and analyze their strengths and weaknesses.
The Sequenom MassARRAY iPLEX platform relies on the use of several site-specific PCR reactions, first with a locus-site-specific PCR reaction and second, with a SNP-specific primer extension reaction in which an oligonucleotide primer anneals upstream of the polymorphic site being genotyped. This results in two levels of specificity. The PCR and extension products are then incubated with mass-modified dideoxynucleotide terminators. The mass-modified oligo-tag added is tailored to the specific SNP desired, and is later detected by matrix-assisted laser desorption ionization time-of-flight (MALDI-TOF) mass spectrometry analysis (Gabriel et. al.2009).
Limitations like those discussed above may explain why some samples failed to provide conclusive information. Moreover, a recent communication by Sequenom, Inc. (April 2011) announced the release of MassARRAY® TYPER v4.0.22 software maintenance update, which promises to correct defects that could result in incorrect skew values being reported in the Genotype Area Report. It also corrects a defect which could result in a spectra quality assessment (rendering false negatives) and a correction to the peak detection algorithm has been implemented to allow for more sensitivity in the detection of low
frequency mutations. All of these modifications and corrections could potentially change the results from this study; however, this update was not available at the time the samples were analyzed.
Lastly, the assay design is restrictive, to say the least, since it requires 200 to 70bp of non-repetitive sequence flanking the SNP site for the locus specific primer design. In addition, 15 to 20bp of polymorphism-free sequence directly flanking the SNP site are necessary for annealing of the specific extension primer; rendering it practically impossible to use highly polymorphic cluster regions like the ones in gene 111 and 112 (Table 2), which are far more informative. Any deviation from these parameters results in assay failure and consequent rejection. Sequenom MassARRAY iPLEX assay design process failure and rejection happens on average in 10% of the SNPs selected, regardless of the data sources (i.e. human, plant or animal DNA sequence), according to the Sequenom Technology Core Center personnel and website information.
multiplex reaction and the results were visualized through agarose gel electrophoresis. Allele-specific primers are not a new tool in molecular biology studies. In fact, allele-specific primers have been use before successfully in tree breeding programs, but mostly for commercially important tree crops, i.e. sweet cherry, almond, and apples, among others (Sonneveld et. al. 2003; Tamura et. al. 2000; Janssens et. al. 1995). What is new about this approach is the use of the WASP software for assay design. The WASP technique is based on the extension of the primer only when the 3’-end is a perfect complement to the allele present in the target sample. If the desired SNP is present, the genotyping results can be observed by comparing the length of the PCR products (wild type vs. mutant variant), or the simple fact that the amplification occurred can be taken as proof of the SNP presence. Furthermore, WASP increases the specificity of the primer by creating a mismatch on the penultimate base on the allele-specific primer (Wangkumhang et. al. 2007).
One advantage of this method is the freedom to select an allele-specific locus and the amount of SNP variants encompassed within each primer. For instance, while the WASP design relies on the SNP being located at the 3’-end followed by the mismatch base, there is no restriction against other SNPs forming part of the oligo sequence; in fact this only
increases throughout the amplification reaction and is directly proportional to the product produced (Bowyer 2007).
On the downside, time consuming optimization steps are necessary to find proper temperature profiles, buffer conditions, and sequence composition of the diagnostic SNP-bearing primer strands. This applies to both standard PCR and RT-PCR procedures. Incorrect annealing temperatures and overall lack of proper optimization may explain why some of the markers tested consistently failed to amplified the desire product or conversely, why sometimes they amplified every sample without discriminating. In addition, DNA quality and quantity play a crucial role in the success of the PCR amplification. Special attention must be given to the source material; young seedling tissues yield better quality DNA than dried mature needles (data not shown). This is another factor that may influence the results in both platforms, i.e. Sequenom and WASP approaches.
Based on its low cost, approach 2 (WASP and Primer3 design) can be used to test the effectiveness of the markers. Once a panel of species-specific markers has been identified, for all the commercially important species, it could be implemented in the Sequenom MassARRAY iPLEX platform for high-throughput genotyping. This will allow testing seedling where not only the actual parental trees are unknown but the species involved in the cross are also unidentified, i.e. pollen contamination cases, natural hybridization and hybrid controlled crosses.
identification but they are not fail-proof either, and can generate ambiguous results. Just as with morphological characters, a species or taxon may share molecular markers with related taxa due to the joint retention of alleles following speciation in a polymorphic ancestor, a concept known in cladistics and systematic studies as symplesiomorphy. Hence, it is easier to reject the possibility of a hybrid than to confirm it with molecular data sets (Rieseberg 1997). This can be accounted for by increasing the number of loci genotyped. The more SNPs that are surveyed per individual, the less likely that the results observed are due to common ancestry and more to a potential hybridization event. Still, a major factor
determining the validity of the results is the quality of the consensus sequences used, both in terms of their ability to capture the true genetic diversity within each pine species and in terms of sequencing errors.
isozymes variation, not other markers such as SNPs, the results are a useful guideline. However, not to be taken literally since a SNP by definition is a polymorphism with the minor allele frequency being 1% or greater (Su et. al. 2007), leaving enough room still to escape the initial screening.
The possibility of different allele frequencies in the population, and more importantly the possibility that some of the SNP surveyed were not homozygous as initially believed, may explain some of the discrepancies seen in the results. This possibility was the main motivation to select a different set of SNPs to be tested with the second approach, in particular for the case of SNP marker 101_200 (Approach 1 - Sequenom), which yielded more heterozygous genotypes than expected. Provided that the Sequenom MassARRAY iPLEX platform has an accuracy of 99.7%, as claimed by the manufacturer, the simplest explanation for this result would be that there is greater allele diversity at that locus than expected based on Khan’s results. Future studies could account for this uncertainty by including DNA from the actual parental trees used in each cross tested, to serve as a baseline control.
superimposed onto each other. Consequently, this results in a phase shift where all base calls following the indel may be consider a variant or SNPs. Such may be the case with the PH7 marker. The primer was designed from a highly polymorphic region within the sequence of gene 111 from P. pseudostrobus and was expected to be extremely allele-specific; however, it failed to discriminate between different species, bring into question the accuracy of the original consensus sequence. Computational tools are available that can reconstruct correctly and unambiguously the sequences, solving the issue (Dmitriev and Rakitov 2008).
In both cases, i.e. flawed allele frequencies and sequencing errors, the worst case scenario would be an increase in false positives leading to overestimation of the amount of hybrid crosses, a mistake that cannot be noticed until alleged hybrid seeds are deployed, grown and phenotypes evaluated several years in the future. This negative outcome could be easily overcome by revisiting the consensus sequences and increasing the sample size. As sequencing technologies continue to evolve, time and cost will decrease, making it an achievable goal in the near future.
Finally, based on the results of this study and the consensus of both approaches tested, I report the first confirmed pine hybrid progeny of P. greggii var. australis x P. maximinoi and P. taeda x P. maximinoi crosses. To the author’s knowledge there are no prior records in the literature of these two precise crosses. These hybrids will most likely benefit from the fast growth rate, short reproductive cycle, pest resistance and excellent wood quality of P. maximinoi, while ameliorating its less desirable traits, such as frost
Another interesting report, though not confirmed by consensus (i.e. both approaches) but with strong support from the WASP-Primer3 markers, was the verified hybrids from P. radiata x P. maximinoi. The two species are distantly related, phylogenetically speaking, with P. radiata in the Australes subsection and P. maximinoi in the Ponderosae subsection (Gernandt et. al. 2005). This hybrid cross has been attempted in the past by forestry
CONCLUSION
The goal of this study was to explore the utility of SNP markers to elucidate difference between putative hybrids and to develop a cost effective method for the forest industry to accurately verify hybrid status of controlled crosses. The findings suggest that SNP markers provide a reliable source of information to solve hybrid identity issues. Additionally, since the SNP marker selection was based on data from the entire geographic distribution of each species populations, no prior knowledge of the actual parental trees in each cross in needed. This is especially convenient when the identity of the pollen parent is unknown or hard to ascertain, i.e. pollen mixes or open pollination.
REFERENCES
Bagley, M.J., S.L. Anderson and B. May. 2001. Choice of methodology for assessing genetic impacts of environmental stressors: Polymorphism and reproducibility of RAPD and ALFP fingerprints. Ecotoxicology, 10: 239-244.
Bannister, M.H. 1958. Evidence of hybridization between Pinus attenuata and P. radiata in New Zealand. Transactions of the Royal Society of New Zealand, 85(2): 217-225.
Belaj, A., Z. Satovic, G. Cipriani, L. Baldoni, R. Testolin, L. Rallo and I. Trujillo. 2003. Comparative study of the discriminating capacity of RAPD, AFLP and SSR markers and their effectiveness in establishing genetic relationships in olive. Theor. Appl. Genet., 107: 736-744.
Bowyer, V.L. 2007. Real-Time PCR. Forensic Sci.Med. Pathol., 3(1): 61-63.
Brookes, A.J. 1999. The essence of SNPs. Gene 234: 177-186.
Changtragoon, S. 1998. Application of molecular markers in forest trees for developing countries. In: Proc. Inter. Workshop BIO-REFOR, Manila, 111-114pp.
Dieters, M.J., D.G. Nikles, P.G. Toon and P. Pomroy. 1997. Genetic parameters of F1 hybrids of Pinus caribaea var. hondurensis with both Pinus oocarpa and Pinus tecunumanii. Can. J. For. Res., 27: 1024-1031.
Dmitriev, D.A. and R.A. Rakitov. 2008. Decoding of superimposed traces produced by direct sequencing of heterozygous indels. PLoS Comput Biol, 4(7): e1000113.
Dvorak, W.S., J.L. Hamrick and G.R. Hodge. 1999. Assessing the sampling efficiency of ex situ gene conservation efforts in natural pine populations in Central America. Forest Genetics, 6(1): 21-28.
Dvorak, W. S., Gutierrez, E. A., Gapare, W. J., Hodge, G. R., Osorio, L. F., Bester, C., & Kikuti, P. (2000). Pinus maximinoi. In Conservation and testing of tropical and subtropical forest tree species by the CAMCORE Cooperative. (pp. 106). Botha Hill, South Africa : Grow Graphics.
Dvorak, W.S., A.P. Jordan, J.L. Romero, G.R. Hodge and B.J. Furman. 2001. Quantifying the geographic range of Pinus patula var. longipedunculata in Southern Mexico using morphological and RAPD marker data. Southern African Forestry Journal, 192: 19-30.
Eckert, A.J., B. Pande, E.S. Ersoz, M.H. Wright, V.K. Rashbrook, C.M. Nicolet and D.B. Neale. 2009. High-throughput genotyping and mapping of single nucleotide
polymorphisms in loblolly pine (Pinus taeda L.). Tree Genetics & Genomes, 5: 225-234.
Edwards, J.R., H. Ruparel and J. Ju. 2005. Mass-spectrometry DNA sequencing. Mutation Research, 573: 3-12.
Eriksson, L.N. and L. Gustavsson. 2008. Biofuels from stumps and small roundwood – Costs and CO2 benefits. Biomass and Bioenergy, 32: 987-902.
Farjon, A. and B.T. Styles. 1997. Pinus (Pinaceae). Flora Neotropica Monograph 75. New York Botanical Garden, New York, pp. 1-291.
Finell, M., M. Arshadi, R. Gref, T. Scherzer, W. Knolle and T. Lestander. 2009.
Laboratory-scale production of biofuel pellets from electron beam treated Scots pine (Pinus silvestris L.) sawdust. Radiation Physics and Chemistry, 78: 281-287.
Gabriel, S., L. Ziaugra and D. Tabbaa. 2009. SNP genotyping using the Sequenom MassARRAY iPLEX platform. Current Protocols in Human Genetics, 2.12.1-2.12.18.
Genys, J.B. 1971. Hybrids of Virginia Pine X Sand Pine, Pinus virginiana x clausa, in Maryland. Coastal and Estuarine Research Federation, 12(3): 188-191.
Gernandt, D.S., G. Geada-Lopez, S. Ortiz-Garcia and A. Liston. 2005. Phylogeny and classification of Pinus. Taxon, 54(1): 29-42.
Groninger, J.W., S. M. Zedaker, A. D. Barnes and P. Feret. 2000. Pitch x loblolly hybrid response to competition control and associated ice damage. Forest Ecology and Management, 127: 87-92.
Harding, K. J. and T.R. Copley. 2000. Wood property variation in Queensland-grown Slash x Caribbean pine hybrids. In: Proceedings of QFRI/CRC-SPF Symposium on Hybrid Breeding and Genetics, 9-14 April 2000, Noosa, Queensland, Australia.
Hill, F., C.Germund, V. Benes, W. Ansorge and T.J. Gibson. 2000. An estimate of large-scale sequencing accuracy. EMBO Reports, 1(1): 29-31.
Ito, M., Y. Suyama, T.A. Ohsawa and Y. Watano. 2008. Airborne-pollen pool and mating pattern in a hybrid zone between Pinus pumila and P. parviflora var. pentaphylla. Mol. Ecol., 17:5092-5103.
Janssens, G.A., I.J. Goderis, W.F. Broekaert and W. Broothaerts. 1995. A molecular method for S-allele identification in apple based on allele-specific PCR. Theor. Appl. Genet., 91: 691-698.
Jimenez, J.P., A. Brenes, D. Fajardo, A. Salas and D.M. Spooner. 2007. The use and limits of AFLP data in the taxonomy of polyploid wild potato species in Solanum series Conicibaccata. Conserv Genet, 9(2): 381-387.
Kaundun, S.S. and P. Lebreton. 2010. Taxonomy and systematics of the genus Pinus based on morphological, biogeographical and biochemical characters. Plan Syst Evol, 248: 1-15.
Khan, G.F. 2010. Single Nucleotide Polymorphism Discovery in Pines (Pinus) Species for Hybrid Analysis (Master Thesis). Available from NC State Theses and Dissertations database (URI: http://www.lib.ncsu.edu/resolver/1840.16/6086 )
Kolari, P., J. Pumpanen, U. Rannik, H. Ilvesnieme, P. Hari and F. Berninger. 2004. Carbon balance of different aged Scots pine forest in Southern Finland. Global Change Biology, 10: 1106-1119.
Lanner, R.M. 1974. Natural Hybridization between Pinus edulis and Pinus monophylla in the American Southwest. Silvae Genetica, 23(4): 108-116.
Lanner, R.M. and A.M. Phillips. 1992. Natural hybridization and introgression of pinyon pines in Northwestern Arizona. Int. J. Plant Sci., 153(3): 250-257.
Liston, A., W.A. Robinson, D. Piñero and E.R. Alvarez-Buylla. 1999. Phylogenetics of Pinus (Pinaceae) based on nuclear ribosomal DNA internal transcribed spacer region sequences. Mol. Phylogenet. Evol., 11(1): 95-109.
Mallet, J. 2008. Hybridization, ecological races and the nature of species: empirical evidence for the ease of speciation. Phil. Trans. R. Soc. B, 363: 2971-2986.
Nikles, D.G. (2000). Experience with some Pinus hybrids in Queensland, Australia. In: Proceedings of QFRI/CRC-SPF Symposium on Hybrid Breeding and Genetics, 9-14 April 2000, Noosa, Queensland, Australia.
Panetsos, C.P. 1975. Natural hybridization between Pinus halepensis and Pinus brutia in Greece. Silvae Genetica, 24(5-6): 163-168.
Panetsos, K., A. Scaltsoyiannes, F.A. Aravanopoulos, K. Dounavi and A. Demetrakopoulos. 1997. Identification of Pinus brutia Ten., P. halepensis Mill. and their putative hybrids. Silvae Genetica, 46(5): 253-257.
Politov, D.V., M.M. Belokon, O.P. Maluchenko, Y.S. Belokon, V.N. Molozhnikov, L.E. Mejnartowicz and K.V. Krustovskii. 1999. Genetic evidence of natural hybridization between Siberian stone pine, Pinus sibirica Du Tour, and dwarf Siberian pine, P. pumila (Pall.) Regel. Forest Genetics 6(1): 41-48.
Rieseberg, L.H. 1997. Hybrid origins of plant species. Annu. Rev. Ecol. Syst., 28: 359-389.
Rozen, S. and H. J. Skaletsky. 2000. Primer3 on the WWW for general users and for biologist programmers. In: Krawetz S, Misener S (eds) Bioinformatics Methods and Protocols: Methods in Molecular Biology. Humana Press, Totowa, NJ, pp. 365-386
Shurkhal, A., A. Podogas and L. Zhivotovsky. 1992. Allozyme differentiation in the genus Pinus. Silvae Genetica, 41(2): 105-109.
Slee, M. U. 1972. Growth patterns of Slash and Caribbean pine and their hybrids in Queensland. Euphytica, 21: 129-142.
Su, S.-C., C.-C. Jay Kou and T. Chen. 2007. Single nucleotide polymorphism data analysis: state-of-the-art review on this emerging field from a signal processing viewpoint. IEEE Signal Processing Magazine, 24(1): 75-82.
Syring, J., A. Willyard, R. Cronn and A. Liston. 2005. Evolutionary relationships among Pinus (Pinaceae) subsections inferred from multiple low-copy nuclear loci. Am. J. Bot., 92(12): 2086-2100.
Tamura, M., K. Ushijima, H. Sassa, H. Hirano, R. Tao, T.M. Gradziel and A.M. Dandekar. 2000. Identification of self-incompatibility genotypes of almond by allele-specific PCR analysis. Theor. Appl. Genet., 101: 344-349.
Tauer, C.G., S. Xu, C.D. Nelson and J.M. Guldin. 2007. Shortleaf pine: a species at risk? In: Kabrick, John M.; Dey, Daniel C.; Gwaze, David (eds). Shortleaf pine restoration and ecology in the Ozarks: proceedings of a symposium; 2006 November 7-9; Springfield, MO. Gen. Tech. Rep. NRS-P-15. Newtown Square, PA: U.S. Department of Agriculture, Forest Service, Northern Research Station: 68-75.
Wangkumhang, P., K. Chaichoompu, C. Ngamphiw, U. Ruangrit, J. Chanprasert, A. Assawamakin and S. Tongsima. 2007. WASP: a web based allele specific PCR assay designing tool for detecting SNPs and mutations. BMC Genomics, 8:275.
Weir, B.S. 1996. Genetic Data Analysis II. Sinauer Associates, Inc. Publishers; Sunderland, Massachusetts, pp445.
White, T.L., W.T. Adams and D. B. Neale. 2007. Forest Genetics. CABI Publishing. Oxfordshire, UK. 682 pp.
Wright, J.A., M.J.P. Shaw and W. Hadebe. 1991. Genotype x environment interaction in pine hybrid families at four sites in South Africa. Forest Ecology and Management, 40: 93-99.
Zhang, D. and Z. Zhang. 2005. Single nucleotide polymorphism (SNPs) discovery and linkage disequilibrium (LD) in forest trees. Forestry Studies in China, 7(3): 1-14.
TABLES
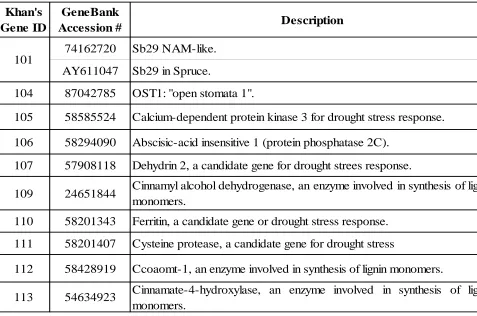
Table 1: Camcore-FORBIRC Project: genes identification and function (Modified from Khan 2010).
Khan's Gene ID
GeneBank
Accession # Description
74162720 Sb29 NAM-like.
AY611047 Sb29 in Spruce.
104 87042785 OST1: "open stomata 1".
105 58585524 Calcium-dependent protein kinase 3 for drought stress response.
106 58294090 Abscisic-acid insensitive 1 (protein phosphatase 2C).
107 57908118 Dehydrin 2, a candidate gene for drought strees response.
109 24651844 Cinnamyl alcohol dehydrogenase, an enzyme involved in synthesis of lignin monomers.
110 58201343 Ferritin, a candidate gene or drought stress response.
111 58201407 Cysteine protease, a candidate gene for drought stress
112 58428919 Ccoaomt-1, an enzyme involved in synthesis of lignin monomers.
113 54634923 Cinnamate-4-hydroxylase, an enzyme involved in synthesis of lignin monomers.
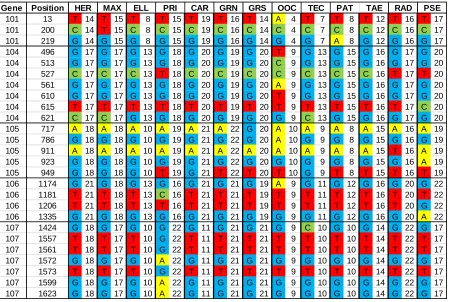
Table 2: Single nucleotide polymorphisms (SNPs) potentially useful for hybrid verification. SNPs were identified from Khan (2010) consensus sequences data. Putative SNPs are
ordered by gene, bases are followed by the number of individuals used for the consensus base call. Ambiguous base calls and potential indel mutations are omitted. Species codes are as follow: Pinus taeda (TAE), P. elliottii (ELL), P. radiata (RAD), P. patula (PAT), P. tecunumanii (TEC), P. oocarpa (OOC), P. maximinoi (MAX), P. herrerae (HER), P.
caribaea var. hondurensis (CAR), P. pringlei (PRI), P. pseudostrobus (PSE), P. greggii var. australis (GRS) and P. greggii var. greggii (GRN).
Gene Position
101 13 T 14 T 15 T 8 T 15 T 19 T 16 T 14 A 4 T 7 T 8 T 12 T 16 T 17 101 200 C 14 T 15 C 8 C 15 C 19 C 16 C 14 C 4 C 7 C 8 C 12 C 16 C 17 101 219 G 14 G 15 G 8 G 15 G 19 G 16 G 14 G 4 G 7 A 8 G 12 G 16 G 17 104 496 G 17 G 17 G 13 G 18 G 20 G 19 G 20 T 9 G 13 G 15 G 16 G 17 G 20 104 513 G 17 G 17 G 13 G 18 G 20 G 19 G 20 C 9 G 13 G 15 G 16 G 17 G 20 104 527 C 17 C 17 C 13 T 18 C 20 C 19 C 20 C 9 C 13 C 15 C 16 T 17 T 20 104 561 G 17 G 17 G 13 G 18 G 20 G 19 G 20 A 9 G 13 G 15 G 16 G 17 G 20 104 610 G 17 G 17 G 13 G 18 G 20 G 19 G 20 T 9 G 13 G 15 G 16 G 17 G 20 104 615 T 17 T 17 T 13 T 18 T 20 T 19 T 20 T 9 T 13 T 15 T 16 T 17 C 20 104 621 C 17 C 17 G 13 G 18 G 20 G 19 G 20 G 9 C 13 G 15 G 16 G 17 G 20 105 717 A 18 A 18 A 10 A 19 A 21 A 22 G 20 A 10 A 9 A 8 A 15 A 16 A 19 105 786 G 18 G 18 G 10 G 19 G 21 G 22 G 20 A 10 G 9 G 8 G 15 G 16 G 19 105 911 A 18 A 18 A 10 A 19 A 21 A 22 A 20 A 10 A 9 A 8 A 15 T 16 A 19 105 923 G 18 G 18 G 10 G 19 G 21 G 22 G 20 G 10 G 9 G 8 G 15 G 16 A 19 105 949 G 18 G 18 G 10 T 19 G 21 T 22 T 20 T 10 G 9 T 8 T 15 T 16 T 19 106 1174 G 21 G 18 G 13 G 16 G 21 G 21 G 19 A 9 G 11 G 12 G 16 G 20 G 22 106 1181 T 21 T 18 T 13 C 16 T 21 T 21 T 19 T 9 T 11 T 12 T 16 T 20 T 22 106 1206 T 21 T 18 T 13 T 16 T 21 T 21 T 19 T 9 T 11 T 12 T 16 T 20 G 22 106 1335 G 21 G 18 G 13 G 16 G 21 G 21 G 19 G 9 G 11 G 12 G 16 G 20 A 22 107 1424 G 18 G 17 G 10 G 22 G 11 G 21 G 21 G 9 C 10 G 10 G 14 G 22 G 17 107 1557 T 18 T 17 T 10 G 22 T 11 T 21 T 21 T 9 T 10 T 10 T 14 T 22 T 17 107 1561 T 18 T 17 T 10 G 22 T 11 T 21 T 21 T 9 T 10 T 10 T 14 T 22 T 17 107 1572 G 18 G 17 G 10 A 22 G 11 G 21 G 21 G 9 G 10 G 10 G 14 G 22 G 17 107 1573 T 18 T 17 T 10 G 22 T 11 T 21 T 21 T 9 T 10 T 10 T 14 T 22 T 17 107 1599 G 18 G 17 G 10 A 22 G 11 G 21 G 21 G 9 G 10 G 10 G 14 G 22 G 17 107 1623 G 18 G 17 G 10 A 22 G 11 G 21 G 21 G 9 G 10 G 10 G 14 G 22 G 17
RAD PSE GRS OOC TEC PAT TAE
Table 2: Continued. Gene Position
110 2036 A 10 A 6 A 7 A 8 A 10 A 11 A 10 A 8 A 7 A 11 A 19 G 15 A 15 110 2037 G 10 T 6 G 7 G 8 G 10 G 11 G 10 G 8 G 7 G 11 G 19 G 15 G 15 110 2048 C 10 T 6 C 7 C 8 C 10 C 11 C 10 C 8 C 7 C 11 C 19 C 15 C 15 110 2059 A 10 G 6 G 7 G 8 G 10 G 11 G 10 A 8 A 7 G 11 G 19 G 15 G 15 110 2067 T 10 A 6 T 7 T 8 T 10 T 11 T 10 T 8 T 7 T 11 T 19 T 15 T 15 110 2072 T 10 T 6 T 7 A 8 T 10 T 11 T 10 T 8 T 7 T 11 T 19 T 15 T 15 110 2098 A 10 G 6 A 7 A 8 A 10 A 11 A 10 A 8 A 7 A 11 A 19 A 15 A 15 110 2101 G 10 A 6 G 7 G 8 G 10 G 11 G 10 G 8 G 7 G 11 G 19 G 15 G 15 110 2109 C 10 T 6 T 7 T 8 T 10 T 11 T 10 C 8 C 7 T 11 T 19 T 15 T 15 110 2115 G 10 C 6 G 7 G 8 G 10 G 11 G 10 G 8 G 7 G 11 G 19 G 15 G 15 110 2139 A 10 T 6 A 7 A 8 A 10 A 11 A 10 A 8 A 7 A 11 A 19 A 15 A 15 110 2151 G 10 G 6 G 7 G 8 G 10 G 11 G 10 G 8 G 7 G 11 G 19 G 15 C 15 110 2185 C 10 C 6 C 7 C 8 C 10 C 11 C 10 C 8 C 7 C 11 C 19 C 15 T 15 110 2227 A 10 A 6 A 7 A 8 A 10 A 11 A 10 A 8 A 7 C 11 A 19 A 15 A 15 111 2260 C 17 C 13 C 9 C 17 C 19 C 17 C 14 C 7 C 11 C 6 C 12 C 20 T 23 111 2284 A 17 A 13 A 9 A 17 A 19 A 17 A 14 A 7 A 11 A 6 A 12 A 20 T 23 111 2287 T 17 T 13 T 9 T 17 T 19 T 17 T 14 T 7 T 11 T 6 T 12 T 20 G 23 111 2289 G 17 G 13 G 9 G 17 G 19 G 17 G 14 G 7 G 11 G 6 G 12 G 20 T 23 111 2292 G 17 G 13 G 9 G 17 G 19 G 17 G 14 G 7 G 11 G 6 G 12 G 20 A 23 111 2293 G 17 G 13 G 9 G 17 G 19 G 17 G 14 G 7 G 11 G 6 G 12 G 20 T 23 111 2298 T 17 T 13 T 9 T 17 T 19 T 17 T 14 T 7 T 11 T 6 T 12 T 20 A 23 111 2302 A 17 A 13 A 9 A 17 A 19 G 17 G 14 G 7 G 11 G 6 G 12 A 20 A 23 111 2309 G 17 G 13 G 9 G 17 G 19 G 17 G 14 G 7 G 11 G 6 G 12 G 20 T 23 111 2311 C 17 C 13 C 9 C 17 C 19 C 17 C 14 C 7 C 11 C 6 C 12 T 20 C 23 111 2320 G 17 G 13 G 9 G 17 G 19 G 17 G 14 G 7 G 11 G 6 G 12 G 20 T 23 111 2321 A 17 A 13 A 9 A 17 A 19 A 17 A 14 A 7 A 11 A 6 A 12 A 20 C 23 111 2324 G 17 G 13 G 9 G 17 G 19 G 17 G 14 G 7 G 11 G 6 G 12 G 20 T 23 111 2325 A 17 A 13 A 9 A 17 A 19 A 17 A 14 A 7 A 11 A 6 A 12 A 20 T 23 111 2326 A 17 A 13 A 9 A 17 A 19 A 17 A 14 A 7 A 11 A 6 A 12 A 20 T 23 111 2328 C 17 C 13 C 9 C 17 C 19 C 17 C 14 C 7 C 11 C 6 C 12 C 20 A 23 111 2329 A 17 A 13 A 9 A 17 A 19 A 17 A 14 A 7 A 11 A 6 A 12 A 20 T 23 111 2330 A 17 A 13 A 9 A 17 A 19 A 17 A 14 A 7 A 11 A 6 A 12 A 20 G 23 111 2331 T 17 T 13 T 9 T 17 T 19 T 17 T 14 T 7 T 11 T 6 T 12 T 20 A 23 111 2335 A 17 A 13 A 9 A 17 A 19 A 17 A 14 A 7 A 11 A 6 A 12 A 20 G 23 111 2338 A 17 A 13 A 9 A 17 A 19 A 17 A 14 G 7 G 11 G 6 G 12 A 20 A 23 111 2340 G 17 G 13 G 9 G 17 G 19 G 17 G 14 G 7 G 11 G 6 G 12 G 20 A 23 111 2341 A 17 A 13 A 9 A 17 A 19 A 17 A 14 A 7 A 11 A 6 A 12 A 20 T 23 111 2345 C 17 C 13 C 9 C 17 C 19 C 17 C 14 G 7 G 11 G 6 G 12 A 20 A 23 111 2347 A 17 A 13 A 9 A 17 A 19 G 17 G 14 G 7 G 11 G 6 G 12 G 20 G 23 111 2357 C 17 C 13 C 9 C 17 C 19 C 17 C 14 C 7 C 11 C 6 C 12 A 20 C 23 111 2358 G 17 G 13 G 9 G 17 G 19 G 17 G 14 G 7 G 11 G 6 G 12 C 20 A 23 111 2359 C 17 C 13 C 9 C 17 C 19 C 17 C 14 C 7 C 11 C 6 C 12 C 20 T 23 111 2360 T 17 T 13 T 9 T 17 T 19 T 17 T 14 T 7 T 11 T 6 T 12 T 20 A 23 111 2361 G 17 G 13 G 9 G 17 G 19 G 17 G 14 G 7 G 11 G 6 G 12 G 20 C 23 111 2362 T 17 T 13 T 9 T 17 T 19 T 17 T 14 T 7 T 11 T 6 T 12 T 20 C 23 111 2364 C 17 C 13 C 9 C 17 C 19 C 17 C 14 C 7 C 11 C 6 C 12 C 20 T 23 111 2365 G 17 G 13 G 9 G 17 G 19 G 17 G 14 G 7 G 11 G 6 G 12 C 20 A 23
Table 2: Continued. Gene Position
111 2366 A 17 A 13 A 9 A 17 A 19 A 17 A 14 A 7 A 11 A 6 A 12 C 20 G 23 111 2367 G 17 G 13 G 9 C 17 G 19 G 17 G 14 G 7 G 11 G 6 G 12 A 20 A 23 111 2368 C 17 C 13 C 9 C 17 C 19 C 17 C 14 C 7 C 11 C 6 C 12 T 20 C 23 111 2369 A 17 A 13 A 9 A 17 A 19 A 17 A 14 A 7 A 11 A 6 A 12 A 20 C 23 111 2375 T 17 T 13 T 9 T 17 T 19 T 17 T 14 T 7 T 11 T 6 T 12 T 20 A 23 111 2376 G 17 G 13 G 9 G 17 G 19 G 17 G 14 G 7 G 11 G 6 G 12 G 20 A 23 111 2377 G 17 G 13 G 9 G 17 G 19 G 17 G 14 G 7 G 11 G 6 G 12 C 20 T 23 111 2381 G 17 G 13 G 9 G 17 G 19 G 17 G 14 G 7 G 11 G 6 G 12 G 20 C 23 111 2382 G 17 G 13 G 9 G 17 G 19 G 17 G 14 G 7 G 11 G 6 G 12 G 20 T 23 111 2383 A 17 A 13 A 9 A 17 A 19 A 17 A 14 A 7 A 11 A 6 A 12 A 20 G 23 111 2385 C 17 C 13 C 9 C 17 C 19 C 17 C 14 C 7 C 11 C 6 C 12 C 20 A 23 111 2386 A 17 A 13 A 9 A 17 A 19 A 17 A 14 A 7 A 11 A 6 A 12 A 20 C 23 111 2444 A 17 A 13 A 9 A 17 A 19 A 17 A 14 A 7 A 11 A 6 A 12 T 20 A 23 111 2471 G 17 G 13 G 9 G 17 G 19 G 17 G 14 A 7 A 11 A 6 G 12 G 20 G 23 112 2547 G 14 G 11 A 6 G 19 G 12 G 16 G 12 G 6 G 8 G 7 G 14 G 19 G 21 112 2582 G 14 G 11 G 6 G 19 G 12 G 16 G 12 T 6 G 8 G 7 G 14 G 19 G 21 112 2583 A 14 A 11 A 6 A 19 C 12 C 16 C 12 C 6 A 8 C 7 A 14 C 19 C 21 112 2593 A 14 A 11 A 6 A 19 A 12 A 16 A 12 A 6 A 8 T 7 A 14 A 19 A 21 112 2649 T 14 T 11 C 6 T 19 C 12 C 16 C 12 C 6 C 8 C 7 C 14 C 19 C 21 112 2691 C 14 C 11 C 6 C 19 C 12 C 16 C 12 C 6 C 8 C 7 C 14 C 19 T 21 112 2695 T 14 T 11 T 6 T 19 T 12 T 16 T 12 T 6 T 8 G 7 T 14 T 19 T 21 112 2716 C 14 C 11 A 6 C 19 C 12 C 16 C 12 C 6 C 8 C 7 C 14 C 19 C 21 112 2733 G 14 G 11 G 6 G 19 G 12 G 16 G 12 G 6 G 8 T 7 G 14 G 19 G 21 112 2744 T 14 T 11 T 6 T 19 T 12 T 16 T 12 C 6 T 8 T 7 T 14 T 19 T 21 112 2752 T 14 T 11 T 6 T 19 T 12 T 16 T 12 T 6 T 8 G 7 T 14 T 19 T 21 112 2765 T 14 T 11 T 6 T 19 T 12 T 16 T 12 T 6 T 8 T 7 T 14 G 19 T 21 112 2767 A 14 A 11 A 6 A 19 A 12 A 16 A 12 A 6 A 8 T 7 A 14 A 19 A 21 113 2812 A 21 A 18 C 14 A 14 A 22 A 22 A 24 A 10 A 12 A 12 A 10 A 22 A 20 113 2906 G 21 G 18 G 14 G 14 C 22 G 22 G 24 G 10 G 12 G 12 C 10 G 22 G 20 113 2934 G 21 G 18 G 14 G 14 G 22 G 22 G 24 G 10 A 12 G 12 G 10 G 22 G 20 113 2957 G 21 G 18 G 14 G 14 G 22 G 22 G 24 G 10 G 12 G 12 G 10 G 22 T 20 113 2982 A 21 A 18 A 14 A 14 A 22 A 22 A 24 A 10 C 12 A 12 A 10 A 22 A 20 113 3012 T 21 T 18 T 14 T 14 C 22 T 22 T 24 T 10 T 12 T 12 T 10 T 22 T 20 113 3014 C 21 C 18 A 14 C 14 C 22 C 22 C 24 C 10 C 12 C 12 C 10 C 22 C 20 113 3021 A 21 A 18 A 14 A 14 A 22 A 22 A 24 A 10 C 12 A 12 A 10 A 22 A 20
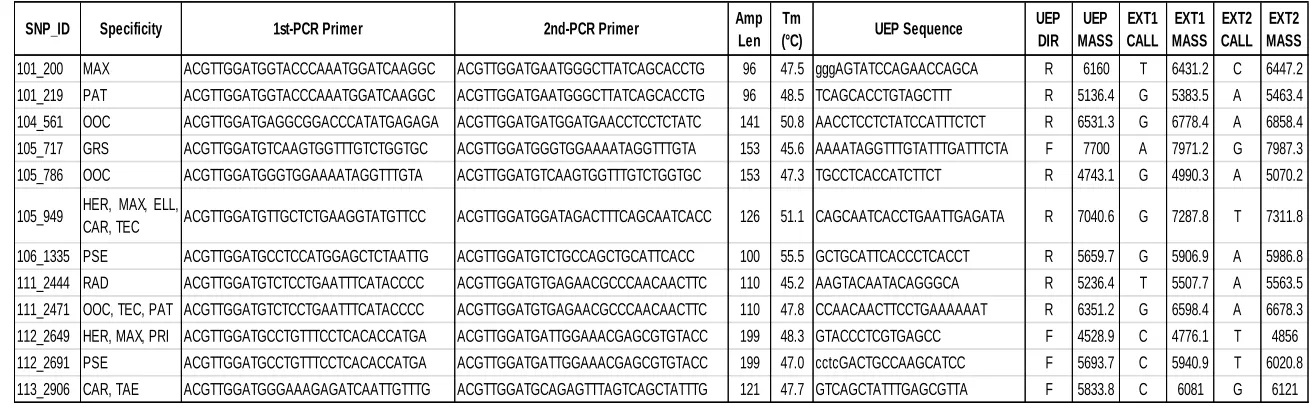
Table 3: Sequenom MassARRAY iPLEX assay design. Locus specific primers, expected amplified fragment size (Amp Len), annealing temperature (Tm), unextend primer (UEP) and wild (EXT1) versus mutant (EXT2) calls and mass are shown. Species codes are as follow: Pinus taeda (TAE), P. elliottii (ELL), P. radiata (RAD), P. patula (PAT), P. tecunumanii
(TEC), P. oocarpa (OOC), P. maximinoi (MAX), P. herrerae (HER), P. caribaea var. hondurensis (CAR), P. pringlei (PRI), P. pseudostrobus (PSE), P. greggii var. australis (GRS) and P. greggii var. greggii (GRN).
SNP_ID Specificity 1st-PCR Primer 2nd-PCR Primer Amp Len
Tm
(°C) UEP Sequence
UEP DIR UEP MASS EXT1 CALL EXT1 MASS EXT2 CALL EXT2 MASS
101_200 MAX ACGTTGGATGGTACCCAAATGGATCAAGGC ACGTTGGATGAATGGGCTTATCAGCACCTG 96 47.5 gggAGTATCCAGAACCAGCA R 6160 T 6431.2 C 6447.2 101_219 PAT ACGTTGGATGGTACCCAAATGGATCAAGGC ACGTTGGATGAATGGGCTTATCAGCACCTG 96 48.5 TCAGCACCTGTAGCTTT R 5136.4 G 5383.5 A 5463.4 104_561 OOC ACGTTGGATGAGGCGGACCCATATGAGAGA ACGTTGGATGATGGATGAACCTCCTCTATC 141 50.8 AACCTCCTCTATCCATTTCTCT R 6531.3 G 6778.4 A 6858.4 105_717 GRS ACGTTGGATGTCAAGTGGTTTGTCTGGTGC ACGTTGGATGGGTGGAAAATAGGTTTGTA 153 45.6 AAAATAGGTTTGTATTTGATTTCTA F 7700 A 7971.2 G 7987.3 105_786 OOC ACGTTGGATGGGTGGAAAATAGGTTTGTA ACGTTGGATGTCAAGTGGTTTGTCTGGTGC 153 47.3 TGCCTCACCATCTTCT R 4743.1 G 4990.3 A 5070.2
105_949 HER, MAX, ELL,
CAR, TEC ACGTTGGATGTTGCTCTGAAGGTATGTTCC ACGTTGGATGGATAGACTTTCAGCAATCACC 126 51.1 CAGCAATCACCTGAATTGAGATA R 7040.6 G 7287.8 T 7311.8
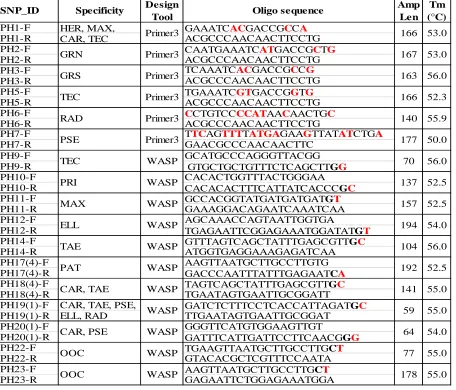
Table 4: WASP & Primer3 assay design. Software design tool, primer sequence, expected amplified fragment size (Amp Len) and average annealing temperature (Tm) for each primer pair is shown. Diagnostic SNP locations are in red and mismatch locations are bolded. Species codes are as follow: Pinus taeda (TAE), P. elliottii (ELL), P. radiata (RAD), P. patula (PAT), P. tecunumanii (TEC), P. oocarpa (OOC), P. maximinoi (MAX), P. herrerae (HER), P. caribaea var. hondurensis (CAR), P. pringlei (PRI), P. pseudostrobus (PSE), P. greggii var. australis (GRS) and P. greggii var. greggii (GRN).
SNP_ID Specificity Design
Tool Oligo sequence
Amp Len
Tm (°C)
PH1-F HER, MAX, GAAATCACGACCGCCA
PH1-R CAR, TEC ACGCCCAACAACTTCCTG
PH2-F CAATGAAATCATGACCGCTG
PH2-R ACGCCCAACAACTTCCTG
PH3-F TCAAATCACGACCGCCG
PH3-R ACGCCCAACAACTTCCTG
PH5-F TGAAATCGTGACCGGTG
PH5-R ACGCCCAACAACTTCCTG
PH6-F CCTGTCCCCATAACAACTGC
PH6-R ACGCCCAACAACTTCCTG
PH7-F TTCAGTTTTATGAGAAGTTATATCTGA
PH7-R GAACGCCCAACAACTTC
PH9-F GCATGCCCAGGGTTACGG
PH9-R GTGCTGCTGTTTCTCAGCTTGG
PH10-F CACACTGGTTTACTGGGAA
PH10-R CACACACTTTCATTATCACCCGC
PH11-F GCCACGGTATGATGATGATGT
PH11-R GAAAGGACAGAATCAAATCAA
PH12-F AGCAAACCAGTAATTGGTGA
PH12-R TGAGAATTCGGAGAAATGGATATGT
PH14-F GTTTAGTCAGCTATTTGAGCGTTGC
PH14-R ATGGTGAGGAAAGAGATCAA
PH17(4)-F AAGTTAATGCTTGCCTTGTG
PH17(4)-R GACCCAATTTATTTGAGAATCA
PH18(4)-F TAGTCAGCTATTTGAGCGTTGC
PH18(4)-R TGAATAGTGAATTGCGGATT
PH19(1)-F CAR, TAE, PSE, GATCTCTTTCCTCACCATTAGATGC
PH19(1)-R ELL, RAD TTGAATAGTGAATTGCGGAT
PH20(1)-F GGGTTCATGTGGAAGTTGT
PH20(1)-R GATTTCATTGATTCCTTCAACGGG
PH22-F TGAAGTTAATGCTTGCCTTGCT
PH22-R GTACACGCTCGTTTCCAATA
PH23-F AAGTTAATGCTTGCCTTGCT
PH23-R GAGAATTCTGGAGAAATGGA Primer3 GRN 166 167 ELL 166 140 70 137 TEC PRI 157 194 TAE Primer3 Primer3 Primer3 Primer3 WASP WASP WASP WASP WASP PSE Primer3 GRS TEC RAD MAX 104 53.0 53.0 56.0 52.3 55.9 56.0 52.5 52.5 54.0 56.0 177 50.0 163 WASP 192 141
CAR, PSE WASP
Table 5: Verified hybrid crosses. Percentage of confirmed hybrid individuals (%), 95% confidence intervals, probability of individual showing the markers being a true hybrid (Pr(E│C)), probability of false positives (Pr(Pr(E│Ĉ)) and likelihood ratio (L) are provided. Species codes are as follow: Pinus taeda (TAE), P. elliottii (ELL), P. radiata (RAD), P. patula (PAT), P. tecunumanii (TEC), P. oocarpa (OOC), P. maximinoi (MAX), P. herrerae (HER), P. caribaea var. hondurensis (CAR), P. pringlei (PRI), P. pseudostrobus (PSE), P. greggii var. australis (GRS) and P. greggii var. greggii (GRN).
Verified
Hybrids %
95% C.I.
(±) Pr(EǀC) Pr(EǀĈ) L
Verified
Hybrids %
95% C.I.
(±) Pr(EǀC) Pr(EǀĈ) L
1 1 100 0 0.82 0.18 4.6 1 100 0 0.99 0.01 79.86
9 5 56 32 0.84 0.16 5.1 9 100 0 0.99 0.01 110.68
8 6 75 30 0.82 0.18 4.6 8 100 0 0.99 0.01 110.68
6 5 83 30 0.82 0.18 4.6 4 67 38 0.93 0.07 13.75
6 6 100 0 0.82 0.18 4.6 4 67 38 0.98 0.02 50.93
12 7 58 28 0.84 0.16 5.1 0 0 0 - -
-6 6 100 0 0.82 0.18 4.6 0 0 0 - -
-5 3 60 43 0.87 0.13 6.9
24 9 38 19 0.84 0.16 5.1 10 42 20 0.97 0.03 34.53
16 4 25 21 0.84 0.16 5.1 0 0 0 - -
-8 0 0 0 - - - 2 25 30 0.99 1.48589E-08 6.73E+07
23 5 22 17 0.84 0.16 5.1 6 26 18 0.84 0.16 5.35
24 0 0 0 - - - 10 42 20 0.84 0.16 5.35
24 4 17 15 0.87 0.13 6.6 24 100 0 0.99 0.01 110.68
23 3 13 14 0.87 0.13 6.6 8 35 19 0.93 0.07 13.75
19 1 5 10 0.87 0.13 6.6 1 5 10 0.93 0.07 13.75
24 0 0 0 - - - 16 67 19 0.92 0.08 11.79
24 1 4 8 0.87 0.13 6.6 15 63 19 0.82 0.18 4.59
23 1 4 8 0.99 0.01 90.8
inconclusive results
inconclusive results Total
Ind.
Table 5: Continued.
Verified Hybrids %
95% C.I.
(±) Pr(EǀC) Pr(EǀĈ) L
Verified Hybrids %
95% C.I.
(±) Pr(EǀC) Pr(EǀĈ) L
21 RAD X TEC 24 2 8 11 0.87 0.13 6.6 1 4 8 0.91 0.09 10.10
41 RAD X TEC 16 2 13 16 0.87 0.13 6.6 0 0 0 - -
-18 ELL X MAX 12 12 100 0 0.99 0.01 110.68
45 ELL X MAX 8 8 100 0 0.99 0.01 110.68
18 ELL X OOC 12 4 33 27 0.93 0.07 13.75
18 ELL X TEC 12 0 0 0 - -
-18 GRN X MAX 8 8 100 0 0.99 0.01 110.68
18 GRN X OOC 22 0 0 0 - -
-18 GRN X TEC 10 1 10 19 0.91 0.09 10.10
18 PAT X GRN 2 1 50 69 0.84 0.16 5.35
18 PAT X HER 16 5 31 23 0.83 0.17 4.85
7 PAT X OOC 24 22 92 11 0.93 0.07 13.75
10 PAT X OOC 22 17 77 18 0.93 0.07 13.75
7 PAT X PRI 12 2 17 21 0.82 0.18 4.59
10 PAT X TEC 24 18 75 17 0.91 0.09 10.10
18 PAT X TEC 24 14 58 20 0.91 0.09 10.10
10 PAT X TEC 24 16 67 19 0.91 0.09 10.10
18 PAT X TEC 20 9 45 22 0.91 0.09 10.10
18 PAT XOOC 15 11 73 22 0.93 0.07 13.75
10 TEC X OOC 11 inconclusive results 11 100 0 0.93 0.07 13.75
inconclusive results inconclusive results inconclusive results inconclusive results inconclusive results inconclusive results inconclusive results inconclusive results inconclusive results inconclusive results inconclusive results inconclusive results inconclusive results inconclusive results inconclusive results Camcore Member Code
Hybrid cross Total Ind.
Approach 1 Approach 2
Table 6: Test of Agreement. Raw data and SAS output for the pairwise comparison between the two categories and the two experimental approaches are presented below. Simple kappa coefficient values close to 1 indicate complete agreement, while values closer to 0 indicate lack of agreement.
True Hybrids
Not
Hybrids Total
True Hybrids 5 2 7
Not Hybrids 3 9 12
Total 8 11 19
Statistic (S) 0.2000
DF 1
Pr > S 0.6547
0.4509 0.2078 0.0436 0.8581 0.2280 1.9772 0.0240 0.0480
Sample Size = 19 The FREQ Procedure
Statistics for Table of Approach1 by Approach2
McNemar's Test
Simple Kappa Coefficient Kappa
ASE
95% Lower Conf. Limit 95% Upper Conf. Limit
Test of H0: Kappa = 0
ASE under H0
Z
One-sided Pr > Z Two-sided Pr > |Z|
FIGURES