Code Coverage of Adaptive Random Testing
Tsong Yueh Chen,
Member, IEEE
, Fei-Ching Kuo,
Member, IEEE
,
Huai Liu,
Member, IEEE
, and W. Eric Wong,
Member, IEEE
Abstract
Random testing is a basic software testing technique that can be used to assess the software reliability as well as to detect software failures. Adaptive random testing has been proposed to enhance the failure-detection capability of random testing. Previous studies have shown that adaptive random testing can use fewer test cases than random testing to detect the rst software failure. In this paper, we evaluate and compare the performance of adaptive random testing and random testing from another perspective, that of code coverage. As shown in various investigations, a higher code coverage not only brings a higher failure-detection capability, but also improves the effectiveness of software reliability estimation. We conduct a series of experiments based on two categories of code coverage criteria: structure-based coverage, and fault-based coverage. Adaptive random testing can achieve higher code coverage than random testing with the same number of test cases. Our experimental results imply that, in addition to having a better failure-detection capability than random testing, adaptive random testing also delivers a higher effectiveness in assessing software reliability, and a higher condence in the reliability of the software under test even when no failure is detected.
Index Terms
Failure-based testing, random testing, adaptive random testing, code coverage.
ACRONYMS
RT Random Testing
ART Adaptive Random Testing
FSCS-ART Fixed-Sized-Candidate-Set Adaptive Random Testing
CPM Category Partition Method
This research project is supported by an Australian Research Council Discovery Grant (DP0880295).
T. Y. Chen, F.-C. Kuo, and H. Liu are with the Faculty of Information and Communication Technologies, Swinburne University of Technology, Hawthorn 3122 VIC, Australia (e-mail: [email protected]; [email protected]; [email protected]). W. E. Wong is with the Department of Computer Science, University of Texas at Dallas, Richardson TX 75083, USA (e-mail: [email protected]).
NOTATION
\ The set difference operator
|·| The size of a set
Axij The jth category for a program input xi
Oxij
xi The choice of category Axij for xi
A(xi) The list of categories associated with xi, that is,
Axi1, Axi2,· · ·, Axiq
O(xi) The list of choices associated with xi, that is, Oxi1 xi , O
xi2
xi ,· · · , O
xiq
xi
O(x1, x2) The set of distinct choices for inputs x1 and x2, that is, (O(x1)∪O(x2))\(O(x1)∩O(x2))
A(x1, x2) The set of distinct categories for inputs x1 and x2, that is,
Ah|Al,if ∃Otl ∈O(x1, x2)
Ns The total number of certain elements in the program under test (such as statements,
decisions, c-uses, p-uses, etc.)
Ni The number of infeasible program elements
Nc The number of program elements covered by a test set
Mn The total number of mutants generated
Ma The number of mutants that are syntactically incorrect and thus cannot be compiled
Mt The number of mutants that can be compiled successfully, that is, Mn−Ma
Mq The number of equivalent mutants
Mk The number of killed mutants
I. INTRODUCTION
Software testing, a major approach to software quality assurance, is widely acknowledged as a vital
activity throughout the software development process. Many software testing methods are accomplished
by dening test objectives, selecting some inputs of the software under test as test cases, executing the
software with these test cases, and verifying testing results. Because software normally has an extremely
large input domain (that is, the set of all possible inputs for the software under test), testers are always
required to select a certain portion of the input domain as test cases such that software failures can be
effectively detected within the limited testing resources. A large number of software testing methods have
been proposed to guide the test case selection.
Random testing (RT) is a fundamental testing method which simply selects test cases in a random
manner from the whole input domain [33]. RT has been popularly applied to assess software reliability.
However, its effectiveness at detecting software failures is debatable. Myers [33] criticized that RT may
be the “least effective” testing method for using little or no information about the software under test.
Menzies and Cukic [29], based on a series of simulations, claimed that RT could “adequately probe the
a particular class of testing methods, partition testing, which divides the whole input domain into disjoint
partitions, and then selects test cases from these partitions. They found that RT may be more cost-effective
than partition testing.
In spite of controversies about its effectiveness, RT has been successfully used in different areas for
detecting various failures. For example, Miller et al. [31], [32] have used RT to test UNIX utility programs,
and reported that a large number of UNIX programs have been crashed or hanged by test cases generated
using RT. Forrester and Miller [19] applied the RT technique to test Windows NT applications, and it was
observed that 21% of tested applications were crashed, and an additional 24% of applications were hanged.
RT has also been used in the testing of graphical user interfaces [15], Java Just-In-Time compilers [47],
and embedded software systems [36]. Moreover, RT has been adopted in many industrial automatic testing
tools, such as those developed by IBM [3], Microsoft [39], and Bell Labs [20].
Inputs that cause the program under test to exhibit failure behaviors are named as failure-causing
inputs. Researchers from various areas [2], [4], [42], [43] have made a common observation that
failure-causing inputs often cluster into contiguous failure regions. White and Cohen [43], for example, found
that contiguous failure regions often result from a common type of software fault, namely domain error,
which refers to an error located in a decision of a program. Ammann and Knight [2] studied some missile
launch decision programs, and observed that “particular failure regions are locally continuous.” Bishop [4]
observed “blob defects,” where all detected failure-causing inputs “occupied contiguous regions” in some
nuclear reactor trip programs, and theoretically justied the existence of “blob defects.” Van der Meulen et
al. [42] collected a large number of faulty programs written in different languages by various programmers,
and observed that most failure regions are contiguous.
Given that failure regions are frequently contiguous, it should also be common for non-failure regions to
be contiguous. Under such situations, adjacent test cases often have similar behaviors in failure detection.
If a test case t does not reveal any failure, a test case that is away from t is more likely to detect a
failure than t’s “neighbors” [12]. Based on such an intuition, Chen et al. [13] proposed a novel method,
namely adaptive random testing (ART), to enhance the failure-detection capability of RT. In ART, test
cases are not only randomly generated, but also evenly spread over the whole input domain. Previous
studies have shown that ART is more effective than RT, not only because ART generally uses fewer test
cases to detect the rst failure than RT [11], but also because the failure-detection capability of ART is
more reliable than that of RT [26]. As a consequence of a better failure-detection capability, ART can
save testing resources, and the saving will become more signicant when test case execution or test output
verication is expensive. ART improves the performance of RT while keeping the randomness in the test
The even spread of test cases, the basic notion of ART, is essentially a form of test case diversity [10]
across the input domain of the software under test. The diversity of test cases is effectively the key
concept for many testing techniques. For example, some code coverage criteria [48] have been used to
guide the selection of diverse test cases such that certain program structures are covered1, or certain
types of faults are detected. Previous studies have shown that the coverage techniques not only enhance
the failure-detection capability [22], [44], [45], [46], but also improve the effectiveness in assessing the
software reliability [7]. Besides being used in the selection of test cases, these coverage criteria can also
be applied to measure the adequacy of a test set (that is, a set of test cases) [48].
In this paper, we attempt to answer the following research question: apart from a better failure-detection
capability than RT, does the test case diversity brought by ART across the input domain also result in higher
code coverage? We conduct experimental studies to evaluate and compare the code coverage achieved by
ART and RT. Our experimental results show that, given the same number of test cases, ART normally
achieves higher code coverage than RT. Such an observation conrms that ART is a more effective testing
method than RT, not only because it enhances the failure-detection capability, but also because it delivers
a higher condence on the software reliability.
The paper is organized as follows. In Section II, we introduce some background information about
ART and code coverage criteria. In Sections III and IV, we report our experiments and the experimental
results. In Section V, we discuss the threats to validity of our study. In Section VI, we conclude the paper.
II. PRELIMINARIES
A. An ART algorithm
Generally speaking, test cases selected by ART have two essential attributes: (i) randomness, and (ii)
even spread. Most ART algorithms use twos-independent processes to ensure these attributes. One process
is to randomly generate program inputs astest case candidates, or brieycandidates. The other process in
ART is to apply certain criteria to select test cases from candidates such that the executed test cases are
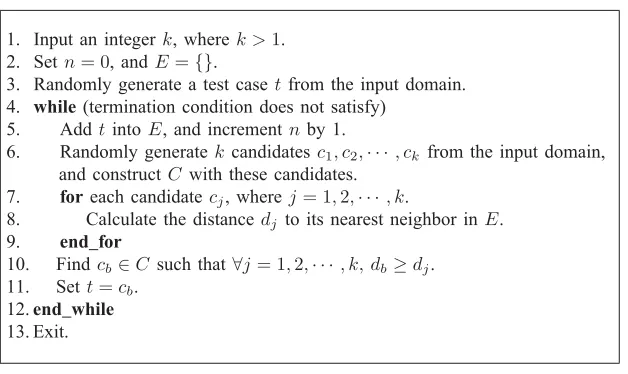
evenly spread over the input domain. One typical ART algorithm is called xed-size-candidate-set ART
(FSCS-ART) [13]. It maintains two sets of test cases. One set is the executed set E = {e1, e2,· · · , en},
wheree1, e2,· · ·, enare all executed test cases; the other set is thecandidate set, which containskrandomly
generated inputs, denoted by C = {c1, c2,· · · , ck}, where k is xed throughout the testing process. A
candidate will be selected as the next test case if it has the longest distance to its nearest neighbor in E.
Fig. 1 gives the detailed algorithm of FSCS-ART.
In Fig. 1, the termination condition can be “when the testing resources are exhausted,” “when a certain
number of test cases have been executed,” “when the rst failure is detected,” etc. In most previous studies
1. Input an integerk, wherek >1. 2. Set n= 0, andE={}.
3. Randomly generate a test casetfrom the input domain. 4. while(termination condition does not satisfy)
5. AddtintoE, and incrementn by 1.
6. Randomly generatek candidatesc1, c2,· · · , ck from the input domain, and constructC with these candidates.
7. foreach candidatecj, wherej= 1,2,· · ·, k.
8. Calculate the distancedj to its nearest neighbor inE.
9. end for
10. Findcb∈C such that∀j= 1,2,· · · , k, db≥dj. 11. Sett=cb.
12.end while
13. Exit.
Fig. 1: The algorithm of FSCS-ART
of ART, it was often assumed that the program under test only has numeric inputs, and the “distance” in
Statement 8 of Fig. 1 often referred to the Euclidean distance between two points.
The F-measure refers to the expected number of test cases required to detect the rst software failure.
Previous studies [10], [11], [13], [26] often used F-measure to examine and compare the failure-detection
capabilities of ART and RT, and showed that ART normally has a smaller F-measure than RT. Liu and
Zhu [26] also found that the F-measure of ART has smaller variation than that of RT, that is, ART has a
more reliable failure-detection capability than RT.
Previous studies [12] on FSCS-ART have shown that, although the F-measure of FSCS-ART becomes
smaller with the increase of k, anyk > 10 will only marginally reduce the F-measure. k = 10 is a fair
setting for balancing the trade-off between the failure-detection capability and the computation overhead
of FSCS-ART. In this paper, we use FSCS-ART with k= 10 to study ART.
The basic intuition of ART is to evenly spread random test cases. Besides FSCS-ART, various
ART algorithms have been proposed to achieve the goal of even spread, such as ART by dynamic
partitioning [8], lattice-based ART [28], restricted random testing [6], etc. These ART algorithms have
different ways of evenly spreading test cases, different failure-detection effectiveness, and different
computation overheads. FSCS-ART requires O(n2) time to select n test cases. When the number of
test cases is very large, some techniques, such as forgetting [5], can be used to reduce the runtime of
FSCS-ART. By forgetting some executed test cases, the selection of a new test case may refer to a
xed number of the most recently executed test cases instead of all previously executed test cases. As a
result, the test case selection time for FSCS-ART with forgetting can then be independent of n. Previous
studies [5] also showed that such a forgetting technique does not signicantly reduce the failure-detection
in Section III), so we do not use the forgetting technique.
B. Application of ART into programs with non-numeric inputs
Most previous studies on ART have assumed that the program under test only has numeric inputs. In
these studies, the Euclidean distance is the metric for measuring the distance between inputs, and is used
by ART to evenly spread test cases. However, there exist a great number of non-numeric programs (that
is, programs with non-numeric inputs) in real life, and it is not so straightforward to measure the distance
between two non-numeric inputs. Recently, a new metric, namelycategory-partition-based metric, has been
proposed for non-numeric inputs [23], [30]. Some preliminary empirical studies have been conducted on
this new metric [23], and the experimental results showed that ART usually has a better failure-detection
capability than RT for programs with non-numeric inputs.
The basic intuition of such a metric is explained as follows. Intuitively speaking, if two program inputs
trigger the same functionalities, they are likely to cause the program under test to have similar test outcomes
(failure or pass). To effectively detect failures, successive test cases should differ from each other as much
as possible with respect to the functionalities that they trigger. Instead of the Euclidean distance, the new
metric attempts to measure the distance between two inputs in terms of the functionalities triggered by
them. Category partition method (CPM) [34] was adopted to facilitate the measurement of the distance
between two inputs.
Traditionally, CPM is used to generate test cases. In CPM, testers rst identify a set of categories and
associated choices based on functionalities given in software specications. Then they identify constraints
among choices, generate test frames, and nally create one test case for each test frame.
Instead of using CPM to generate test cases, categories and choices are used to construct an input
classication scheme. For example, an inputxi is associated with a list of categories A(xi), and a list of
choices O(xi). Because these categories and choices are dened based on software functionalities, they
can reect the relationship between program inputs and their associated functionalities. Based on such
a scheme, the distance between two inputs x1 and x2 can be calculated as follows. First, we construct
the set of distinct choices O(x1, x2) for x1 and x2. Secondly, we construct the set of distinct categories
A(x1, x2) forx1 and x2. Finally, we can calculate the distance betweenx1 and x2 as A(x1, x2).
C. Code coverage criteria
There are various code coverage criteria in the literature [48]. For example, structure-based criteria
require the selected test cases to thoroughly execute certain elements in the structure of the software
under test, while fault-based coverage criteria require the selected test cases to thoroughly detect various
Control-ow criteria and data-ow criteria are two typical structure-based coverage criteria.
Control-ow coverage criteria [21] consider some control constructs of the program under test. For example, in
statement testing strategy, test cases are selected such that all feasible statements2 in the program are
executed at least once. Condition coverage is another example of control-ow testing strategy, which
subsumes statement testing. In condition coverage testing, test cases are required to exercise both the true
and false outcomes of each feasible condition in all feasible decisions. According to data-ow coverage
criteria [24], test cases should thoroughly exercise certain patterns of data manipulation within the program
under test. Patterns of data manipulation include the denition of a datum (abbreviated as def), where
a value is allocated to the datum, and usage of a datum (abbreviated as use), where the datum’s value
is used by an operation. In addition, use can be further classied into c-use, where a datum is used
in a computational expression or as an output; and p-use, where a datum appears in a predicate within
the program. Many data-ow testing strategies have been proposed based on the above concepts, such as
all-defs, all-p-uses, all-c-uses, and all-def-use-pairs coverage. Readers may be interested to nd details
of control-ow and data-ow coverage criteria from software testing literature [1], [27], [33], [35]. The
percentage of control-ow or data-ow coverage (referred to as coverage percentage in the rest of this
paper) that a test set can achieve is calculated as
Coverage percentage = Nc
Ns−Ni ×100%, (1)
Mutation analysis [17] is a popular approach for fault-based coverage. In code-based mutation analysis,
mutation operators are applied to inject a set of predened faults into a program. As a result, a number of
variants, namely mutants, are generated based on the program under test. If a test case detects different
behaviors between a mutant and the program, this test case is said to “kill” the mutant, and thus detect the
fault seeded in the mutant. The performance of the constructed test set is measured based on its ability
to kill mutants. Mutation score, which is used to measure how thoroughly a test set can kill the mutants,
is dened as
Mutation score = Mk
Mt−Mq ×100%, (2)
Many previous studies have shown the advantages of code coverage criteria from various perspectives.
Hutchines et al. [22], for example, have used some coverage testing techniques to detect failures in “the
Siemens suite.” It was observed that the higher coverage a test set could achieve, the more failures would
be revealed. Wong et al. [44] pointed out that the coverage achieved by a test set is strongly correlated
2For a program element (such as statement, condition, etc.) to be feasible, the conditions along the path containing the element should
to the failure-detection capability, while the size reduction of a test set has almost no impact on the
failure-detection capability as long as the coverage remains unchanged [45], [46]. Rothermel et al. [37]
have used some coverage criteria as test case prioritization schemes. It was found that code coverage
criteria can signicantly enhance the failure-detection capability of the test case prioritization technique.
Chen et al. [7] also observed that the coverage technique can even be applied to improve the effectiveness
of software reliability estimation.
Code coverage criteria are very useful in the measurement of the quality of a test set [48]. If a test set
achieves 100% coverage on the program under test in terms of a certain coverage criterion C, this set is
regarded as adequate with respect to C. Given two testing strategies, each of which selects a test set of
the same size, one strategy is considered better than the other from the perspective of C if its selected
test set can achieve higher coverage.
III. EXPERIMENTAL SETTINGS
In our previous study [9], we investigated the performance of ART for programs with numeric inputs.
Five programs were used to measure the structure-based coverage of ART. Each of these programs only
accepts a xed number of numeric inputs. However, in reality, there exist a large amount of programs that
accept non-numeric inputs. In this study, we further investigate the performance of ART beyond programs
with solely numeric inputs. We selected ten UNIX utility programs, namelyCal,Checkeq,Col,Comm,
Crypt, Look, Sort, Spline, Tr, and Uniq [45], as summarized in Table I. These subject programs
have various types of inputs, such as strings, data les, etc.
TABLE I: Subject programs and their basic information
Program Functionality Lines of code
Cal Print a calendar for a specied year or month 163
Checkeq Report missing or unbalanced delimiters and 90
.EQ/.EN pairs
Col Filter reverse paper motions for nroff output 274
for display on a terminal
Comm Select or reject lines common to two sorted 144
les
Crypt Encrypt and decrypt a le using a user 121
supplied password
Look Find words in the system dictionary or lines 135
in a sorted list
Sort Sort and merge les 842
Spline Interpolate smooth curve based on given data 289
Tr Translate characters 127
In this study, we use theχSudstool developed by Telcordia Technologies [40] to analyze the
structure-based coverage of a test set.χSudscan evaluate both the control-ow and data-ow coverage, and output
the coverage percentage that a test set can achieve. For control-ow coverage, χSuds evaluates “block
coverage” and “decision coverage”. A block refers to a sequence of statements whose execution will
not be interrupted by any decision. Therefore, the block coverage in χSuds is effectively equivalent
to statement coverage. The “decision coverage” in χSuds requires test cases to exercise both the true
and false outcomes of all conditions in each decision of the program under test; that is, the “decision
coverage” in χSuds is effectively equivalent to simple condition coverage. χSuds also measures two
data-ow coverage percentages, namely, “c-uses coverage,” and “p-uses coverage”. In this paper, we will
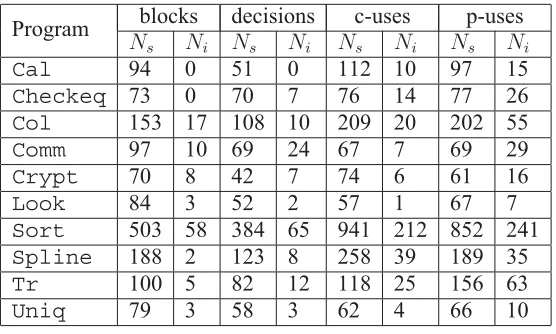
measure all these four coverage percentages for ART and RT. Table II reports the number of program
elements for each subject program. The values of Ns can be directly obtained from the χSuds tool.
It is an undecidable problem to automatically identify the program elements that are infeasible, that is,
there does not exist an algorithm which can identify the infeasible program elements. This study uses
the following method to calculate Ni. 100,000 test cases are randomly generated and executed for each
subject program. Ni is the number of the program elements that are not executed by any of these 100,000
test cases.
TABLE II: The number of program elements for each subject program
Program blocks decisions c-uses p-uses
Ns Ni Ns Ni Ns Ni Ns Ni
Cal 94 0 51 0 112 10 97 15
Checkeq 73 0 70 7 76 14 77 26
Col 153 17 108 10 209 20 202 55
Comm 97 10 69 24 67 7 69 29
Crypt 70 8 42 7 74 6 61 16
Look 84 3 52 2 57 1 67 7
Sort 503 58 384 65 941 212 852 241
Spline 188 2 123 8 258 39 189 35
Tr 100 5 82 12 118 25 156 63
Uniq 79 3 58 3 62 4 66 10
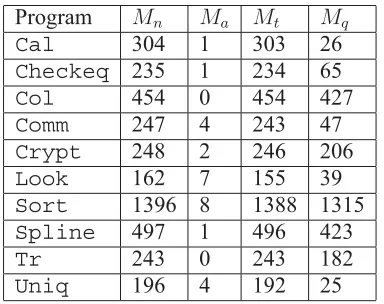
This study uses Proteum [16] to evaluate and compare the mutation scores of ART and RT. Given
a C program, Proteum can create a set of mutants, execute them against test cases, and report the
mutation score.Proteumprovides 71 mutation operators which are classied into four classes: statement,
operator, variable, and constant. All these operators are applied to create mutants of the subject programs,
as summarized in Table III. It is also an undecidable problem to automatically identify the equivalent
mutants. In this study, Mq is the number of mutants that are not killed by any of 100,000
TABLE III: Mutant statistics for subject programs
Program Mn Ma Mt Mq
Cal 304 1 303 26
Checkeq 235 1 234 65
Col 454 0 454 427
Comm 247 4 243 47
Crypt 248 2 246 206
Look 162 7 155 39
Sort 1396 8 1388 1315
Spline 497 1 496 423
Tr 243 0 243 182
Uniq 196 4 192 25
We evaluate the coverage percentages and mutation scores of ART and RT through the following four
step procedure.
1) Choose a subject program, and a test case selection strategy.
2) Generate a test set, with the number of test cases (that is, the size of the test set) being 1, 2, · · ·,
10, 20, · · ·, 100, 200, · · ·, 1000.
3) Use χSuds, and Proteum to evaluate four coverage percentages, and the mutation score,
respectively, of the test set generated in Step 2.
4) Repeat Steps 2 and 3 for a sufcient number (S) of times such that the mean value of the coverage
percentages or mutation scores is statistically reliable within a certain condence level(1−α)×100%,
and accuracy range ±r%. According to the central limit theorem [41], we can get
S =
100·Φ−1 2−α 2
·σ r·μ
2
, (3)
where μ, andσ are the mean value, and the standard deviation of coverage percentages or mutation
scores collected in Step 3, respectively; andΦ−1(·) denotes the inverse standard normal distribution
function. In this paper, we set the condence level, and the accuracy range as95% (α= 0.05), and
±5% (r = 5), respectively.
We applied RT and ART to all ten subject programs. Because each of these programs reads in a list of
arguments via the command prompt, a random test case can be generated by constructing a list of random
arguments. Details of such a random generator can be found in the work of Wong et al. [45].
For all subject programs, our experiments use the category-partition-based metric introduced in
Section II-B to measure the distance between two test inputs. To implement ART, we identied the
categories and associated choices by examining the specication of each program. Some specications
input-output relations.
In this study, the computation overhead of generating n test cases for RT, and ART are in O(n), and
O(n2), respectively. In our experiments, the number of test cases is not very large (maximum of 1000).
Moreover, the time for collecting data on coverage percentages and mutation scores is much longer than
the test case generation time. Therefore, there is no signicant difference in testing time between ART
and RT. As a reminder, we use the FSCS-ART algorithm (which requires O(n2) time to generate n
test cases) to study ART in this paper. As discussed in Section II-A, there are other ART algorithms
that have different computation overheads. For example, the algorithm of Random Border Centroidal
Voronoi Tessellations [38] has the runtime in O(n) for generating n test cases. Also note that extra
efforts are required when applying RT and ART in real-life situations. For example, proper random test
case generators should be used when RT is employed. In addition, categories and choices ought to be
identied when implementing ART on programs with inputs of arbitrary types (as shown in Section II-B).
IV. CODE COVERAGE OF ADAPTIVE RANDOM TESTING
A. Comparison of ART and RT based on structure-based coverage
Figs. 2 to 11 compare the structure-based coverage percentages of ART and RT. In these gures, the
x-axis represents the number of test cases in the logarithmic scale, and y-axis denotes the average coverage
percentages achieved by ART and RT.
Based on the experimental data, we have the following observations.
• For programs Cal, Checkeq, Col, Crypt, Look, Sort, Spline, Tr, and Uniq:
– When the size of the test set is small, ART has higher coverage percentages than RT.
– Under other situations, ART and RT have similar coverage percentages.
• For program Comm:
– On block, decision, and p-uses criteria, when the number of test cases is very small or large,
ART and RT have similar coverage percentages. Under other situations, ART has higher coverage
percentages than RT.
– On c-uses criterion, when the number of test cases is small, the coverage percentages of RT are
marginally higher than those of ART. Under other situations, ART and RT have similar coverage
percentages.
In summary, we observe that, other than one exception (c-uses for programComm), ART has noticeable
coverage improvement over RT starting from a small test set. On one hand, ART uses fewer test cases
than RT to achieve the same coverage; on the other hand, ART attains a higher coverage than RT with
70 80 90 100 a ge block co ve ra ge (%) 50 60 70 80 90 100
1 10 100 1000
Av e ra g e block co ve ra ge (%)
Numberoftestcases
RT ART (a) Block coverage onCal
70 80 90 100 e de cision cover age (%) 50 60 70 80 90 100
1 10 100 1000
Av e ra g e de cision cover age (%)
Numberoftestcases
RT ART (b) Decision coverage onCal
70 80 90 100 ge c Ͳ uses cover age (%) 50 60 70 80 90 100
1 10 100 1000
Av e ra g e c Ͳ uses cover age (%)
Numberoftestcases
RT ART (c) C-uses coverage onCal
60 70 80 90 100 g e p Ͳ uses co ve ra ge (%) 40 50 60 70 80 90 100
1 10 100 1000
Av e ra g e p Ͳ uses co ve ra ge (%)
Numberoftestcases
RT ART (d) P-uses coverage onCal
Fig. 2: Coverage percentages of ART and RT on the program Cal
70 80 90 100 a ge block co ve ra ge (%) 50 60 70 80 90 100
1 10 100 1000
Av e ra g e block co ve ra ge (%)
Numberoftestcases
RT ART (a) Block coverage onCheckeq
70 80 90 100 e de cision cover age (%) 50 60 70 80 90 100
1 10 100 1000
Av e ra g e de cision cover age (%)
Numberoftestcases
RT ART
(b) Decision coverage onCheckeq
60 70 80 90 100 ge c Ͳ uses cover age (%) 40 50 60 70 80 90 100
1 10 100 1000
Av e ra g e c Ͳ uses cover age (%)
Numberoftestcases
RT ART (c) C-uses coverage onCheckeq
60 70 80 90 100 g e p Ͳ uses co ve ra ge (%) 40 50 60 70 80 90 100
1 10 100 1000
Av e ra g e p Ͳ uses co ve ra ge (%)
Numberoftestcases
RT ART (d) P-uses coverage onCheckeq
80 90 100 a ge block co ve ra ge (%) 70 80 90 100
1 10 100 1000
Av e ra g e block co ve ra ge (%)
Numberoftestcases
RT ART (a) Block coverage onCol
80 90 100 e de cision cover age (%) 70 80 90 100
1 10 100 1000
Av e ra g e de cision cover age (%)
Numberoftestcases
RT ART (b) Decision coverage onCol
80 90 100 ge c Ͳ uses cover age (%) 60 70 80 90 100
1 10 100 1000
Av e ra g e c Ͳ uses cover age (%)
Numberoftestcases
RT ART (c) C-uses coverage onCol
80 90 100 g e p Ͳ uses co ve ra ge (%) 60 70 80 90 100
1 10 100 1000
Av e ra g e p Ͳ uses co ve ra ge (%)
Numberoftestcases
RT ART (d) P-uses coverage onCol
Fig. 4: Coverage percentages of ART and RT on the program Col
70 80 90 100 a ge block co ve ra ge (%) 50 60 70 80 90 100
1 10 100 1000
Av e ra g e block co ve ra ge (%)
Numberoftestcases
RT ART (a) Block coverage onComm
70 80 90 100 e de cision cover age (%) 50 60 70 80 90 100
1 10 100 1000
Av e ra g e de cision cover age (%)
Numberoftestcases
RT ART (b) Decision coverage onComm
70 80 90 100 ge c Ͳ uses cover age (%) 50 60 70 80 90 100
1 10 100 1000
Av e ra g e c Ͳ uses cover age (%)
Numberoftestcases
RT ART (c) C-uses coverage onComm
60 70 80 90 100 g e p Ͳ uses co ve ra ge (%) 40 50 60 70 80 90 100
1 10 100 1000
Av e ra g e p Ͳ uses co ve ra ge (%)
Numberoftestcases
RT ART (d) P-uses coverage onComm
90 100 a ge block co ve ra ge (%) 80 90 100
1 10 100 1000
Av e ra g e block co ve ra ge (%)
Numberoftestcases
RT ART (a) Block coverage onCrypt
80 90 e de cision cover age (%) 70 80 90
1 10 100 1000
Av e ra g e de cision cover age (%)
Numberoftestcases
RT ART (b) Decision coverage onCrypt
90 100 ge c Ͳ uses cover age (%) 80 90 100
1 10 100 1000
Av e ra g e c Ͳ uses cover age (%)
Numberoftestcases
RT ART (c) C-uses coverage onCrypt
90 100 g e p Ͳ uses co ve ra ge (%) 80 90 100
1 10 100 1000
Av e ra g e p Ͳ uses co ve ra ge (%)
Numberoftestcases
RT ART (d) P-uses coverage onCrypt
Fig. 6: Coverage percentages of ART and RT on the program Crypt
70 80 90 100 a ge block co ve ra ge (%) 50 60 70 80 90 100
1 10 100 1000
Av e ra g e block co ve ra ge (%)
Numberoftestcases
RT ART (a) Block coverage onLook
60 70 80 90 100 e de cision cover age (%) 40 50 60 70 80 90 100
1 10 100 1000
Av e ra g e de cision cover age (%)
Numberoftestcases
RT ART (b) Decision coverage onLook
70 80 90 100 ge c Ͳ uses cover age (%) 50 60 70 80 90 100
1 10 100 1000
Av e ra g e c Ͳ uses cover age (%)
Numberoftestcases
RT ART (c) C-uses coverage onLook
50 60 70 80 90 100 g e p Ͳ uses co ve ra ge (%) 30 40 50 60 70 80 90 100
1 10 100 1000
Av e ra g e p Ͳ uses co ve ra ge (%)
Numberoftestcases
RT ART (d) P-uses coverage onLook
60 70 80 90 100 a ge block co ve ra ge (%) 40 50 60 70 80 90 100
1 10 100 1000
Av e ra g e block co ve ra ge (%)
Numberoftestcases
RT ART (a) Block coverage onSort
50 60 70 80 90 100 e de cision cover age (%) 20 30 40 50 60 70 80 90 100
1 10 100 1000
Av e ra g e de cision cover age (%)
Numberoftestcases
RT ART (b) Decision coverage onSort
50 60 70 80 90 100 ge c Ͳ uses cover age (%) 20 30 40 50 60 70 80 90 100
1 10 100 1000
Av e ra g e c Ͳ uses cover age (%)
Numberoftestcases
RT ART (c) C-uses coverage onSort
40 50 60 70 80 90 g e p Ͳ uses co ve ra ge (%) 20 30 40 50 60 70 80 90
1 10 100 1000
Av e ra g e p Ͳ uses co ve ra ge (%)
Numberoftestcases
RT ART (d) P-uses coverage onSort
Fig. 8: Coverage percentages of ART and RT on the program Sort
50 60 70 80 90 100 a ge block co ve ra ge (%) 20 30 40 50 60 70 80 90 100
1 10 100 1000
Av e ra g e block co ve ra ge (%)
Numberoftestcases
RT ART (a) Block coverage onSpline
40 50 60 70 80 90 100 e de cision cover age (%) 10 20 30 40 50 60 70 80 90 100
1 10 100 1000
Av e ra g e de cision cover age (%)
Numberoftestcases
RT ART (b) Decision coverage onSpline
40 50 60 70 80 90 100 ge c Ͳ uses cover age (%) 10 20 30 40 50 60 70 80 90 100
1 10 100 1000
Av e ra g e c Ͳ uses cover age (%)
Numberoftestcases
RT ART (c) C-uses coverage onSpline
40 50 60 70 80 90 100 g e p Ͳ uses co ve ra ge (%) 10 20 30 40 50 60 70 80 90 100
1 10 100 1000
Av e ra g e p Ͳ uses co ve ra ge (%)
Numberoftestcases
RT ART (d) P-uses coverage onSpline
80 90 100 a ge block co ve ra ge (%) 70 80 90 100
1 10 100 1000
Av e ra g e block co ve ra ge (%)
Numberoftestcases
RT ART (a) Block coverage onTr
80 90 100 e de cision cover age (%) 60 70 80 90 100
1 10 100 1000
Av e ra g e de cision cover age (%)
Numberoftestcases
RT ART (b) Decision coverage onTr
80 90 100 ge c Ͳ uses cover age (%) 60 70 80 90 100
1 10 100 1000
Av e ra g e c Ͳ uses cover age (%)
Numberoftestcases
RT ART (c) C-uses coverage onTr
70 80 90 100 g e p Ͳ uses co ve ra ge (%) 50 60 70 80 90 100
1 10 100 1000
Av e ra g e p Ͳ uses co ve ra ge (%)
Numberoftestcases
RT ART (d) P-uses coverage onTr
Fig. 10: Coverage percentages of ART and RT on the program Tr
70 80 90 100 a ge block co ve ra ge (%) 50 60 70 80 90 100
1 10 100 1000
Av e ra g e block co ve ra ge (%)
Numberoftestcases
RT ART (a) Block coverage onUniq
60 70 80 90 100 e de cision cover age (%) 40 50 60 70 80 90 100
1 10 100 1000
Av e ra g e de cision cover age (%)
Numberoftestcases
RT ART (b) Decision coverage onUniq
50 60 70 80 90 100 ge c Ͳ uses cover age (%) 20 30 40 50 60 70 80 90 100
1 10 100 1000
Av e ra g e c Ͳ uses cover age (%)
Numberoftestcases
RT ART (c) C-uses coverage onUniq
50 60 70 80 90 100 g e p Ͳ uses co ve ra ge (%) 30 40 50 60 70 80 90 100
1 10 100 1000
Av e ra g e p Ͳ uses co ve ra ge (%)
Numberoftestcases
RT ART (d) P-uses coverage onUniq
blocks, decisions, c-uses, and p-uses) in the program have already been covered. Therefore, it is also
understandable that the coverage percentages of RT are approaching those of ART with the increase of
the number of test cases. Generally speaking, with the same number of test cases, ART is likely to cover
the program under test more thoroughly than RT. In other words, ART is a better testing method than RT
in terms of structure-based coverage. Thus, diversity across the input domain somehow incurs a higher
structure-based coverage.
B. Comparison of ART and RT based on fault-based coverage
The experimental results on mutation scores of ART and RT are reported in Fig. 12, where the x-axis
represents the size of test set in the logarithmic scale, and y-axis denotes the average mutation scores.
From Fig. 12, the following can be observed.
• When the number of test cases is small, ART has higher mutation scores than RT.
• The mutation scores of RT are approaching those of ART with an increase of the number of test
cases.
• When the number of test cases is large, ART and RT have similar mutation scores.
Similar to the results of structure-based coverage, ART is likely to kill more mutants than RT with the
same number of test cases, which implies that ART usually has higher fault-based coverage than RT. As
the size of the test set increases, most mutants can be killed sooner or later. Thus, it is not surprising that
RT has similar fault-based coverage as ART when there are a large number of test cases. In a word, ART
is better than RT with respect to the fault-based coverage.
V. THREATS TO VALIDITY
There are some potential threats to the validity of our study, as discussed in the following.
One major concern about internal validity is the implementations of the testing strategies. There might
exist some errors when we implemented RT and ART. However, it should be pointed out that the size,
and complexity of the implementations were very small, and low, respectively. The same implementations
have been extensively used in the authors’ previous studies [9], [11], [45], and we have carefully reviewed
the code for its correctness. Another threat is that we identied the infeasible program elements and the
equivalent mutants by executing 100,000 randomly-generated test cases. It is possible that some program
elements or mutants were mistakenly classied.
There are also several threats to the external validity of this study. First, we selected ten UNIX utility
programs as the subjects of our experiments. Although these programs have various characteristics, we
60 70 80 90 100 a ge mut a tion scor e (%) 40 50 60 70 80 90 100
1 10 100 1000
Av e ra g e mut a tion scor e (%)
Numberoftestcases
RT ART (a) Mutation scores onCal
50 60 70 80 90 100 a ge mut a tion scor e (%) 20 30 40 50 60 70 80 90 100
1 10 100 1000
Av e ra g e mut a tion scor e (%)
Numberoftestcases
RT ART (b) Mutation scores onCheckeq
80 90 100 a ge mut a tion scor e (%) 60 70 80 90 100
1 10 100 1000
Av e ra g e mut a tion scor e (%)
Numberoftestcases
RT ART (c) Mutation scores onCol
30 40 50 60 70 80 90 100 a ge mut a tion scor e (%) 0 10 20 30 40 50 60 70 80 90 100
1 10 100 1000
Av e ra g e mut a tion scor e (%)
Numberoftestcases
RT ART (d) Mutation scores onComm
98 99 100 a ge mut a tion scor e (%) 96 97 98 99 100
1 10 100 1000
Av e ra g e mut a tion scor e (%)
Numberoftestcases
RT ART (e) Mutation scores onCrypt
40 50 60 70 80 90 100 a ge mut a tion scor e (%) 10 20 30 40 50 60 70 80 90 100
1 10 100 1000
Av e ra g e mut a tion scor e (%)
Numberoftestcases
RT ART (f) Mutation scores onLook
60 70 80 90 100 a ge mut a tion scor e (%) 40 50 60 70 80 90 100
1 10 100 1000
Av e ra g e mut a tion scor e (%)
Numberoftestcases
RT ART (g) Mutation scores onSort
40 50 60 70 80 90 100 a ge mut a tion scor e (%) 10 20 30 40 50 60 70 80 90 100
1 10 100 1000
Av e ra g e mut a tion scor e (%)
Numberoftestcases
70 80 90 100
a
ge
mut
a
tion
scor
e
(%)
50 60 70 80 90 100
1 10 100 1000
Av
e
ra
g
e
mut
a
tion
scor
e
(%)
Numberoftestcases
RT ART (i) Mutation scores onTr
40 50 60 70 80 90 100
a
ge
mut
a
tion
scor
e
(%)
10 20 30 40 50 60 70 80 90 100
1 10 100 1000
Av
e
ra
g
e
mut
a
tion
scor
e
(%)
Numberoftestcases
RT ART (j) Mutation scores onUniq
Fig. 12: Mutation scores of ART and RT
programs. Secondly, the test case selection process depends on the knowledge and experience of the tester.
For example, to measure the distance, a tester needs to identify appropriate categories and choices for the
program under test. Such an identication process is somewhat subjective, and may not be straightforward.
The threats to the construct validity are related to the measurement. In this study, we measured the code
coverage of ART and RT based on ve criteria. There are various coverage criteria in the literature [48].
For a test set that is regarded as adequate with respect to one coverage criterion, it may not be adequate
in terms of another criterion. Having said that, the coverage criteria used in this study are representative,
and commonly used in practice. Thus, our analysis is broad-ranged.
VI. CONCLUSIONS,AND FUTURE WORK
RT is a popularly used technique for assessing software reliability. Its effectiveness in detecting software
failures can be enhanced if test cases are evenly spread over the input domain. Such an intuition of “even
spread” is the core of ART. Previous studies mainly focused on evaluating and comparing ART and
RT in terms of their failure-detection capabilities, and it has been shown that ART usually has smaller
F-measures than RT; that is, ART can detect the rst software failure with fewer test cases than RT.
In this study, we conducted a series of experiments to compare the effectiveness of ART and RT from
another perspective, the code coverage that they can achieve. We selected a particular ART algorithm,
namely FSCS-ART, and measured its structure-based and fault-based coverage on ten UNIX utility
programs. Because the subject programs have various types of inputs, a category-partition-based metric
was applied to measure the distance among test cases. Aligning with our previous study [9], this paper
shows that ART can achieve higher coverage on program structures, not only for programs with numeric
inputs, but also for those with non-numeric inputs. Besides the higher structure-based coverage, this study
also shows that ART normally kills more mutants than RT with the same number of test cases. In summary,
but also because of its higher structured-based and fault-based coverage. By achieving higher coverage
than RT with the same number of test cases, ART also improves the effectiveness of software reliability
estimation, and increases our condence in the reliability of the program under test even when no failure
is detected.
In this paper, we investigated the code coverage of one ART algorithm, FSCS-ART. There are various
ART algorithms in the literature, which evenly spread random test cases in different ways. It is interesting
to measure and compare the code coverage achieved by different ART algorithms. It is also worthwhile to
select more programs, especially those with a larger scale, and to conduct more extensive studies. Finally,
there exist various metrics to measure the distance among test cases [14], [25]. Further work could be
conducted to investigate to what extent various distance metrics can improve the code coverage of ART.
REFERENCES
[1] P. Ammann and J. Offutt,Introduction to Software Testing, Cambridge University Press, 2008.
[2] P. E. Ammann and J. C. Knight, “Data diversity: An approach to software fault tolerance,”IEEE Transactions on Computers, vol. 37, no. 4, pp. 418–425, 1988.
[3] D. L. Bird and C. U. Munoz, “Automatic generation of random self-checking test cases,”IBM Systems Journal, vol. 22, no. 3, pp. 229–245, 1983.
[4] P. G. Bishop, “The variation of software survival times for different operational input proles,”Proceedings of the 23rd International Symposium on Fault-Tolerant Computing (FTCS-23), 1993, pp. 98–107.
[5] K. P. Chan, T. Y. Chen, and D. Towey, “Forgetting test cases,”Proceedings of the 30th Annual International Computer Software and Applications Conference (COMPSAC 2006), 2006, pp. 485–492.
[6] K. P. Chan, T. Y. Chen, and D. Towey, “Restricted random testing: Adaptive random testing by exclusion,”International Journal of Software Engineering and Knowledge Engineering, vol. 16, no. 4, pp. 553–584, 2006.
[7] M.-H. Chen, M. R. Lyu, and W. E. Wong, “Effect of code coverage on software reliability measurement,”IEEE Transactions on Reliability, vol. 50, no. 2, pp. 165–170, 2001.
[8] T. Y. Chen, G. Eddy, R. G. Merkel, and P. K. Wong, “Adaptive random testing through dynamic partitioning,”Proceedings of the 4th International Conference on Quality Software (QSIC 2004), 2004, pp. 79–86.
[9] T. Y. Chen, F.-C. Kuo, H. Liu, and W. E. Wong, “Does adaptive random testing deliver a higher condence than random testing?”
Proceedings of the 8th International Conference on Quality Software (QSIC 2008), 2008, pp. 145–154.
[10] T. Y. Chen, F.-C. Kuo, R. G. Merkel, and T. H. Tse, “Adaptive random testing: The ART of test case diversity,”The Journal of Systems and Software, vol. 83, no. 1, pp. 60–66, 2010.
[11] T. Y. Chen, F.-C. Kuo, and Z. Q. Zhou, “On favorable conditions for adaptive random testing,”International Journal of Software Engineering and Knowledge Engineering, vol. 17, no. 6, pp. 805–825, 2007.
[12] T. Y. Chen, H. Leung, and I. K. Mak, “Adaptive random testing,”Proceedings of the 9th Asian Computing Science Conference, 2004, pp. 320–329.
[13] T. Y. Chen, T. H. Tse, and Y. T. Yu, “Proportional sampling strategy: A compendium and some insights,”The Journal of Systems and Software, vol. 58, no. 1, pp. 65–81, 2001.
[14] I. Ciupa, A. Leitner, M. Oriol, and B. Meyer, “ARTOO: Adaptive random testing for object-oriented software,”Proceedings of the 30th International Conference on Software Engineering (ICSE 2008), 2008, pp. 71–80.
[16] M. E. Delamaro and J. C. Maldonado, “Proteum: A tool for the assessment of test adequacy for C programs,”Proceedings of the Conference on Performability in Computing Systems (PCS 1996), 1996, pp. 79–95.
[17] R. A. DeMillo, R. J. Lipton, and F. G. Sayward, “Hints on test data selection: Help for the practicing programmer,”IEEE Computer, vol. 11, no. 4, pp. 31–41, 1978.
[18] J. W. Duran and S. C. Ntafos, “An evaluation of random testing,” IEEE Transactions on Software Engineering, vol. 10, no. 4, pp. 438–444, 1984.
[19] J. E. Forrester and B. P. Miller, “An empirical study of the robustness of Windows NT applications using random testing,”Proceedings of the 4th USENIX Windows Systems Symposium, 2000, pp. 59–68.
[20] P. Godefroid, N. Klarlund, and K. Sen, “DART: Directed automated random testing,”Proceedings of ACM SIGPLAN Conference on Programming Language Design and Implementation (PLDI 2005), 2005, pp. 213–223.
[21] J. C. Huang, “An approach to program testing,”ACM computing surveys, vol. 7, no. 3, pp. 144–128, 1975.
[22] M. Hutchins, H. Foster, T. Goradia, and T. Ostrand, “Experiments on the effectiveness of dataow- and controlow-based test adequacy
criteria,”Proceedings of the 16th International Conference on Software Engineering (ICSE 1994), 1994, pp. 191–200.
[23] F.-C. Kuo, “On adaptive random testing,” PhD thesis, Faculty of Information and Communications Technologies, Swinburne University
of Technology, 2006.
[24] J. W. Laski and B. Korel, “A data ow oriented program testing strategy,”IEEE Transactions on Software Engineering, vol. 9, no. 3, pp. 347–354, 1983.
[25] Y. Lin, X. Tang, Y. Chen, and J. Zhao, “A divergence-oriented approach to adaptive random testing of Java programs,”Proceedings of the 24th IEEE/ACM International Conference on Automated Software Engineering (ASE 2009), 2009, pp. 221–232.
[26] Y. Liu and H. Zhu, “An experimental evaluation of the reliability of adaptive random testing methods,” Proceedings of The 2nd International Conference on Secure System Integration and Reliability Improvement (SSIRI 2008), 2008, pp. 24–31.
[27] A. P. Mathur, Foundations of Software Testing, Addison-Wesley Professional, 2008.
[28] J. Mayer, “Lattice-based adaptive random testing,”Proceedings of the 20th IEEE/ACM International Conference on Automated Software Engineering (ASE 2005), 2005, pp. 333–336.
[29] T. Menzies and B. Cukic, “When to test less,”IEEE Software, vol. 17, no. 5, pp. 107–112, 2000.
[30] R. G. Merkel, “Analysis and Enhancements of Adaptive Random Testing,” PhD thesis, School of Information Technology, Swinburne
University of Technology, 2005.
[31] B. P. Miller, L. Fredriksen, and B. So, “An empirical study of the reliability of UNIX utilities,”Communications of the ACM, vol. 33, no. 12, pp. 32–44, 1990.
[32] B. P. Miller, D. Koski, C. P. Lee, V. Maganty, R. Murthy, A. Natarajan, and J. Steidl, “Fuzz revisited: A re-examination of the reliability
of UNIX utilities and services,” Technical Report CS-TR-1995-1268, University of Wisconsin, 1995.
[33] G. J. Myers,The Art of Software Testing, second ed. John Wiley and Sons, 2004, Revised and updated by T. Badgett and T. M. Thomas with C. Sandler.
[34] T. J. Ostrand and M. J. Balcer, “The category-partition method for specifying and generating functional tests,”Communications of the ACM, vol. 31, no. 6, pp. 676–686, 1988.
[35] M. Pezze and M. Young, Software Testing and Analysis: Process, Principles and Techniques, Wiley, 2007.
[36] J. Regehr, “Random testing of interrupt-driven software,”Proceedings of the 5th ACM International Conference on Embedded Software (EMSOFT 2005), 2005, pp. 290–298.
[37] G. Rothermel, R. H. Untch, C. Chu, and M. J. Harrold, “Prioritizing test cases for regression testing,”IEEE Transactions on Software Engineering, vol. 27, no. 10, pp. 929–948, 2001.
[38] A. Shahbazi, A. F. Tappenden, and J. Miller, “Centroidal voronoi tessellations - a new approach to random testing,”IEEE Transactions on Software Engineering. in press.
[40] Telcordia Technologies, “Telcordia software visualization and analysis toolsuite (χSuds),” 2001.
[41] H. Tijms, Understanding Probability: Chance Rules in Everyday Life, Cambridge University Press, 2004.
[42] M. van der Meulen, P. Bishop, and M. Revilla, “An exploration of software faults and failure behaviour in a large population of
programs,”Proceedings of the 15th International Symposium on Software Reliability Engineering (ISSRE 2004), 2004, pp. 101–112. [43] L. J. White and E. I. Cohen, “A domain strategy for computer program testing,”IEEE Transactions on Software Engineering, vol. 6,
no. 3, pp. 247–257, 1980.
[44] W. E. Wong, J. R. Horgan, S. London, and A. P. Mathur, “Effect of test set size and block coverage on the fault detection effectiveness,”
Proceedings of the 5th International Symposium on Software Reliability Engineering (ISSRE 1994), 1994, pp. 230–238.
[45] W. E. Wong, J. R. Horgan, S. London, and A. P. Mathur, “Effect of test set minimization on fault detection effectiveness,” Software-Practice and Experience, vol. 28, no. 4, pp. 347–369, 1998.
[46] W. E. Wong, J. R. Horgan, S. London, and A. Pasquini, “Test set size minimization and fault detection effectiveness: A case study in
a space application,”The Journal of Systems and Software, vol. 48, no. 2, pp. 79–89, 1999.
[47] T. Yoshikawa, K. Shimura, and T. Ozawa, “Random program generator for Java JIT compiler test system,”Proceedings of the 3rd International Conference on Quality Software (QSIC 2003), 2003, pp. 20–24.
[48] H. Zhu, P. A. V. Hall, and J. H. R. May, “Software unit test coverage and adequacy,” ACM computing surveys, vol. 29, no. 4, pp. 366–427, 1997.
Tsong Yueh Chen is a Chair Professor of Software Engineering at the Faculty of Information and Communication Technologies in Swinburne University of Technology. He received his PhD degree in Computer Science from The University of Melbourne; MSc, and DIC in Computer Science from Imperial College of Science and Technology; and BSc, and MPhil. from The University of Hong Kong. His current research interests include software testing and debugging, software maintenance, and software design.
Fei-Ching Kuo is a Senior Lecturer at the Faculty of Information and Communication Technologies in Swinburne University of Technology. She received her PhD degree in Software Engineering, and BSc. (Honors) in Computer Science, both from the Swinburne University of Technology, Australia. Her current research interests include software analysis, testing, debugging, and project management.
Huai Liu is a Research Associate at the Faculty of Information and Communication Technologies at Swinburne University of Technology. He received his PhD degree in Software Engineering from Swinburne University of Technology, Australia; and M.Eng. in Communications and Information Systems, and B.Eng. in Physioelectronic Technology from Nankai University, China. His current research interests include software testing, web services, software architecture design, and end-user software engineering.