Extending the physics studied by ECE on ITER
V.S. Udintsev1, G. Vayakis1, D. Bora1, M.-F. Direz1, A. Encheva1, T. Giacomin1, M.A. Henderson1, K.M. Patel1, M. Portalès1, A. Prakash1, J.A. Snipes1, C.I. Walker1, M.J. Walsh1, C. Watts1,
M.E. Austin2, H. Pandya3, G. Hanson4, E. Popova5, P. Sanchez6, D. Shelukhin7, G.D. Conway8, J.W. Oosterbeek9
1ITER Organization, Route de Vinon sur Verdon, 13115 Saint Paul Lez Durance, France 2Fusion Research Center, University of Texas at Austin, Austin, TX, USA
3Institute for Plasma Research, Bhat, Gandhinagar-382 428, India 4ORNL, Oak Ridge, USA
5Russian Federation Domestic Agency, Moscow, Russia
6Fusion for Energy, ITER Department, Diagnostic group, Barcelona, Spain 7NFI, RRC Kurchatov Institute, Moscow, Russian Federation
8ITPA MWG, IPP Garching, Germany
9Eindhoven University of Technology, The Netherlands
Abstract. The Electron Cyclotron Emission (ECE) diagnostic provides essential information for plasma operation and for establishing performance characteristics in ITER. Recently, the design of the ITER ECE diagnostic has been taken through the conceptual design review and now entering the detailed design phase [1, 2]. The baseline ECE system on ITER permits measurements of both the X- and O-mode radiation in the frequency range from 70 GHz up to 1 THz along two lines-of-sight, perpendicular and oblique at about 10 degrees, in the equatorial port. The system as planned meets the ITER measurement requirements. Nevertheless, there are several other mm-wave diagnostics in ITER, such as HFS, LFS and plasma position reflectometry, as well as Collective Thomson scattering system, whose transmission lines allow, in principle, additional measurements of parts of the ECE spectrum with upgrades of their back-ends, improvements in filtering and/or additional receivers. A discussion of whether and how supposedly to enable such ECE measurements is given here.
1 Introduction
ITER Electron Cyclotron Emission (ECE) baseline system primary objective is to provide the measurement of electron temperature with good spatial and temporal resolutions [1-3]. Secondary objectives are to obtain information on non-thermal electron populations and the power loss due to ECE. The baseline ECE system on ITER permits measurements of both the X- and O-mode radiation in the frequency range from 70 GHz up to 1 THz along two lines-of-sight, perpendicular and oblique at about 10 degrees, in the equatorial port.
C
The system as planned meets the ITER measurement requirements. The advantages of the main ECE lines are: they are absolutely calibrated; they are O-X conversion optimized; they are stable in all bands (including higher harmonics which will be discussed in [1] and [2]); they have minimum parasitic signals, such as reflectometry leaks and ECH. Extra observations discussed here are almost by definition worse, so they can only be used to supplement the (solid) main measurements when their systems are not temporarily used for the intended function. Therefore, the discussion here is mainly focused on the assessment of the various transmission lines of other microwave diagnostic which may expand the physics programme during ITER operation and deliver some additional knowledge in our understanding of the processes in the plasma.
In particular, a possibility to resolve the mode numbers of the MHD or particle-driven structures exists thanks to different toroidal and poloidal location of reflectometry antennas. Another enabling opportunity is the implementation of additional observation lines-of-sight along ECH beams, which, when operationally available could enhance the understanding of ECE losses and allow methods of NTM feedback alternative to those considered for the baseline [4]. Simultaneous observation of the ECE from LFS and HFS of the tokamak by reflectometry antennas should provide additional information about non-thermal electron populations in the plasma, thus complementing the measurement performed by the baseline oblique ECE line-of-sight.
In the paper, the impact of additional capabilities to measure ECE on ITER on the measurement requirements will also be discussed.
2 Microwave diagnostics in ITER
Beside baseline ECE diagnostic [1-3], there are other systems in ITER which may permit the measurement of the Electron Cyclotron Emission from the plasma. Reflectometry on ITER will allow measurements of core and edge density profiles, MHD, ELM activity, turbulence and the plasma position. Both O- and X-mode reflectometry are planned in ITER covering the frequency range between 15 – 180 GHz. Antennas for different reflectometry systems are placed at the HFS (main plasma HFS and the plasma position reflectometers) and LFS (the plasma position reflectometers) of the vacuum vessel; similar to the baseline ECE, the main plasma LFS reflectometry system is integrated in the equatorial port. Unlike baseline ECE, ITER HFS and plasma position reflectometry have interfaces with the vacuum vessel. The in-vessel waveguides are directly welded on the vacuum vessel surface and are protected by the blanket from the plasma side.
Collective Thomson scattering (CTS) system on ITER is planned to be integrated in the equatorial port, too; the function of this diagnostic will be to measure fast ion distribution (100 keV to 3.5 MeV, a/10 ~ 20 cm, 100 ms) near perpendicular to the magnetic field at different radii. Unlike baseline ECE and reflectometry, CTS has a launching branch which requires several-MW RF power source around 60 GHz from a gyrotron (up to 2 MW power injected into the plasma are planned).
3 Contribution to ECE measurements: possibilities and limitations
The performance of the transmission lines (TLs) and the design of the front-ends are crucial to ensure that the requirements for the measurements of the plasma parameters are met. Characterisation of the losses, O-X conversion and stability of the prototypes in the ECE range, would be required.
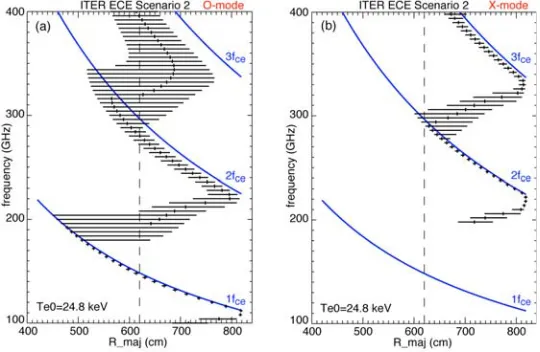
Fig. 1.Emission widths for ECE frequencies covering harmonics 1-3 for ITER Scenario 2 for (a) O-mode and (b) X-O-mode polarizations.
3.1 High Field Side Reflectometry transmission lines
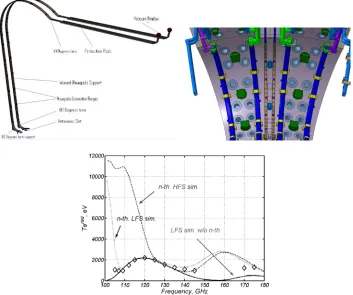
The in-vessel waveguides of the HFS Reflectometry system are directly welded on the vacuum vessel surface and are protected by the blanket from the plasma side (Fig. 2, top). The antennas which are located in the equatorial midplane at the HFS of the tokamak are designed to view the plasma through the cut-outs in the blanket and the first wall. Because of the complexity of waveguide routings and introduction of bends near the end of the antenna end and near the entrance to the upper port for HFS and the plasma position reflectometers, the target of the design activity is to ensure the acceptable power losses and low mode conversion loss.
The in-vessel waveguides for HFS reflectometry are foreseen to have the inner size of 20×12 mm, 1 mm thick wall, made of stainless steel with polished inner surface, additional nickel cover to get good copper adhesion and about 10 μm copper layer inside. It is planned to use the same waveguides for X-mode observation in frequency band 10-98 GHz and O-mode observations in the band 15-155 GHz, so the transmission line is optimized for these frequencies. The ECE-relevant measurements can be performed starting from 70 GHz; however, with increased frequency, the transmission line losses will increase, too. Outside the vacuum vessel, at some point, a transition to the oversized waveguides from rectangular in-vessel like ones is foreseen to minimize the losses in the TL. For the operational frequency bandwidth of the reflectometer (70 – 155 GHz), the estimated (pessimistic) losses in the TL (including ohmic, mode conversion and losses on the vacuum windows) are ranging between -15 and -20 dB. These numbers are close to those foreseen for the baseline ECE; however, the calibration of the reflectometry lines with the built-in hot source is not foreseen. Therefore, there will be only a possibility for occasional check with in-vessel calibration source during the tokamak shutdown periods, or to perform the cross-calibration on the baseline ECE or on the core Thomson scattering in the ohmic phase of the discharge and for optivally thick plasmas, under the assuption that no non-thermal electron populations are present in the plasma.
studies on RTP [4], TEXTOR [5-6] and TCV [7] tokamaks. Figure 2 (bottom) gives an example from TEXTOR [6] on the difference of ECE spectra measured and modeled for LFS and HFS in presence of non-thermal electron population. Together with the oblique line-of-sight in the baseline ECE, the observation of ECE radiation from the HFS enables additional and very useful diagnostic potential to measure the properties of non-thermal electron populations in ITER.
Fig. 2. Top: in-vessel waveguides of the HFS Reflectometry system on ITER; bottom: example of the ECE spectra as viewed from LFS and HFS with and without non-thermal population in the plasma
(TEXTOR, figure is taken from Ref. [6]).
3.2 Low Field Side Reflectometry transmission lines
The antenna arrangement allows accounting for a change in the plasma height if used for ECE measurements. Plasma height usually varies with operating scenario. For example, the following numbers are foreseen for some scenarios: recent H-mode scenarios, Z ~ 520 mm; original scenario 2, Z ~ 680 mm; L-mode, Z ~ 504 mm; half-field scenario, Z~ 660 mm. Moreover, the poloidal separation of antenna pairs enables the measurement of the poloidal velocity component of MHD and turbulence (subject to the poloidal sample volume in the plasma, which restricts the sensitivity to k_pol). Thus, the LFS-R transmission lines in principle provides some possibility for the Te-profile measurement and for the dimensionless NTM temperature amplitude determination; however, the antenna pattern will be different from this of the baseline ECE, as there are no focusing elements planned between the waveguide aperture and the first wall opening. The total transmission line losses (Tx) in the frequency range from 70 to 220 GHz (as estimated for the reflectometry needs) are low and varying between -4 and -5 dB (for the total length of about 40 m). The losses below -6 dB are expected up to 350 GHz. However, the corrugated waveguide performance is degraded if one goes above the Bragg scattering limit at 350 GHz; the TL losses above this frequency are increasing drastically [2]. The LFS-R TL will be evacuated or purged with a dry gas to eliminate the mm-wave power absorption by the water vapour.
The estimated ECE power collected by the LFS-R is given for reference purpose in Table 1 for several frequency bands relevant for ECE measurements. Note that -30 dBm corresponds to 0.001 mW, and -10 dBm corresponds to 0.1 mW. This is sufficient to measure ECE emission with 5% statistical error and less than 10 ms time resolution (for the typical 5 GHz bandwidth).
Table 1. ECE power collected by LFS-R diagnostic with typical losses for several waveguide bandwidths. Frequencies
(GHz) and WG-Band
75-92
W 92-110 W 110-140D 140-165D
Total TL Loss
(TX only) (dB) -4 -4 -4 -4
ECE Power in
full band (dBm) -14 -15 -13 -16
ECE Power in
1.5 GHz (dBm) -24 -25 -27 -30
3.3 Plasma Position Reflectometry transmission lines
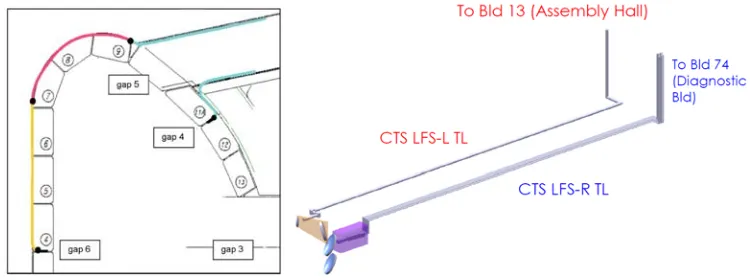
The primary function of the Plasma Position Reflectometry (PPR) is to provide measurements of plasma edge density, as a function of plasma-wall distance, at or near four defined locations known as gap 3, gap 4, gap 5 and gap 6 (Fig. 3, left). This system contains in-vessel transmission lines and antennas similar to these of the HFS Reflectometry, as well as in-port plug transmission lines and antennas in the Upper Port 1 and Equatorial Port 10. Thus, both HFS and LFS EC emission measurements can be in principle enabled by the diagnostic transmission line. The PPR measurement frequency range is from 15 to 60 GHz; however, the TL design allows achieving the same frequencies as for the HFS Reflectometry. Thus, for the O-mode ECE measurement for scenario 2 with Te(0) = 25 keV, an access to the plasma core could be enabled by an operational upgrade with a beam splitter and separate receiver. Also, these lines are not always optimized for low O-X conversion. Again, a cross-calibration versus other temperature diagnostics will be required to perform ECE measurement through the transmission line of the plasma position reflectometry.
3.4 Collective Thomson scattering transmission lines (receiver)
different distance from the mirror and collects scattered radiation from a different radial position in the plasma. Similarly to the baseline ECE, the collected radiation is then transmitted to the diagnostic area using the waveguide transmission line. A possibility to use the hot calibration source similar to this of the baseline ECE is currently under discussion. Thus, the CTS receiver branch is suited for some ECE measurements (only when main measurements foreseen for CTS are not running) and, potentially, could contribute to the non-thermal electron population studies due to the slight toroidal inclination of the CTS receiver lines-of-sight.
Fig. 3. Poloidal location of gaps for the Plasma Position Reflectometry (left), and the preliminary layout of the ITER CTS diagnostic (right).
4 Summary
Several microwave diagnostics in ITER can be used for ECE measurements to enlarge the opportunity of physics study. However, none of these systems will have a capability to meet the full set of measurement requirements as they are met by the baseline ECE diagnostic. The main driver for the reliable ECE measurement is the transmission line performance (ohmic, mode conversion losses etc.); depending on the type of the waveguide or front-end used in one or another diagnostic, some limitations to the observable range of frequencies are obvious. The transmission lines discussed here will allow access to the 1st harmonic O-mode and the 2nd harmonic X-mode in ITER, thus enabling a possibility for some back-up electron temperature profile and NTM temperature amplitude measurements. The latter can also be achieved by implementation of the in-line ECE system in the ECH Upper Launcher [9]. Fourier transform based ECE systems for real-time tearing mode control is currently under consideration to be included as a part of the ECH system. If the concept is proven, it would give fast and reliable tool to suppress the NTM in ITER before it reaches its critical size.
The views and opinions expressed herein do not necessarily reflect those of the ITER Organization.
References
1. M. Austin et al., this Workshop (2012) 2. H. Pandya et al., this Workshop (2012)
3. V.S. Udintsev et al.,Fusion Sci. Technol., 59, 678 (2011)
4. J.F.M. van Gelder et al., Plasma Phys. Control. Fusion, 40, 1185 (1998) 5. V.S. Udintsev et al., Rev. Sci. Instrum., 72, 359 (2001)
6. V.S. Udintsev, PhD thesis, University of Utrecht (2003)
7. P. Blanchard et al., Plasma Phys. Control. Fusion, 44, 2231 (2002)