Available Online at www.ijcsmc.com
International Journal of Computer Science and Mobile Computing
A Monthly Journal of Computer Science and Information Technology
ISSN 2320–088X
IMPACT FACTOR: 5.258IJCSMC, Vol. 5, Issue. 5, May 2016, pg.861 – 868
Content Based Image Retrieval Using
DWT and Modified K-Means
Koram Singh
1
, Suman Rani
2
1
[email protected], 2 [email protected]
P. G. Student, Department of E.C.E, Baba Farid College of Engineering, Bathinda, India Assistant Professor, Department of E.C.E, Baba Farid College of Engineering, Bathinda, India
Abstract—In this thesis We proposed algorithms on the basis of texture, shape,and color based feature extraction and matching of color and texture.We will use concept of Discrete Wavelet transform for euclidian distance and calculate clusters using modified K-Means clustering.We extract texture,shape, and color snd finaly meauser similarity between query image and database image. Integrated approach retrive more accurate image, reduce semantic gap between local and high level features.Modified K-Means takes less time of computation in comparison to other algorithms.It is more optimized for small as well as large database.
Keywords— Content Based Image Retrieval (CBIR), DWT,Modified K-Means, Euclidean distance
I. INTRODUCTION
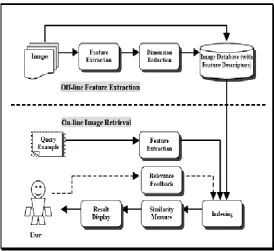
Figure: 1.1 CBIR Architecture
In the past decade, more and more information has been published in computer readable formats. In the meanwhile, much of the information in older books, journals and newspapers has been digitized and made computer readable. Big archives of films, music, images, satellite pictures, books, newspapers, and magazines have been made accessible for computer users. Internet makes it possible for the human to access this huge amount of information.
1.2 Text-Based and Content-Based Image Retrieval
In text-based retrieval, images are indexed using keywords, subject headings, or classification codes, which in turn are used as retrieval keys during search and retrieval [01]. Text-based retrieval is non-standardized because different users employ different keywords for annotation. Text descriptions are sometimes subjective and incomplete because they cannot depict complicated image features very well. Examples are texture images that cannot be described by text.
1.3 Principle of CBIR
Content-based retrieval uses the contents of images to represent and access the images. A Typical content-based retrieval system is divided into off-line feature extraction and online image retrieval. A conceptual framework for content-based image retrieval is illustrated in Figure 1.1 [02]. In off-line stage, the system automatically extracts visual attributes (color, shape, texture, and spatial information) of each image in the database based on its pixel values and stores them in a different database within the system called a feature database. The feature data (also known as image signature) for each of the visual attributes of each image is very much smaller in size compared to the image data, thus the feature database contains an abstraction (compact form) of the images in the image database. One advantage of a signature over the original pixel values is the significant compression of image representation.
In on-line image retrieval, the user can submit a query example to the retrieval system in search of desired images. The system represents this example with a feature vector. The distances (i.e., similarities) between the feature vectors of the query example and those of the media in the feature database are then computed and ranked.
1.4 Fields of Application
Image retrieval based on content is extremely useful in a plethora of applications such as publishing and advertising, historical research, fashion and graphic design, architectural and engineering design, crime prevention, medical diagnosis, geographical information and remote sensing systems, etc. [03]. A typical image retrieval application example is a design engineer who needs to search his organization database for design projects similar to that required by his clients, or the police seeking to confirm the face of a suspected criminal among faces in the database of renowned criminals. In the commerce department, before trademark is finally approved for use, there is need to find out if such or similar ones ever existed. In hospitals, some ailments require the medical practitioner to search and review similar X-rays or scanned images of a patient before proffering a solution.
1.5 Image Retrieval Problem
In this computer age, virtually all spheres of human life including commerce, Government, academics, hospitals, crime prevention, surveillance, engineering, architecture, journalism, fashion and graphic design, and historical research use images for efficient services. The police maintain image database of criminals, crime scenes, and stolen items. In the medical profession, X-rays and scanned image database are kept for diagnosis, monitoring, and research purposes. In publishing and advertising, journalists create image databases for various events and activities such as sports, buildings, personalities, national and international events, and product advertisements. In historical research, image databases are created for archives in areas that include arts, sociology, and medicine.
1.6 Content Based Image Retrieval
The search for similar images in large-scale image databases has been an active research area in the last couple of years. A very promising approach is content based image retrieval (CBIR). In such systems, images are typically represented by approximations of their contents. A detailed description of some feature extraction techniques is introduced in section 3.1. A metric is defined to calculate the actual similarity between two of these points. An overview of common metrics is given in section 3.2. In the basic model shown in Figure 3.1 [04], the search for images similar to a query image „q‟ results in finding the „k‟ nearest neighbours of „q‟. The model can be extended to support more complex queries that can consist of more than one query image and more than one feature type.
Figure 1.3: The Nearest Neighbour in Two Dimensions.
For fast retrieval, an indexing structure based on the query model is developed. In section 1.3, we present some of the indexing structures that are commonly used in CBIR systems.
1.7 Feature Extraction
Feature extraction is a means of extracting compact but semantically valuable information from images. This information is used as a signature for the image. Similar images should have similar signatures. The white color and the texture of the building are characteristic properties. In a similar way, the sky can be described by its blue color. Furthermore, we can take the size of the objects in the image into account.
Representation of images needs to consider which features are most useful for representing the contents of images and which approaches can effectively code the attributes of the images.
1.7.1 Color
One of the most important features visually recognized by humans in images is color .Several color spaces, such as RGB, HSV, CIE L*a*b, and CIE L*u*v, have been developed for different purposes [05]. Therefore, the RGB color space, a widely used system for representing color images, is not suitable for CBIR because it is a perceptually non-uniform and device-dependent system [06]. The most frequently used technique is to convert color representations from the RGB color space to the HSV, CIE L*u*v, or CIE L*a*b color spaces with perceptual uniformity. The HSV color space is an intuitive system, which describes a specific color by its hue, saturation, and brightness values. This color system is very useful in interactive color selection and manipulation. The CIE L*u*v and CIE L*a*b color spaces are both perceptually uniform systems, which provide easy use of similarity metrics for comparing color. After selecting a color space, an effective color descriptor should be developed in order to represent the color of the global or regional areas. Several color descriptors have been developed from various representation schemes, such as color histograms [22], color moments [23], color edge [24], and color texture [25].
Color Histogram
The most commonly used method to represent color feature of an image is the color histogram. The bars in a color histogram are named as bins and they represent the x-axis. A GCH takes color histogram of whole image and thus represents information regarding the whole image, without concerning color distribution of regions in the image. An example of a color histogram in the HSV color space can be seen with the image in Figure 3.3.
a) Sample Image. b) Corresponding Color Histogram. Figure 1.5: Sample Image and Its Corresponding Color Histogram.
1.7.2 Texture
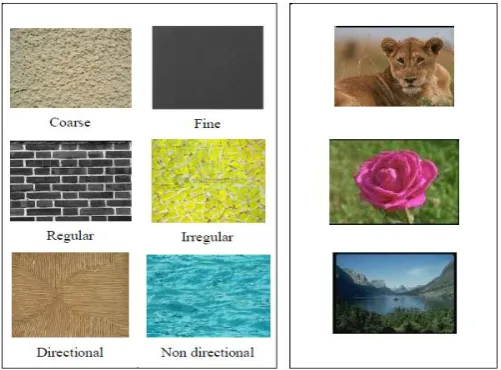
In the field of computer vision and image processing, there is no clear-cut definition of texture. However, texture can be thought of as repeated patterns of pixels over a spatial domain, of which the addition of noise to the patterns and their repetition frequencies results in textures that can appear to be random and unstructured. The different texture properties as perceived by the human eye are, for example, regularity, directionality, smoothness, and coarseness.
Figure 1.6: Examples of Simple and Complex Texture Images.
Statistical Methods
Statistical methods analyze the spatial distribution of grey values by computing local features at each point in the image, and deriving a set of statistics from the distribution of the local features. They include co-occurrence matrix representation; statistical moments, gray level differences, autocorrelation function, and grey level run lengths. The most commonly used statistical method is the Gray-level Co-occurrence Matrix (GLCM) [07]. It is a two-dimensional matrix of joint probabilities Pd,r(i, j) between pairs of pixels, separated by a distance, d, in a given direction, r. It is popular in texture description and is based on the repeated occurrence of some gray level configuration in the texture; this configuration varies rapidly with distance in fine textures and slowly in coarse textures applications in recognizing fabric defects, and in rock texture classification and retrieval [08].
Model Based Approaches
Model-based texture methods try to capture the process that generated the texture. By using the model-based features, some part of the image model is assumed and an estimation algorithm is used to set the parameters of the model to yield the best fit [16]. To describe a random field, assume the image is modeled as a function f (r, ω), where r is the position vector representing the pixel location in the 2-D space and ω is a random parameter. For a given value of r, f (r, ω) is a random variable (because ω is a random variable). Once a specific texture ω is selected, f (r, ω) is an image, which is a function over the two-dimensional grid indexed by r. Function f (r, ω) is called as a random field. There are currently three major model based methods: Markov random fields by Dubes and Jain [17], fractals by Pentland [18], and the multi-resolution autoregressive features introduced by Mao and Jain [19].
1.7.3 Shape
One of the common used features in CBIR systems is the shape. Shape of an object is the characteristic surface configuration as represented by the outline or contour. Shape recognition is one of the modes through which human perception of the environment is executed. It is important in CBIR because it corresponds to region of interests in images. Shape feature representations are categorized according to the techniques used. They are boundary-based and region-based [08]. Region moment representations interpret a normalized gray level image function as a probability density of a 2-D random variable. Hu [09].
1.8 Similarity Measure
The similarity between two images (represented by their feature values) is defined by a similarity measure. Selection of similarity metrics has a direct impact on the performance of content-based image retrieval. The kind of feature vectors selected determines the kind of measurement that will be used to compare their similarity [02].
1.9 Indexing Structures
When manipulating massive databases, a good indexing is a necessity. Processing every single item in a database when performing queries is extremely inefficient and slow. When working with text-based documents, creating good indexes is not very difficult. Raw image data is non-index able as such, so the feature vectors must be used as the basis of the index. Popular multi dimensional indexing methods include the R-tree and the R*-tree algorithms [02]. The Self Organizing Map (SOM) is also one of the indexing structures [10]. The SOM is trained to match the shape of the data in the feature space.
1.10 Region-Based Image Retrieval
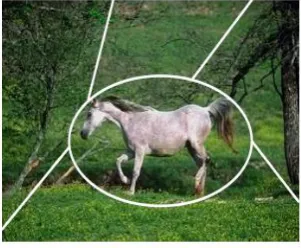
In traditional content based image retrieval, we take a signature for the whole image, and this is known as global features. In most cases, an image does not only contain one object. A simple approach is to manually divide the image into predefined regions, e.g., one region in the image centre and four background regions as in Figure 3.5. An image that is not suited for the partitioning cannot be found easily. Newer approaches, therefore, partition the image dynamically. They use a segmentation algorithm to partition the image into homogenous regions [11, 12, and 13].
Figure 1.7: Image with Static Regions. 1.10.1 Image Segmentation
pixel in an image such that pixels with the same label share certain visual characteristics. The result of image segmentation is a set of segments that collectively cover the entire image, or a set of contours extracted from the image. Groups of pixels in each region are similar with respect to some characteristic or computed property, such as color, intensity, or texture. Adjacent regions are significantly different with respect to the same characteristic(s) [14].
1.10.2 Region Based Features
For each of the regions in an image one or more features are extracted that are taken as a signature for that region. The feature descriptors we have discussed in section 3.1 can be extracted from each object instead of global image. The method for exacting color features per pixel is straightforward since the three color components defining the pixel‟s color intensity are usually used as its color features. For groups of pixels representing an image region, the color features are represented by the average and standard deviation of the components‟ color values.
1.10.3 Region Based Similarity Measure
For region-based extraction, different images may have different numbers of segmented regions. Hence, the total numbers of features extracted from different images are different in spite of the same number of features extracted from each region. One method was developed by Smith and Li [15], integrated region matching (IRM) [20] is another method to compare images with region based features. It computes weighted region-wise distances for the distance of two images. For example, if there are two images X = {x1, . . . ,xn} and Y = {y1, . . . , ym}, where xi and yi are region feature vectors for image X and Y, respectively. IRM first computes the region-wise Euclidean distances between regions of image X and Y and obtains an n × m distance matrix D, where the ijth element is Dij = ||xi–yj||.
1.11. Data Clustering Techniques
A. K-Means Clustering
It is a partition method technique which finds mutual exclusive clusters of spherical shape. It generates a specific number of disjoint, flat (non-hierarchical) clusters. Statistical method can be used to cluster to assign rank values to the cluster categorical data. Next, we compute the cluster means again, using the cases that are assigned to the clusters; then, we reclassify all cases based on the new set of means. We keep repeating this step until cluster means don‟t change between successive steps. Finally, we calculate the means of cluster once again and assign the cases to their permanent clusters. i. K-Means Algorithm Properties
There are always K clusters.
There is always at least one item in each cluster.
The clusters are non-hierarchical and they do not overlap. ii. K-Means Algorithm Process
The dataset is partitioned into K clusters and the data points are randomly assigned to the clusters resulting in clusters that have roughly the same number of data points.
For each data point:
Calculate the distance from the data point to each cluster.
If the data point is closest to its own cluster, leave it where it is. If the data point is not closest to its own cluster, move it into the closest cluster.
B. Hierarchical Clustering
A hierarchical method creates a hierarchical decomposition of the given set of data objects. Here tree of clusters called as dendrograms is built. Every cluster node contains child clusters, sibling clusters partition the points covered by their common parent. In hierarchical clustering we assign each item to a cluster such that if we have N items then we have N clusters. Find closest pair of clusters and merge them into single cluster. We have to repeat these steps until all items are clustered into K no. of clusters. It is of two types:
i. Agglomerative (bottom up)
Agglomerative hierarchical clustering is a bottom-up clustering method where clusters have sub-clusters, which in turn have sub-clusters, etc. It starts by letting each object form its own cluster and iteratively merges cluster into larger and larger clusters, until all the objects are in a single cluster or certain termination condition is satisfied. The single cluster becomes the hierarchy‟s root. For the merging step, it finds the two clusters that are closest to each other, and combines the two to form one cluster [21].
C. DBSCAN Clustering
DBSCAN (Density Based Spatial Clustering of Application with Noise).It grows clusters according to the density of neighbourhood objects. It is based on the concept of “density reachbility” and “density connect ability”, both of which depends upon input parameter- size of epsilon neighbourhood e and minimum terms of local distribution of nearest neighbours.
1.12 Experimental Results and Discussion
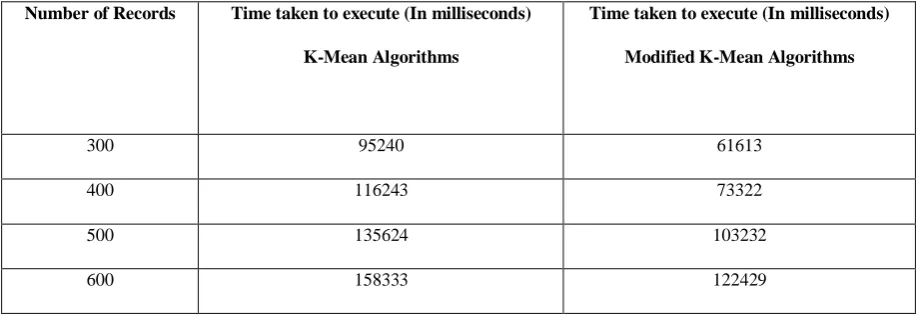
Number of Records Time taken to execute (In milliseconds)
K-Mean Algorithms
Time taken to execute (In milliseconds)
Modified K-Mean Algorithms
300 95240 61613
400 116243 73322
500 135624 103232
600 158333 122429
Table 1.8: Comparison between K-Mean and Modified K-Mean Algorithm
II. CONCLUSION
This paper proposes a modified version of the well-known k-means clustering algorithm. The modified algorithm maintains all important characteristic features of the basic k-means and at the same time eliminates the possibility of generation of empty clusters. It has been shown that the present algorithm is semantically equivalent to the serial k-means algorithm. A detailed comparison of this new algorithm with the basic k-means has been reported. Experimental results show that the proposed clustering scheme is able to solve the empty cluster problem, to a great extent, without any significant performance degradation. The use of wavelet based feature extraction scheme is presented.
R
EFERENCES[1] S. Gerard, C. Buckely, “Term-Weighting Approaches in Automatic Text Retrieval,” Information Processing and Management, vol. 24, no.5, pp. 513-523, Jan. 1988.
[2]F. Long, H. Zhang, H. Dagan, and D. Feng, “Fundamentals of content based image retrieval,” in D. Feng, W. Siu, H. Zhang (Eds.): “Multimedia Information Retrieval and Management. Technological Fundamentals and Applications,” Multimedia Signal Processing Book, Chapter 1, Springer-Verlag, Berlin Heidelberg New York, 2003, pp.1-26.
[3] V. Gudivada and V. Raghavan, “Content-based image retrieval systems,” IEEE Computer, vol. 28, no 9, pp18-22, Sep. 1995.
[4]J.HAN AND M.KAMBR,“DATA MINING CONCEPTS AND TECHNIQUES,”2ND ED.,MORGAN KAUFMANN PUBLISHER,2006, CH.2, PP 71-73.
[5] R. Gonzales, R. E. Woods, “Digital Image Processing,” 2nd Ed., New Jersey Prentice Hall, 2002.
[6] T. Gevers and A. Smeulders, “Pictoseek: Combining color and shape invariant features for image retrieval,” IEEE Trans. Image Processing, vol. 9, no. 1, pp.102– 119, Nov. 2000.
[7] R. Haralick, K. Shanmugam, and I. Dinstein. “Texture Features for Image Classification,” IEEE Trans. on Systems, Man and Cybernetics, SMC, vol.3, no 6, pp. 610–621, Nov. 1973
[8]
]
R. Datta, J. Li, and J. Wang, “Content-based image retrieval - approaches and trends of the new age,” ACM Computing Surveys, vol. 40, no. 2, Article 5, pp. 1-60 April 2008.[9] M. Hu. “Visual pattern Recognition by Moment Invariants,” IEEE Transactions on Information Theory, IT, vol. 8, pp. 179 -187, Feb. 1962.
[10] J. Laaksonen, M. Koskela, S. Laakso, and E. Oja, “Picsom - content-based image retrieval with self-organizing maps,” Pattern Recognition Letters, vol. 21, pp. 1199– 1207, Feb. 2000.
[11] Y. Deng, B. Manjunath, “Unsupervised Segmentation of Color -Texture Regions in Images and Video,” IEEE Trans. Pattern Analysis and Machine Intelligence, vol. 23, no. 8, pp. 800-810, Aug. 2001.
[12] A. Yang, J. Wright, Y. Ma, and S. Sastry, “Unsupervised segmentation of natural images via lossy data compression,” Computer Vision and Image Understanding (CVIU), vol. 110, no. 2, pp. 212-225, May 2008.
[13] M. Sudhamani, and C. Venugopal, “Segmentation of Images through clustering to Extract Color Features: An application for image Retrieval,” International Journal of Computer Science, vol. 2, No.1, pp.54-61, August 2007
[15] J.R. Smith, C.S. Li, “Image classification and querying using composite region templates,” International Journal of Computer Video Database, vol. 75, pp. 165– 174, 1999.
[16] M. Chantler, and J. Wu, “Rotation Invariant Classification of 3D Surface Textures using Photometric Stereo and Surface Magnitude Spectra,” Proceedings of British Machine Vision Conference, Vol.2, pp 486-495, Jan. 2002.
[17] R. Dubes, and A. Jain, “Random field models in image analysis,” Journal Applied Statistic, vol. 16, no. 2, pp.131-164, Nov. 1989.
[18] A. Pentland, “Fractal-Based Description of Natural Scenes,” IEEE Transaction on Pattern Analysis Machine Intelligence, vol. 6, no. 6, pp. 661-674, 1984.
[19] J. Mao, and A. Jain, “Texture Classification and Segmentation using Multi- Resolution Simultaneous Autoregressive Models,” Pattern Recognition, vol. 25, no. 2, pp. 173-188, 1992.
[20] J. Li, J. Wang, and G. Wiederhold, “Integrated Region Matching for Image Retrieval,” In Proceedings of the 2000 ACM Multimedi a Conference, Los Angeles, October 2000, pp. 147-156.
[21] Han, J., Kamber, M. 2012. Data Mining: Concepts and Techniques, 3rd ed, 443-491.
[22] A. Ouyang, and Y. Tan, “A novel multi-scale spatial-color descriptor for content based image retrieval,” Proceedings of the 7th International Conference on Control, Automation, Robotics and Vision, Mexico, August 2002, vol. 3, pp. 1204-1209.
[23] H. Yu, M. Li, H. Zhang, and J. Feng, “Color texture moments for content-based image retrieval,” Proceedings of the International Conference on Image Processing, Rochester, New York, USA, September 22-25, 2002, vol. 3, pp. 929-932.
[24] T. Gevers, and H. Stokman, “Classifying color edges in video into shadowgeometry, highlight, or material transitions,” IEEE Transactions on Multimedia, vol. 5, no. 2, pp. 237-243, Sep. 2003.