Volume 3, No. 1, Jan-Feb 2012
International Journal of Advanced Research in Computer Science
RESEARCH PAPER
Available Online at www.ijarcs.info
ISSN No. 0976-5697
Empirical Evaluation of Software Quality Using Object-Oriented Software Metrics
Satyavan Nain*
M.Tech., Computer Science & Engineerig Haryana College of Tech. & Management,
Kaithal Haryana, India [email protected]
Anshu Parashar Associate Prof. & HOD, Department of C.S.E.,
Haryana College of Tech. & Management, Kaithal, Haryana, India
Sunita Parashar
Associate Prof., Department of C.S.E., Haryana College of Tech. & Management,
Kaithal, Haryana, India [email protected]
Abstract: Object-Oriented software development requires different metrics to evaluate the quality of the software due to newly implemented constructs/concepts. A large number of metrics have been developed to measure these constructs by software practitioners and academicians. Managers are particularly interested in measuring external attributes such as maintainability, reliability and reusability. In this paper we provide empirical evaluation supporting the role of quality metrics to measure the quality attributes understandability, maintainability, reusability and complexity. We believe that these results have significant implications for designing high quality software product using obj ect-oriented approach.
Keywords: object-oriented concepts, software quality, software metrics, quality attributes
I. INTRODUCTION development process is essential for improving software productivity and quality [3]. Analyzing the object-oriented software to evaluate its quality is becoming increasingly important as the paradigm continues to increasing popularity [4]. Managers are particularly interested in measuring external attributes such as maintainability, reliability and reusability. In object-oriented environment, certain integral design concepts i.e. inheritance, coupling and cohesion have been argued to significantly affect complexity [5]. Nowadays, a quality engineer can choose from a large number of object oriented metrics. The question posed is not the lack of metrics but the selection of those metrics which meet the specific needs of each software project. A quality engineer has to face the problem of selecting the appropriate set of metrics for his software measurement [6].
II. PRIORLITERATURE
Chidamber and Kemerer [1994] developed and analytically evaluated six design metrics extending the Wand and Weber work. They have proposed a well-supported, domain independent modelling framework based on Bunge‟s ontology for a clear understanding of an information system.
In this framework they define a set of core concepts that represent a view of world as composed of objects and properties which describe the structure and behaviour of an information system. CK metric suit contains WMC, RFC, CBO, LCOM, DIT, NOC [7][8]. Basili and Briand validated that object-oriented design metrics are predicators of fault-prone classes and can be used as early quality indicators [9]. SATC (Software Assurance Technology Centre) [1995] applied a model for evaluating software quality that has four goals: Stability of Requirements and Design, Product Quality, Testing Effectively and Implementation Effectively. They investigated the object oriented metrics with respect to these goals. They selected three traditional metrics to measure the methods and six object-oriented metrics to evaluate the efficiency, complexity, understandability, reusability and testability of software. Traditional metrics were CC, LOC and CP. Object-Oriented metrics were WMC, LCOM-CK, CBO, RFC, NOC and DIT. They justify some thresholds suggested by COTS developers. [10].
[1]. V.Krishnapriya and K. Ramar present a collection of traditional and object-oriented metrics which are useful for software quality engineers in selecting the proper set of metrics for their projects [11].
III. RELATIONSHIPBETWEENOBJECT-ORIENTED CONCEPTSANDQUALITYATTRIBUTES
In order to establish a relationship between design constructs and attributes of quality, the influence of design constructs and quality attributes are being examined with respect to SATC‟s attributes [1][10]. Quality of the object oriented application depends on how well the object oriented concepts or constructs are used or applied. A good design will improve the quality because a good design will be easy to understand, reuse, maintain and test. It was observed that each design construct affects certain quality attributes. This is being depicted in Fig.1. As the figure shows efficiency of an object oriented product is affected by encapsulation and inheritance, complexity depends on encapsulation, inheritance and coupling, reusability is affected by encapsulation, inheritance, coupling and cohesion, understandability is affected by encapsulation, coupling and cohesion. Testability and maintainability is mainly affected by the encapsulation, inheritance and coupling. To measure the quality of an object oriented design these constructs are measured.
Figure 1: Relationship between Object-oriented Constructs & Quality Attributes [1]
IV. QUALITYMETRICS
A. Cyclomatic Complexity(CC):
Cyclomatic Complexity [McCabe, 1976] is used to indicate the complexity of a program. It measures the number of linearly independent paths through a program‟s source code. Given a control flow graph G of a program, the cyclomatic complexity V(G) can be computed as:
Cyclomatic complexity V(G) = E - N +2 E = number of edges in the graph. N = number of nodes in the graph.
The Cyclomatic Complexity metric is a graphical means of evaluating the complexity of a function and also determining the completeness of coverage of tests for that function. Cyclomatic Complexity should be below 10.
B. Comment Percentage (CP):
The comment percentage is calculated by the total number of comments divided by the total lines of code less the number of blank lines. Since comments help developers and maintainers, this metric is used to evaluate the attributes of Understandability, Reusability and Maintainability. Comments are another point of contention. There is a school of thought that says that code can be written to be self-documenting.
A comment percentage between 20 and 30 is considered good [10].
C. Maintainability Index (MI):
The maintainability index (MI) is a compound metric designed at the University of Idaho in 1991 by Oman and Hagemeister. The primary aim of the metric is to determine how easy it will be to maintain a particular body of code. The Maintainability index was originally defined as –
MI = 171 - 3.42ln(aveE) - 0.23aveV(g') - 16.2ln(aveLOC)
Where aveE is the average Halstead Effort per module, aveV(g') is the average extended cyclomatic complexity per module and aveLOC is the average numbers of lines of code per module. This metric is used to find out which parts of the system are contributing most to its low maintainability. MI = 171 - 3.42ln(aveE) - 0.23aveV(g') - 16.2ln(aveLOC) + (50 * sin(sqrt(2.46*aveCM))
This formula is believed to give a better measure of the contribution of comment lines to maintainability. However as it is a sin function there are a number of situations where the addition of comment lines can actually cause a reduction in the maintainability figure. MI more than 85 is good, between 65 and 85 is moderately good and below 65 is difficult to maintain with really bad pieces of code if comments are included (big, uncommented, and unstructured).
D. Weighted Methods per Class (WMC):
Weighted Methods per Class (WMC) was originally proposed by C&K as the sum of all the complexities of the methods in the class. Rather than use Cyclomatic Complexity they assigned each method a complexity of one making WMC equal to the number of methods in the class
Consider a Class C1, with methods M1,..., Mn that are
E. Depth of Inheritance Tree (DIT):
F. Coupling between object classes (CBO):
CBO for a class is a count of the number of other classes to which it is coupled. It can be measured by counting the number of distinct non-inheritance related class hierarchies on which a class depends. If two subsystems are loosely coupled, they are relatively independent, so modifications to one of the subsystems will have little impact on the other. If two subsystems are strongly coupled, modifications to one subsystem are likely to have impact on the other. A desirable property of the subsystem decomposition is that subsystems are as loosely coupled as reasonable. Coupling affects external quality attributes of the software e.g. understandability, maintainability, reusability etc.
G. Response For a Class (RFC):
The RFC is the cardinality of set of all methods that can be invoked in response to a message sent to an object of the class or by some method in the class. This includes all methods accessible within the class hierarchy. The larger the number of methods that can be invoked from a class through messages, the greater the complexity of the class.
H. Lack of Cohesion in Methods (LCOM):
This metric uses the notion of degree of similarity of methods. LCOM measures the amount of cohesiveness present, how well a system has been designed and how
measure the understandability and Maintainability Index (MI) to measure the Maintainability of the systems. From object oriented specific metrics we used Weighted Method per Class (WMC), Reference For Class objects (RFC), Coupling Between Object (CBO), Lack of Cohesion in Method (LCOM) and Depth of Inheritance Tree (DIT). We measure the design and code quality of the six java projects. Three of them are student level projects and other three are taken from the PlanetSourceCode website. The results are used to measure the mainly four quality attributes of software quality from the developer‟s point of view. These four quality attributes are understandability, maintainability, reusability and complexity. We used two java metric tools Ckjm1.9 Chidamber & Kemerer Java Metric tool and JHawk Demo Java metric tool [12]. Ckjm is an open source command-line tool. It calculates the C&K object-oriented metrics by processing the byte-code of compiled Java files [13].
LOC – Lines of Code, AVCC- Average Cyclomatic Complexity, CP - Comment Percentage, WMC – Weighted Method per Class, RFC – Response for a Class, LCOM – for individual metrics and projects. These results are picked from both of the tools and then entered in the excel worksheet.
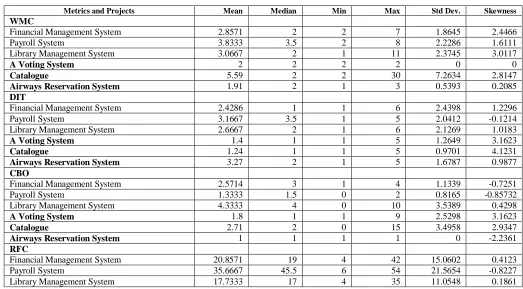
Table I. Metric wise result of all the applications
A Voting System 7.2 4 4 32 8.804 3.0511
Catalogue 13.41 9 2 78 17.1102 3.7515
Airways Reservation System 11.45 5 4 36 12.4448 1.7816
LCOM
Financial Management System 0.4671 0.17 0 3.27 0.5422 0.463 Payroll System 4.8333 0 0 28 11.3564 2.4428 Library Management System 4.53 0 0 55 14.1061 3.747
A Voting System 0.1 0 0 1 0.3162 3.1623
Catalogue 0.08 0 0 0.44 0.1281 1.7596
Airways Reservation System 0.27 0 0 3 0.9045 1.8104
A. Quantitative Analysis:
This section compares the metric results of both software project categories based on a particular metric. First three projects are student projects and the last three are the planet source code projects in all the bar charts in this section.
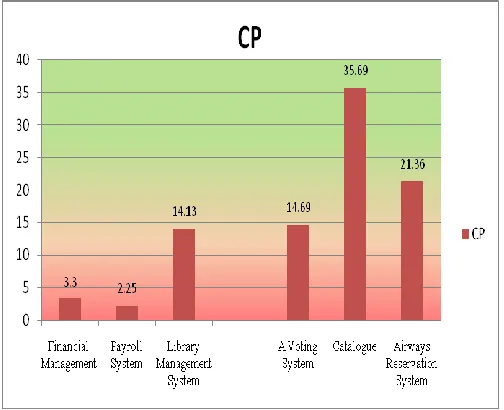
a. Comment Percentage:
As shown in Figure 2 Comment percentage of the student projects is very low. It is considered 20 to 30 percent as good. If it is below 10 then it is a serious matter. It is below 10 in two projects and just above the 10 in third project. On the other hand these values are above 20 in two of planet source code projects and above 14 in the third project. These have better CP.
Figure 2: Bar chart of Comment Percentage (CP) of all projects
So, comment percentage is indicating that planet source code projects are more understandable than student projects. So planet source code projects are developed keeping the understandability factor in mind.
b. Depth of Inheritance Tree:
As shown in Figure 3 values of the DIT in projects are good. DIT up to 3 is considered good.
Figure 3: Bar chart of DIT
It is 3.17 in Payroll System which is not much bad. On the other hand the DIT values of planet source code projects are much better than student projects except Airways Reservation which is 3.27. So it indicates that all the projects are easy to understand, reuse, test and have less complexity. If DIT values are high it shows the deep hierarchy which will difficult to understand and more testing will be required. It will also difficult to capture the behaviour of the system.
c. Maintainability Index:
Values of maintainability index are considered good above 85, moderately good between 65 and 85, but bad below 65. MI values of two student projects are good and that of Payroll System is moderately good. MI values of planet source code projects are good in two projects and moderately good in catalogue. It indicates that all the projects are maintainable.
d. Response for a Class:
Figure shows that RFC values of student projects are much more than planet source code projects.
Figure 5: Bar chart of RFC
High RFC values indicate that classes are more complex and it is difficult to predict or capture the behavior of the system. These classes are difficult to maintain. RFC values of planet source code projects are comparatively low than student projects. It indicates that planet source code projects are less complex, easy to understand and maintain as shown in fig. 5.
e. Coupling and Cohesion:
Figure 6 shows that CBO values of student projects are more comparatively to planet source code projects. High CBO values indicate that classes have more dependencies. So, these classes cannot be easily maintained and reused. In order to improve the maintainability and reusability classes should be independent or may have less coupling between them. It can be achieved by splitting the classes. It indicates that planet source code projects are more maintainable and reusable.
Figure 6: Bar chart of CBO
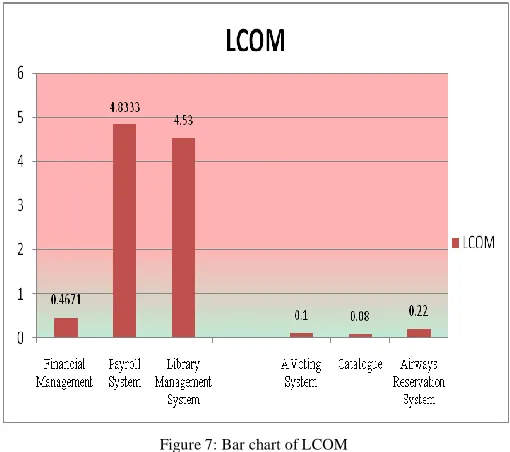
Figure 7 show that student projects have high values of LCOM. It indicates the student projects are less cohesive than planet source code projects. LCOM values should be less or high cohesion is a desired property so that it will increase the reusability. It will be helpful in reusing only desired modules. It will improve the encapsulation. This property is satisfied by all the planet source code projects.
Figure 7: Bar chart of LCOM
A low value of LCOM means high cohesion. So, it indicates that planet source code projects are more reusable and maintainable.
f. Average Cyclomatic Complexity:
Figure 8 shows that AVCC values of all the projects are less than 10. This indicates that all the projects are easy to maintain and test because less number of paths are to be followed during maintenance and testing. It should be below 10.
Figure 8: Bar chart of AVCC
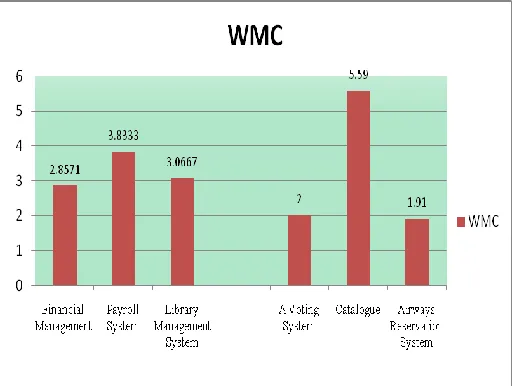
g. Weighted Methods per Class:
Figure 9: Bar chart of WMC
B. Attribute wise Evaluation:
Specified metric indications for various quality attributes i.e. understandability, maintainability, reusability and complexity comparing both types of projects (student projects and downloaded projects from planet source code)
Indicators G – Good P – Poor
S – Satisfactory C – Complex
Good – when all the metric results are good (), Poor – when at least one metric result from related metric is bad (), Satisfactory – when maximum one result from the related metric is satisfactory ()/(), Complex – when more than one complexity indicators are bad.
a. Understandability Indicators:
Table 2: Understandability indicators
Project Name Understandability Overall AVCC CP WMC RFC
Financial Management
System P
Payroll System P
Library Management
System P
A Voting System P
Catalogue G
Airways Reservation
System G
Understandability of all the student projects and first from downloaded projects is poor due to less CP that is good of two planet source projects.
b. Maintainability Indicators:
Table 3 shows that maintainability of all the student projects is poor and that of „A Voting System‟ from planet source code projects is also poor. Catalogue is satisfactorily
maintainable but „Airways Reservation System‟ is good at maintainability.
Table 3: Maintainability indicators
Project Name Maintainability Overall MI CP RFC LOC
Financial Management
System P Payroll System P Library Management
System P
A Voting System P
Catalogue S
Airways Reservation
System G
c. Reusability Indicators:
Table 4 shows that „Financial Management System‟ is good „Payroll System‟ and „Library Management System‟ are poor at reusability. While two of the downloaded projects are good and one is satisfactory at reusability
Table 4: Reusability indicators
Project Name Reusability Overall LCOM CBO DIT
Financial Management System G
Payroll System P
Library Management System P
A Voting System G
Catalogue G
Airways Reservation System S
d. Complexity Indicators:
Table 5 shows that two of student projects are slight complex and one is complex while „A Voting System‟ and „Catalogue‟ are good they have no complexity and „Airways Reservation System‟ is slight complex.
Table 5: Complexity indicators
Project Name Complexity Overall AVCC RFC DIT
Financial Management System G
Payroll System S
Library Management System G
A Voting System G
Catalogue G
Airways Reservation System S
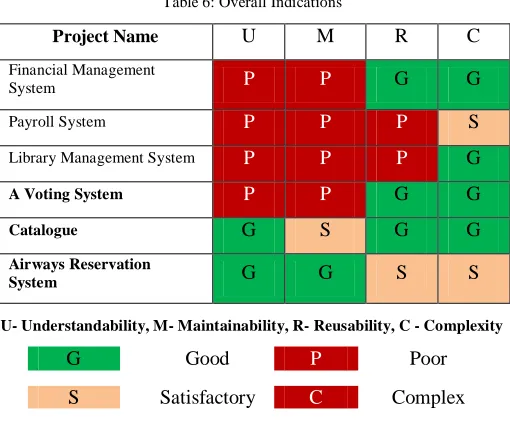
C. Overall Indications:
Finally collecting the results affecting the considered quality attributes we came to the following quality indicators.
source code projects are either good or satisfactory under these quality attributes. From Student projects „Financial Management System‟ is good at reusability and has less complexity, „Payroll System‟ is bad at reusability and a little complex, „Library Management System‟ is poor at reusability but less complexity.
Table 6: Overall Indications
Project Name U M R C
U- Understandability, M- Maintainability, R- Reusability, C - Complexity
G Good P Poor
S Satisfactory C Complex
Planet source code projects more reusable and have less complexity than student projects.
VII. CONCLUSION
Managers are particularly interested in measuring external attributes such as maintainability, reliability and reusability etc.. Our evaluation based on eight quality metrics to measure the said quality attributes (understandability, maintainability, reusability and complexity) shows that the student projects are lacking the desired properties in terms of metric values and in planet source code projects these values are better. These results finally tell us where we are lacking in the development process. These will help us improve and control the process and will improve the quality of product also, because a quality process delivers a quality product. These metrics values should be kept in mind from early development stages to improve the quality of the software. There may be some other factors which will affect these quality attributes. To improve the quality of development process continuously measurement of all the intermediate products is very necessary at all the stages which tell a developer the deviations of actual results from expected results. As early a limitation is detected it will save a lot of efforts and valuable resources. These indications are treated as checkpoints in the future.
VIII. ACKNOWLEDGMENT
The authors would like to thank Department of CSE, Haryana College of Technology & Management, Kaithal, Haryana, India for providing a research environment and “Open Source'' programming community for providing numerous tools and projects for facilitating the research work.
IX. REFERENCES
[1] Khan, R.A., “ An Empirical Validation of Object Oriented Design Quality Metrics”, Comp. & Info Sci., Vol. 19, December 2006, pp 1-16
[2] Tahvildari, L., Singh, A. “Categorization of Object-Oriented Software Metrics”, Electrical and Computer Engineering, 2000 Canadian Conference Vol. 1, pp 235-239
[3] Kim, E.M., Chang, O.B., Kusumoto, S. and Kikuno, T., “Analysis of Metrics for Object-Oriented Program Complexity”, IEEE 1994, pp 201-207.
[4] Harrison, Counsell and Nithi, "An Evaluation of MOOD Set for Object Oriented Software Metrics", IEEE Transaction on Software Engineering, Vol. SE-24, No. 6, June 1998, pp 491-496
[5] Subramanyam, R. and Krishnan, M.S., "Empirical Analysis of C.K. Metrics for Object Oriented Desing Complexity: Implications for Software Defects", IEEE Transactions on software engineering, vol. 29, no 4 April 2003, pp 297-310. [6] Neelamegam, C., Punithavalli, M. “A Survey – Object
Oriented Quality Metrics”, Global Journal of Computer Science and Technology, pp 183-186.
[7] S.R. Chidamber and C.F. Kemerer, "Towards a Metrics Suit for Object Oriented Design," Vol. 26, No. 11, Nov. 1991, pp 197-211.
[8] S.R. Chidamber, C.F. Kemerer, " A Metric Suit for Object-Oriented Design," IEEE Transactions on Software Engineering ”, Vol. 20, No 6, June 1994, pp 476-493. [9] Basili, V.R., Briand, L.C., Melo W.L., " A Validation of
Object Oriented Design Metrics as Quality Indicators" IEEE Transaction on Software Engineering, Vol. 22, no 10, Oct. 1996 pp 751-761.
[10] SATC, Software Quality Metrics for Object Oriented System Environments, June 1995, SATC-TR-95-1001.
[11] Krishnapriya, V., Ramar, K. “The Growth and Development of Object Oriented Metrics: A Study”, International Journal of Computer Science and Knowledge Engineering, 4 (1), Jan.-June 2010, pp 75-84.
[12] Paramvir Singh and Hardeep Singh, “ DynaMetrics: A Runtime Metric Based Analysis Tool for Object Oriented Software Systems”, SIGSOFT Software Engineering Notes, Vol. 33, No. 6, November 2008
![Figure 1: Relationship between Object-oriented Constructs & Quality Attributes [1]](https://thumb-us.123doks.com/thumbv2/123dok_us/704588.1078480/2.612.58.267.360.548/figure-relationship-object-oriented-constructs-quality-attributes.webp)