International Journal ofAdvanced Research in Computer Science
RESEARCH PAPER
Available Online at www.ijarcs.info
How do Germany’s Internet Users seach the Web? – A User-Focused Study of Search
Behavior and Satisfaction
Annegret M. Gross
China University of Petroleum (CUP) Huangdao, Qingdao, China
Abstract:The internet has developed into the number one port for communication and information. With the millions of websites available, search engines play a vital role in filtering information online. Over time, both search engines and technical equipment have been changing: web-enabled devices have been getting smaller, new search engines were launched, new search featuresadded, and the presentation of the search resultshas undergone modifications. Users have been changing their search habits, too, they have been getting more experienced in searching the web. Analytical search engine studies, e.g. logfile analyses,are numerous. User-focused studies of search engine behavior and user satisfaction, on the other hand, are still rare. However, certain scenarios, such as exploratorysearches, and the users’ subjective satisfaction may not be captured in those analyses. Nonetheless, the users’ subjective opinions and skills eventually decide upon the achieved search performance and the success of a search engine.The last user-focused search engine studies in Germany are from more than a decade ago. This study investigates user search engine behavior and satisfaction from the perspective of internet users in Germany. An survey was conductedto learn about search engine usage frequency, preferred search engines, and priorities for search engine selection, and to assess specificsearch habits, such aspreferred search query language, customization of the search engine language settings, and the necessity for repetitive searches and query rephrasing as perceived by the users. The survey also evaluated the users’ satisfaction with the search results in general, the search results on the first page, as well as the results retrieved with German versus English search queries. Where possible, the paper compares the findings with theuser-focused studies from 2003 and 2005.
Keywords:search engines, user behavior, search satisfaction, information retrieval, Germany
1.INTRODUCTION
Information retrieval (IR)is one of the most used services on the internet. Searches for information about products and services constitute around 87% of all web activities(Czajka, 2011). Search engines are the essential tools to locate theneeded information among the millions of websites available online (Purcell, Brenner, &Raine, 2012; van Eimeren& Frees, 2012). Research has been evaluating IR systems under many different aspects. However, the users themselves have often not been taken into account. User-oriented studies, on the other hand, have often been criticized for not being able to provide consistent and objective data. Nonetheless, the users’ perspective is vital for evaluating search engines, because their subjective opinions about usability anduser-friendliness finally decide upon the standing of the search engine. An improved ranking algorithm or index quality alone do not necessarily increase user satisfaction and enhance customer retention. At the end of the day, the users’ search habits determinethe actually achieved IR performance. For this reason, research is increasingly shifting from a merely technical approach to amore user-oriented focus (Ingwersen&Järvelin, 2006). This shift of focus opens up a full range of new evaluation possibilities that may be beneficial for search engine users and providers alike.Search engine providers may get a chance to learn more about user preferences and dislikes, search behaviorand satisfaction asperceived by the users themselves. This may allow them to better align their systems with userexpectations, eliminate deficits, and secure market share bypreventing customers from abandoning the search engine in favor of a competitor’s product. Users,in turn,may benefit from an improved search experience.
Furthermore, both user search behavior and search result presentation have changed over the course of time. Users do no longer just type in keywords, but they enter complex
queries and questions. Ask.com was originally the only IR system to answer questions. However, increasingly more search engines adapt to deliver answers rather than mere search results. In 2015, Google modified its interface to accommodate so-called “answer boxes”that show relevant information in response to a query in form of web pages, images, text or multimedia(Google, Inc., 2015). In case the query contains any buying signals, for example, product and shopping options are listed; for definition-based queries, results from dictionaries and encyclopedias are displayed. Therefore, users no longer need to click a document; their informationseeking motivation may be satisfied by the showcased results. While search results were merely organic in the beginning, the first ads appeared around 2000 and were positionedon the right side. Nowadays, ads can be seen at the top, the bottom, and on the right. Especially top ads were found to impact click rates significantly (Advanced Web Ranking, 2014).
2.LITERATURE REVIEW
2.1Web Search Evaluation Methods
Evaluation methods of web search behavior can be roughly distinguished into supervised and non-supervised methods. The following sections provide an overview over the most common evaluation methods.
2.1.1Supervised Evaluation Methods
Supervised evaluation methods refer to all experiments that involve the presence of a supervising person or where the tested person is aware of being evaluated.
2.1.1.1Computer Laboratory Experiments In this type of experiment, the test persons sit in a laboratory room with web-enabled computers. They aregiven a task they are supposed to solve with the help of an information retrieval system. Search behavior and interactions with the IR system are recorded by a supervisor. The supervisor’s presence may make the participants feel observed and result in an unauthentic search behavior. Further disadvantages are the high expense for the laboratory and the limited number of workstations, which also restricts the number of participants. That is why laboratory experiments are usually not representative (Janetzko, Hildebrandt, & Meyer, 2002).
2.1.1.2Eye-Tracking Studies
Due to their technical requirements, eye-tracking experiments also take place in a laboratory. Computer-supporteddevicestrack pupil movements and examinethe users’ viewing patternwhile theyare viewing a search results page. The particular points of focus are marked on a so-called heatmap that shows the areas of high interest as “hot spots” and the areas of low interest as “cold spots” (Granka, Joachims, & Gay, 2004; Buscher, Dumais, &Cutrell, 2010). The advantage of eyetracking to analyze search behavior is that the pupil movements are rather unconscious, which helps obtain unbiased results. In addition to the eye movements, cursor movements and clicks may also be tracked (Joachims, Granka, Pan, Hembrooke, & Gay, 2005), contributing to more holistic results. However, the individual is aware of being observed, so search behavior might be modified.
2.1.1.3 Survey-Based Studies
Survey-based studies offer a wide range of possibilities to collect user data. Closed questions allow for predefined answers, open questions may be answered freely “on the basis of the knowledge that the interviewee has immediately at hand” (Flick, 2009, p. 156). Scaled questions help obtain more refined answers, including gradations and variations. A great advantage of questionnaires is that they may collect numerous background information, which allows getting a better picture of the interviewees and group them according to common characteristics (female/male, expert/beginner etc.). A disadvantage is that users may try to cast a better light on themselves. This may even be more likely if the interviewer is present in person during the survey. Anonymous questionnaires can reduce this effect.
2.1.2 Non-Supervised Evaluation Methods Non-supervised methods analyze electronical IR data without any direct involvement of the search engine users themselves. Because the data is usually analyzed automatically, great amounts of information may be evaluated and the evaluation is representative.
2.1.2.1Logfile Analyses
Logfile analyses are one of the most popular methods in information retrieval evaluation. A logfile is generated automatically by a computer system and protocols all user search interactions and processes. Individual users may be identified with the help of cookies, which allows study user-specific search activities. The records may provide extensive information about type and number of search queries, duration of a search session, clicked links, number and duration of viewed documents, and much more (Massand&Spiliopolou, 2000; Lutzky&Teichmann, 2002; Spink, 2004; Jansen & Spink, 2006; Huang &Efthimiadis, 2009).
Logfile analyses aim at inferring user behavior, satisfaction, and relevance of search results from the recorded data. However, interpreting complexuser interactions as an indicator of document relevancy, user interest and satisfaction is problematic in different aspects. Firstly, such analyses can only provide implicit feedback. Secondly, certain click data does not necessarily provide reliable information about the users’ intent. A search session, for example, is considered to start with the user opening the search engine website in the browser and to finish when the user closes the website. However, these interactions alone cannot take into account so-called exploratory searches that may expand over several days or weeks (Marchionini, 2006). A click and a long dwell time on a search result before returning to the results page is associated with high user interest and, therefore,with high relevancy of the document. On the other hand, a quick return from a clicked website to the search engine results page (bounce rate) is interpreted as a sign of lacking user interest and irrelevancy of the document. However, users may bookmark the website in order to revisit it later, or save the website to read it offline. Furthermore, retrieved documents may be opend in a new tab or window with a right mouseclick, or users may be diverted after having accessed a document. In all cases, conclusions drawn from dwell times would be biased or not applicable at all. Finally, logtime analyses are unable to collect demographic data about the users.
2.3Search Behavior and Satisfaction
2.3.1 The Search Process
Each web search activity is triggered by the intent to find information about a topic. The search process is usually made up of a sequence of standard actions. Hearst (2009) has identified four steps that characterize the search behavior: (1) The information need is identified. (2) The query is specified. (3) The retrieval results are examined. (4) The query is reformulated. Step 2 to 4 are repeated until the information need is satisfied. Broder (2002) basically identifies the same four stages, but adds further substages: he suggests that there must firstly be a task (1) that leads to an information need (2). This information need leads to the verbalization (3), which is then translated into a search query in any language (4). The query is submitted to a search engine (5), which selects matching documents from a corpus (6) and produces results that the user evaluates (7). Finally, the user might use a refinement strategy to create new queries and/or to refine the results (8).
2.3.2 Search Queries
arenavigational queries. Their purpose is to reach a specific website that the user either visited in the past or assumes to exist. That is why this type of query usually has one right result only. Navigational queries amount to around 10% of the total of web queries. The reason for users to type in the desired website into the search bar instead of directly into the address bar of the web browser might be that this is considered more convenient, or because the users do not know the exact URL of the website.
Informational queries reflect the users’ intent to obtain information about a certain topic. This information may be available on one or more websites that are not being known before. Typicalsources of information are articles, blogs, or forums. This type of query constitutes the majority of web searches (80%). The third typearetransactional queries. Users search for a website where they intend to pursue further web-mediated interactions. Such interactions may be purchasing a product or service, downloading a file, taking part in an online game, or any other activity where the user needs to interact with a website. Transactional queries make up about another 10% of the web queries (Advanced Web Ranking, 2014).
Generally speaking, German search queries tend to have fewer words than English ones. This is also due to the lexical structure of the German language. German allows long noun compounds that consist of several individual words in English. Overall, search queries are rather general and very short (Schmidt-Mänz, 2007). Recent data shows that 65.2% of the search queries in Germany contain only one keyword. 22.3% contain two keywords. Three-term queries make up 8%, and queries with four search terms are less than 3% (Statista, 2016). The number of complex searches, i.e., queries with Boolean operators and phrase searches, is 17% (GfK/SirValuse, 2008).
2.3.3 User Satisfaction with Search Engines Submitting a query to a search engine produces a range of websites that the search engine algorithm assumes to be relevant for the articulated information need. In general, users are quite satisfied with the search engine they use. A yearly survey among 70,000 respondents by the American Customer Satisfaction Index reveals that Google web search is the market leader. While Google customer satisfaction increased from 77% in 2013 to 83% in 2014 (ACSI, 2014), it fell back to 78% in 2015 (ACSI, 2015). This rise in percentage points was ascribed to amodified labeling of ads, enhancement in readability, and the adaptation of the search interface for mobile and tablet devices. However, smartphone web searches turned out to be less convenient than searches from desktop computers. This lead to a decreased user experience and to customer satisfaction dropping back to 78%.As a consequence, market competitors were able to leverage their positions. In particular Yahoo could make up ground and increase its customer satisfaction level by six points to 75%. MSN and AOL followed closely behind with 74% each. Bing lost 1% compared to the previous year and was at 72% in 2015 (ACSI, 2015).
2.3.4 First Page Search Results
As to date, nostudy has been addressingbrowsing and click behavior of users in Germany. Over the past years, however, many studies from different countries have come to the conclusion that users rarely view more than the results on the first page (Jansen, Spink, Bateman, &Saracevic, 2000; Spink & Jansen, 2004; Joachims et al., 2005; van Deursen& van Dijk, 2009). Spink and Jansen (2004), for
instance, found that over 50% of the users do not look beyond the first page of results. Van Deursen and van Dijk (2009) estimated this number to be at91%. According to theirstudy, over 50% of the searchers do not go past the top three results on the first page. Further studies revealed that search engine users tend to view only those results on the first page which are visible above the fold. A majority of users view and click the top two results only (Granka et al., 2004; Joachims et al., 2005).
A recent broad-based examination of click-through data from Google analyzed 465.000 keywords across 5.000 websites to find out what search result positions are clicked mostly (Advanced Web Ranking, 2014). Click-through rates (CTR) on both desktop and mobile devices, searches with and without ads, and branded searches were considered. Figure 1 shows how the position of a search result influences the organic CTR. The analyzed positions are the top five links on the first page, positions 6 to 10 on the first page, as well as results page 2 and 3. The graph distinguishes between desktop and mobile searches, because the latter ones display significantly fewer items above the
[image:3.595.317.560.300.439.2]fold.
Figure 1.Click-through rates (CTR) of organic searches in Google on desktop and mobile devices.
The top position receives the most clicks with around 30% on both desktop and mobile devices. On position 2, the CTR drops by half to about 15%. Position 3 gets about 10%, position 4 around 7%, position 5 around 5%, and positions 6 to 10 about 4% of CTR.This means that averagely 70% of the searches result in an organic click on the first page. The click rates on the first page are similar for desktop and mobile searches. Slight differences occur on page 2 and 3. The organic CTR for desktop searches increases to about 4% on page 2 and drops steeply to 1.6% on page 3. For mobile searches, however, the CTR on page 2(5.2%) reachesabout the same percentage as position 5 on the first page. The drop on page 3 is less dramatic since that page still obtains about 4% of CTR. These findings suggest that pages 2 and 3 receive more attention when users perform the search on a mobile device than when searching on a PC. Nonetheless, the click rateson the first result are gradually decreasing. The study attributes this decrease to the introduction of universal search results (blending images or news into the web search listings), adding shopping results, and a growing number of ads. With Google providing universal search results and instant answers, users may find the desired information displayed among the listings. Hence, users are no longer required to click on a result. The impact of sponsored links is not to be neglected either. Especially ads in the top positions impact clicks on the organic top results and cut the click-through rate on the first result almost in half. Figure 2 shows how the presence of ads (texts, images, product listings) affects the CTR of
0 5 10 15 20 25 30 35
organic searches.
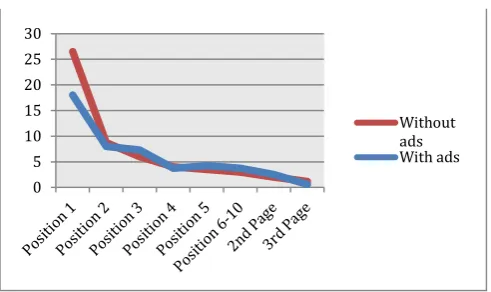
Figure 2.Click-through rates (CTR) of organic searches in Google with and without ads.
Surrounding ads impact especially position 1 of the organic search results. Without ads, the top position receives more than 26% of the clicks. With ads, the click rate shrinks by about a quarter to around 18%. Less significant impacts can be observed for position 3, and for position 5 to 10 on the first results page.
Another aspect that the study examined are branded searches, defined as “searches that contain the entire domain name of the website in the query, with all the spaces and dashes removed” (Advanced Web Ranking, 2014, p. 35). In this regard, branded searches may be compared to navigational searches. When doing a branded search, users click the first search results in more than 50% of the cases. The second and third potitions get only 11% and 6% of the clicks, respectively. The study attributes these ratios to the fact that brand searches usually display six site links below the top link to the brand website, which makes this result listing much more prominent than all other results (Advanced Web Ranking, 2014).
2.4Related User-Focused Search Engine Studies There are only few studies that deal with search engine behavior and satisfaction of internet users in Germany. The two user-focused studies,which include points comparable to this paper, have both been conducted more than ten years ago.
The first study is a broad-based investigation from 2003 by Machill, Neuberger, Schweiger and Wirth (Machill&Welp, 2003). The work is divided into four empirical substudies. The first substudy provides an overview over the search engine market in 2003 as well as results of a survey carried out among search engine providers. The second substudy consists of a performance analysis of the leading search engines at that time and an evaluation of search results and linked websites. Substudy 3 is of particular relevance for this paper, because it is the user-oriented part focusing on the users’ search engine competencies. Knowledge, needs, usage and evaluation criteria of search engine users were analyzed in group discussions. Based on these results, a CATI interview (computer-assisted telephone interview) with 1000 internet users aged between 14 and 65 was conducted. The fourth and last substudy is a laboratory analysis of user search behavior to elucidate search strategies and evaluate the user-friendliness of individual search engines.
Since substudy 3 overlaps with some of the topics covered in this paper, the relevant results shall be outlined here in more details and later on in this study referred to in short, where applicable. In a first step, the interviewees were
asked for a self-assessment of their search engine knowledge. 60% of them rated their search engines skills as “advanced,” about a third (34%) of the respondents considered themselves as “beginners,” and only 6% as “experts.” 8% were using a search engine on a daily basis, 37% two or three days in a week, and 42% one day in a week or less. A socio-demographic analysis of the interviewees showed that characteristics such as age, profession, education, and gender did not play a role in search engine usage. The preferred search engine of 68.6% of the respondents was Google, followed by Yahoo with 10.2%, Lycos with 4.9%, and Fireball with 2.5%. For 77%, Google was the only search engine they used. 39% used a second search engine, 11% a third one, and only 2% accessed four search engines. It turned out that users who preferred Google used less frequently a second search engine than users who named Yahoo or Lycos as their search engine of choice. The reseachers concluded that brand acquaintance and habitualization made users refer to Google as their central search tool. They further characterized Google users to have the highest internet and search engine skills. Google users were most likely to go online and use a search engine, they were more often university graduates and younger than the other interviewees (Machill&Welp, 2003).
If a search process did not bring about the desired result, the mostly used strategy by all respondents (beginners, advanced, and experts) was query reformulation. Most of the time, the search was being repeated with another term or further words were added to the original query. Only few users changed the search engine. Even fewer users stopped the information seeking task completely. Occasionally, users also looked through the search results again more thoroughly. These search strategies did not remarkably differ between users of Google, Yahoo, and Lycos. About half of the interviewees (49%) were aware of the possibility to use Boolean operators (AND, OR, NOT, quotation marks, +/- signs etc.). However, only 20% made use of these operators to refine their search terms, 24% used them only seldom. The differences between beginners and advanced/experts were particularly significant in this aspect, because many beginners were not yet familiar with the use of Boolean operators (Machill&Welp, 2003).
The second related German study is from 2005. Schmidt-Mänz and Bomhardt (2005) conducted a representative online survey among 5.900 participants aged between 11 and 85. About half of the participants were younger than 29 years. The two largest groups of respondents were employees (43.1%) and students (26.1%). The gender distribution was 89% males and 11% females. The survey covered topics such as search engine usage frequency, search engine preferences versus search portal preferences, search strategies and behavior in case of unsuccessful searches, preferred search query language, and search engine personalization.
About 90% of the participants started using the internet before 2000 and went online several times a day, also to check emails. Concerning search engine usage frequencies, 73% indicated to use an IR system several times a day. The mostly used search engine was Google with 91.3%. 24% of the Google users did not use a second search engine, and 11.7% accentuated that Google was the only search engine they used. 66.2% never turned to portals such as T-Online and MSN, 14.2% did so seldom. More than half of the respondents used to seek information about topics they already had some background knowledge about. The most
0 5 10 15 20 25 30
frequently named reasons for information seeking were: research of specialist information, information about products, and information about persons. The study further found that most of the search queries (79.6%) usually consisted of two or three terms. Because experts have a better background knowledge, they were able to create more complex queries. 52.7% used Boolean operators often or very often. Quotation marks for phrase searches were used by 64.4%. According to the respondents, they usually started with more general queries and gradually narrowed them down to obtain more precise results. This so-called bottom-up strategy was used by 55.8%. In contrast, the top-down strategy was employed by only 45.4%. Regarding the users’ satisfaction with the search results, the respondents stated to usually find what they were looking for and to be satisfied with the search results. In particular, 43% of the respondents regularly found the information they searched for. About 70% viewed only the first five results in the list, and 70.8% immediately returned to the search engine if the viewed website did not contain the desired information. Expert users returned more frequently to the search engine website, if the visited website did not satisfy their information need. However, an unsuccessful search seldom or never made users run the same search again with the identical or a modified search query on another search engine. More than half of the surveyed users searched with German queries only. 75% had not personalized their search engine to fit their needs (Schmidt-Mänz&Bomhardt, 2005).
3.GERMANY
3.1Demography and Internet Penetration
Germany has a total population of about 80 million people with highly diverse ethnic backgrounds. It has the worldwide second-highest number of migrants, after the United States, and ranks seventh among the EU countries. The migrants come from practically all countries. The largest group is from Turkey (2.4% of the total population in Germany),about 2,4 million people immigratedfrom other European countries. The official language is standard German, which is used in the media and in written documents of all types. Many regions speak their own German dialects. Germany’s internet penetration is currently at 88%, i.e., about 71 million people or 2.1% of the world’s population are using the internet in Germany (InternetLiveStats, 2016).
3.2Search Engine Market
Germany’s search engine market is distributed between seven search engines.Google Web Search is clearly dominant andholds the greatest market share with more than 94%. This dominance also reflects in the German language: “to google“ (“googeln“) is being used synonymously for “searching the web.“ In 2004, the verb was admitted to the 23rd edition of The Duden, the standard dictionary of the
[image:5.595.316.552.62.214.2]German language (BibliographischesInstitut GmbH, 2016). The second largerst web search provider is Bing, lagging far behind Google with slightly more than 4% of market share. The remaining five search engines – Yahoo, T-Online, Ask, AOL, and Yandex–all have a market share of less than one percent (Figure 3).
Figure 3. Search engine market share in Germany as of March 2016.
Google began as a research project by two PhD students at Stanford University and was launched in 1998. Due to its new technology of determining a website’s relevance by the number and importance of pages that link back to the site (“PageRank”), Google was able to provide more relevant search results than any other engine at that time and has developed into the most successful web search portal worldwide. For Germany, the engine is available under the top-level domain (TLD)“google.de.”Bing was launched in 2009 by Microsoft to dispute Google’s market leadership. Bing is designed to be a “decision engine” and is advertised with the slogan “Bing and decide.” The US Bing version offers the broadest range of services; the German version provides just a limited range. Bing is available in German at “bing.com/?cc=de.”Yahoo! was founded in 1994 and started off as a web directory. In 2009, Yahoo partnered with Microsoft. Its web search has since been powered by Bing. For its German users, the portal is available at “de.yahoo.com.”T-Online is the only originally German internet portal in the list. Before it was sold to Ströer Sales & Services GmbH in November 2015, the portal was a business unit of Deutsche Telekom, the biggest internet services company in Germany. The website at “t-online.de” is one of the most visited sites in the German-speaking world. T-online search results are powered by Google. Ask.com was first published in 1996 as “Ask Jeeves,” based on the fictional omniscient character Jeeves created by writer P. G. Wodehouse. Ask.com is a question and answer site that was designed for users to type in entire questions. Since 2006, Ask.com is available for the German market at “de.ask.com.” AOL was founded in 1985 as Quantum Computer Services and three years later renamed America Online. AOL is also available under a German TLD at “aol.de”and receives its search results from Bing.Yandexis operated by Russian company CompTek and the largest search engine in Russia with about 60% market share. Yandex is the fourth-largest search engine worldwide after Google, Baidu, and Yahoo. Since 2010, the engine is available in English at “yandex.com.”
3.3ExplanatoryApproaches of Google’s Market Leadership
The imbalance in the German search engine landscape has been a topic of interest in recent years and research has suggested different approaches to explain the lack of variety and competition. Lewandowski (2013) sees the reason for this situation in, among others, the so-called partner index model. There are only a few “genuine” search engines on the market(e.g. Google, Bing, Ask.com, and Yandex) thatmaintain their own indexes. The majority of the other
Search Engine Market Share in %
Google: 94.4% Bing: 4.31% Yahoo: 0.97% T-Online: 0.12% Ask.com: 0.10% AOL: 0.07% Yandex: 0.06% Yahoo
Bing
search engines obtain their search results from one or several of these “genuine” engines. While Yahoo, for instance, appears to be a stand-alone search engine, its search resultsare generated by Bing. The web portals – GMX, WEB.de, and T-Online – receive their results from Google. Since the partner index model is a beneficial solution for both parties,hardly any company is willing to coverthe tremendous costs for developing and operating its own new search engine. Another point that Lewandowski (2014) bringsforwardis that the search engine default settings on stationary and mobile devices heavily influence user search engine behavior. Search engine operators enter into financial agreements with browser manufacturers to have their search engine set as the default. The default settings may be changed, however, some effort is necessary to do so. That is why users generally tend to not change the default settings. After all, the preset search engine also delivers the desired results. Not only are such partnerships financiallyessential for software manufacturers, they also help the search engines establish their positions. Since December 2014, Yahoo is the preset search engine in Firefox browsers, after Mozilla Foundation has quit a ten-year partnership with Google. As a consequence, Google’s US search engine market share dropped by 4% within one year (Breithut, 2015).
Furthermore, research points to the habitualization effect and brandname influence to explain the competitive poverty (Lewandowski, 2014; Jansen, Zhang, & Schultz, 2009; Bailey & Thomas, 2007). When getting acquainted with one search engine, e.g.due tobrowser default settings, users are likely to keep using the same search engine. This connection may be strengthened through a strong brand image: users tend to upratethe search engine, search results, and results descriptions, if they come from a positively branded provider (Jansen et al., 2009).
4.TEST DESIGN
A questionnairewas designed to assess search engine behavior and satisfaction from the perspective of internet users themselves. The questionnaire wasanswered anononymously by 70 students at a German university. Firstly, it collected demographic information (gender, age, native language) of the respondents. Secondly, it contained tenquestions relating to search behavior and satisfactionthat could be answered either by multiple choice or by a Likert five-point scale (LFPS). One question allowed free answers. The questions referred to search engine usage frequency, preferred search engine, mostly used search language, and search engine interface language. Also assessed were the necessity for query paraphrasing as perceived by the users, satisfaction with the search results in general and the search results on the first page, satisfaction with search results in German versus search results in English, and the users’ criteria for search engine selection. The survey results were analyzed, calculated into percentage values, and illustrated in tables and figures.
5.RESULTS
5.1 DemographicData
The demographic background of the 70university students taking part in the survey isshown in Table 1: 33% of the respondents were male, 67% were female. Most of the students were aged between 18 and 25 years (70%). The second largest group was aged between 26 and 35 years
[image:6.595.316.561.423.579.2](27%). A minority of 3% was older than 35. 86% of the participants were native speakers of German. 7% were bilingual natives in German and Turkish, 3% in German and English. Another 3% named Kurdish as their mother tongue, and 1% Rumanian.
Table 1.Demographic data of the survey respondents
Gender male female
33% (n=23)
67% (n=47)
Age 18-25 26-35 >35
70% (n=49)
27% (n=19)
3% (n=2)
Native language
German German and Turkish
German and English
Kurdish Rumanian
86% (n=60)
7% (n=5)
3% (n=2)
3% (n=2)
1% (n=1)
5.2 Search Engine Usage Frequency
The first survey question aimed to find out how often the respondents make use of a search engine. The question was to be answered on a Likert five-point scale from ‘very frequently’ to ‘never’. Figure 4 shows that the result is very homogeneous: 63% of the students turn to information retrieval ‘very frequently’.Slightly more than a third (37%) do so ‘frequently’. None of the respondents ticked any of the other options. The fact that a total of 100% access a search engine on a very frequent to frequent basisunderlines the importance of web search as one of the most used services online. It also suggests that search engines are an essential tool for university students to find information for their study projects.
Figure 4.Search engine usage frequency.
Comparing these numbers with the two related studies from 2003 and 2005 reveals that search engine usage frequencies have soared over the past decade. In 2003, only 8% of the usersturned to a search engine on a daily basis. The vast majority of 79% used to search the web a few days in a week only (Machill&Welp, 2003). Two years on, search engine usage frequencies had already risen significantly. 73% of the interviewees indicated to use an IR system several times a day (Schmidt-Mänz&Bomhardt, 2005).
5.3 Mostly Used Search Engines
The second survey question identified the users’ search engine preferences. In order not to bias the results, this question was designed as an open question where the respondents were able toname the URLs of up to three
0 10 20 30 40 50 60 70
Search Engine Usage Frequency
very frequently frequently 63%
(n=44)
search engines. The results are illustrated in Figure 5.
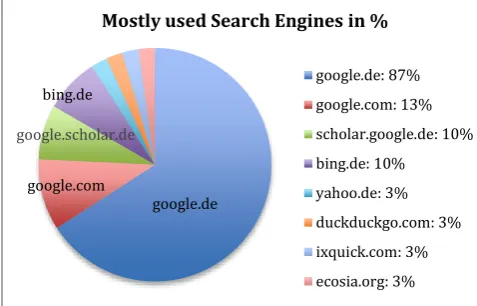
Figure 5. Mostly used search engines (multiple answers possible).
Google.de heads the list with 87% of the participants naming it as their search engine of choice. On place 2 and 3 follow two more Google web domains: google.com with 13%, and the German version of Google Scholar at scholar.google.de with 10%. Another 10% were bestowed to bing.de. The fifth place is shared between four search engines that all received 3% of the user votes: yahoo.de, duckduckgo.com, ixquick.com, and ecosia.org.
DuckDuckGo and Ixquick both intend to distinguish themselves from other search systems by emphasizingon privacy protection. DuckDuckGo was developed in the United States and launched in 2008. The engine stresses to ensure the users’ privacy and avoid the so-called filter bubble, i.e., to show all users the same search results for a specific query, and not to personalize the result listings according to background information obtained from a user, e.g. through search and click history (Buys, 2010; DuckDuckGo, 2014). DuckDuckGo generates its search results from partner search engines, such as Yandex, Yahoo, Bing, and Yummly, and from crowdsourced websites, such as Wikipedia (Reader, 2014; DuckDuckGo, 2015).Ixquick, launched in 1998, also accentuates its privacy protection (EuroPriSe, 2015). It returns the top ten search results from several web search engines and uses its own algorithm “Star System” to determine their relevancy. Ecosia, on the other hand, tries to stand out with its eco-friendly policy. The German Berlin-based company donates 80% of its surplus income to tree conservation organizations (Fischetti, 2013).Ecosia is powered by Bing.
All in all, Google remains the undefeated search tool number 1 of German users. With an overwhelming 110% (due to the multiple answer options), different Google domains were voted on the top 3 positions. For the large majority, Google is the only search engine they make use of. 10% specified Google as their first search enginealong with Google Scholar as their second. Only 17% named a second or third search portal beside Google. Comparing to the 2003 and 2005 studies reveals that Google was able tosignificantly expand its position as the leading search portal.In 2003, Google was the preferred search engine for around 70% of the respondents, Yahoo followed with about 10%. Altogether 52% of the users also accessed other search engines than Google (Machill&Welp, 2003). Two years later, Google was the search engine of choice for already more than 91%, and 24% did not use any other search service (Schmidt-Mänz&Bomhardt, 2005).
5.4 Priorities for Search Engine Selection
[image:7.595.313.556.191.371.2]Investigating user search engine preferences naturallyraises the question why users decide to use a certain search engine – and in most of the cases, as seen above, uniquely one. For this reason, the questionnaire suggested four criteria for search engine selection: precision of results, large number of retrieved documents, availability of search support tools, and fame and reputation of the search engine. The users were asked to rate these criteria according to their personal preferences from 1 (‘very important’) to 4 (‘not so important’). The results are illustrated inFigure 6.
Figure 6.User priorities for search engine selection.
The largest group of users (83%) considers the precision of the results as their number 1 criterion to turn to a specific IR portal. Less important for the surveyed students was a large number of returned documents for a search query (8%) and the fame and reputation of the search engine (6%). The availability of search support tools was the least appreciated feature by the survey respondents (3%). In fact, many students mentioned that in particular the auto-correct function was rather disturbing in their opinions. Based on these findings, it is to be assumed that the users opt for Google because they feel it delivers distinctly precise and relevant results – toa higher degree than the other search engines do.
5.5 Search Behavior
5.5.1 Search Engine Interface Language
All major international search engines (Google, Yahoo, Bing, MSN etc.) allow the users to personalize the web search interface and choose the language they want the search engine to be displayed in. The questionnaire asked the participating students in what language or languages they usually view their search interface. Figure 7 illustrates the anwers provided.
google.de google.com
bing.de
Mostly used Search Engines in %
google.de: 87% google.com: 13% scholar.google.de: 10% bing.de: 10%
yahoo.de: 3% duckduckgo.com: 3% ixquick.com: 3% ecosia.org: 3%
google.scholar.de
8%
83% 6%
3%
Priorities for search engine selection
Large number of retrieved documents
Figure 7. Mostly used search engine interface languages.
The survey participants included 86% of German, and 7% of German-Turkish speakers. The findings show that 84% of the German native speakers and 4% of the Turkish-German speakers use their search engine interface exclusively in German. Altogether 13% of the respondents use the search engine language setting variably in German and English. This includes 3% of the bilingual German-Turkish speakers, the participating speakers of other languages than German (3% German-English, 1% Rumanian), and some of the remaining German native speakers.These respondents also indicated to use the international TLDs of google.com or ixquick.com that are set to English by default. For comparison,the 2005 study found that 75% of the interviewees had not personalized their search engines(Schmidt-Mänz&Bomhardt, 2005).
5.5.2 Search Query Language
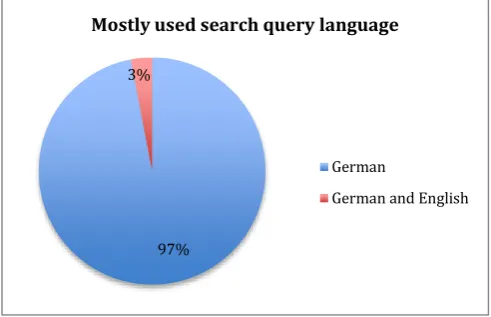
The questionnaire inquired the participants about their mostly used search query language. The results were unanimous (Figure 8). 97% of the respondents use exclusively German to formulate their search terms. 3% use both German and English; these were the German-English bilingual speakers that took part in the survey. These findings lead to the conclusion that German native speakers as well as participants with a native language other than German or English, tend to search the web in German.
Figure 8. Mostly used search query languages.
5.5.3Necessity for Several Searches
The surveyassessed the users’ perceived necessity to repeat a search process before satisfying the information desire. This question was intentionally kept general. The repeated search may happen within one search session, e.g., by typing in a different query, refining the search in another
way, or changing the search engine etc. It may also happen in the context of an exploratory search. The responses could be given on a Likertfive-point scale from ‘always’ to ‘never’ and are shown in Figure 9.
Figure9. User-perceived necessity to run several searches before achieving information need satisfaction.
The chart in Figure 9 demonstrates that most of the responses are located in the middle area: 60% of the respondents do ‘sometimes’ feel the necessity to repeat a search process, 27% ‘often’ do so. 10% ‘seldom’ run a search process again, and a very low number (3%) ‘always’ searches several times before they find what they are looking for. None of the participants ticked ‘never’. With a total percentage of 87% of users repeating a search process on a frequent and occasional basis, the findings indicate that repetitive searching – of whatever manner – is a common method to use until information need satisfaction is achieved.
Up to date, there are no comparable studies about the necessity for repeated searching from a user perspective that provide concrete numbers. Machill and Welp (2003)noted that most of the repeated searches were done with modified search terms and much more seldom with a different search engine.
5.5.4Necessity for Query Rephrasing
If a search query does not bring about the desired information, users might reformulate the search term. This modification of a search query to satisfy the same information need is referred to as query rephrasing or reformulation (Shapiro &Taksa, 2003; Huang &Efthimiadis, 2009). Examples of query rephrasing are word reorder, removal or addition of words, word stemming, acronym formation and expansion, abbreviation, word substitution, spelling correction, modifications in punctuation and whitespaces, as well as semantic rephrasing. The combination of several of the before-mentioned reformulation strategies is referred to as multi-rephrasing. The most effective strategies seem to be the addition and removal of words, word substitution, acronym expansion, and spelling correction (Huang &Efthimiadis, 2009).
In the present study, the participants were to indicate on a Likert five-point scale (LFPS) how frequently they faced the need to rephrase their search query in order to find the desired information on the web. Figure 10illustrates the necessity for query rephrasing during a search process as perceived by the questioned users in Germany.
84% 13%
Search engine interface language
only German variably German & Turkish
variably German & English
97% 3%
Mostly used search query language
German
German and English
3%
27%
60%
10%
0% Necessity for several searches
[image:8.595.35.281.530.688.2]Figure 10.User-perceived necessity for query rephrasing.
The survey findings reveal that users find themselves frequently in a position where they have to reformulate their original search term in order to find more suitable documents that better match their information need. Half of the respondents (50%) ‘often’ rephrase their query during a search process, 37% ‘always’ turn to this strategy. Quite a low number of 13% faces the need for reformulation ‘sometimes’. None of the respondents answered ‘seldom’ or ‘never’. With altogether 87% of the users using this strategy always to often, query rephrasing may be one of the most common means to refine a search and narrow down result listings to finally obtain a good selection of relevant documents in response to a specificinformation seeking desire.
Machill and Welp (2003) also found in their study that query reformulation was the mostly used search refinement strategy on the web, which was used by beginners, advanced, and experts alike. Schmidt-Mänz and Bomhardt (2005) came to similar results: 55.8% of their study respondents made use ofquery refinement strategies most of the time. 45.4% used the opposite strategy: they went from precise to more general queries during their reformulation process.
5.6 Search Satisfaction
[image:9.595.313.559.61.214.2]5.6.1 Satisfaction with the Search Results in General Satisfaction can only be defined subjectively. It may vary from one individual to another. Therefore, indications made by the users themselves in the subsequent sections about their personal degree of satisfaction are necessarily to be considered as subjective. The first question relating to user satisfaction aimed at finding out how satisfied users in Germany are with the search results in general. Their perceived degree of satisfaction was to be indicated on a Likertfive-point scale from ‘highly satisfied’ to ‘highly dissatisfied’. The respondents’ opinions are illustrated in Figure 11.
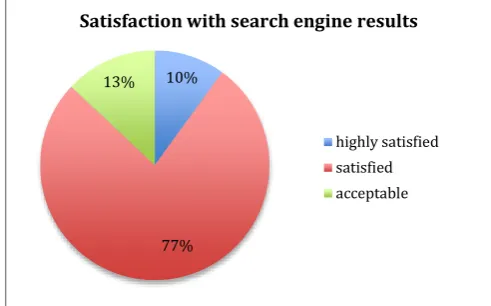
Figure 11. User-perceived satisfaction with the search results in general.
The findings show that the users’ satisfaction with the search engine results is generally good.The majority of 77% find themselves generally ‘satisfied’ with the listings. A much smaller group of 13% considers the search results to be ‘acceptable’. 10% of the respondents, on the other hand, are ‘highly satisfied’ with what the search engine returns in response to a search query. None of the respondents were ‘dissatisfied’ or ‘highly dissatisfied’ with the search results. Summing up these results leads to the suggestion that around 87% (highly satisfied and satisfied) of the searchers consider the retrieved documents adequate to match their information need. They find what they are looking for on the web– most of the time and without any particularsearch effort, as this would reduce the satisfaction levels.
Search engine satisfaction was also examined in the 2005 study. Schmidt-Mänz and Bomhardt (2005) found that the respondents are usually satisfied with the search results. They mention that 43% of the surveyed users were able to regularly satisfy their information needs. Based on this number, one may assume that the degree of search satisfaction has more than doubled over the last decade. This may be attributed to both an improved search engine performance and better information seeking capacities on the part of the users.
5.6.2 Satisfaction with the Search Results on the First Page
Statistics and studies regarding view and click frequencies of search results – with and without ads – have been mentioned at the beginning of this paper. The top three listings on the results page are clicked the most, and many studies found that users tend to view only those results which are visible without having to scroll down. The present study was interested in the users’ personal assessment of their level of satisfaction with the results displayed on the first page. Therefore, the respondents were to indicate how often they find the desired information on the first page already and do not consult any more pages. The response of how often they find the wished for result on the first page was to be given on a graded five-point scale from ‘always’ to ‘never’. Figure 12 visualizes the results.
37%
50%
13%
0% 0%
Necessity for query rephrasing
always often sometimes seldom never
10%
77% 13%
Satisfaction with search engine results
Figure 12. User-perceived satisfaction with the search results on the first page.
More than half of the users (53%) are ‘often’ happy with the listings on the first page so that there is no need for them to look any further. The second largest group of users (33%) ‘sometimes’experiences this situation. 7% feel ‘always’ satisfied with the suggested links on the first page, and another 7% find themselves ‘seldom’ content with the first page results. These findings suggest that altogether 86% do only view and click links provided on the first page on quite a regular basis. Results on the second and the subsequent pages receive less attention and are basically more unlikely to be consulted. In this respect, the users’ personal assessment of their own search behavior coincides with what analytical studies have found.
5.6.3 Satisfaction with German versus English Search Queries
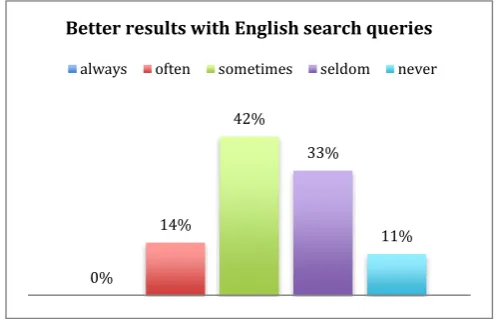
The final question regarding user satisfaction referred to the language preferences for search queries. This question was selected to investigate whether the users have the impression to obtain better search results when searching in English than when searching in German. Therefore, they were to indicate their personal opinion about achieving better search results with English search queries on aLikert five-point scale from ‘always’ to ‘never’. The findings are shown in Figure 13.
Figure 13. User-perceived quality of English search queries versus German search queries.
Most of the answersto this question are located in the mid-section: the majority of users (42%) believe that English search queries occasionally produce better results than German ones. The second largest group of 33% ticked ‘seldom’. 11% think that using the English language ‘never’ leads to better results. On the other hand, 14% experience
that English search terms ‘often’ bring about better search results. The users’ contentment with German search resultsexplains why 97% of the respondents search exclusively in German (Section 6.5.2). The reason why Germanspeakers search comparably less often in English and are not more satisfied with English search results than speakers of other languages,for example Arabic (Gross, 2014), may be due to theavailability of documents in German on the web. German is with 5.5% the thirdly most used language on the internet,after English with 53.3% and Russian with 6.4% (W3Tech.com, 2016). Hence, with the multitude of websites providing information in the German language there is no shortage of information that might force German searchers to turn to another language in order to be able to retrieve relevant information.
6.CONCLUSION
The study examined search engine behavior and satisfaction from a user perspective with the help of an anonymous survey that was conducted among 70 students at a university in Germany. The survey responses confirm that search engines are one of the most used services on the internet: allparticipantsare in the habit of accessing a search engine either on a frequent or a very frequent basis. Thecomparison with previous studies suggests that search engine usage frequencies have risen considerably during the last decade. Whereas in 2003, only 8% of the users searched the web on a daily basis (Machill&Welp, 2003), 73% of the users turned to an IR system already several times a day in 2005 (Schmidt-Mänz&Bomhardt, 2005). Google search services are the most popular sources for information seekingamong the students. For 87%, Google.de is the preferred search engine, and for many itis the only search engine to use. This is followed by Google.com with 13%, and the German version of Google Scholar with 10%. The fact that altogether 110% (due to the multiple answer possiblefor that question) named a Google search service as their number one web portal for information seeking shows that Google was able to significantly strengthen its leading market position within the considered period of time. Bing.de received another 10% of the user votes. Thelast place was shared between Yahoo.de, Duckduckgo.com, Ixquick.com, and Ecosia.org. The largestgroup of users (83%) considers the precision of the results as the most important criterion to select a search engine.Most of the users (84%) use their search engine in the default German language setting; 13% vary between German and English. 97% of the respondents search exclusively in the German language. Altogether 75% of the users believe that English search queries occasionally or seldom produce better results than German ones. Repetitive searches turned out to be a major part of the search process: 87% of the users repeat a search process on a frequent or occasional basis before their information need is satisfied. Query rephrasing is one of the most common strategies: 87% of the participants make use of it on a regular basis. The satisfaction level with the search results in general is good. The survey results also confirm that users seldom look further than the first page of the search results. 60% of the respondents are most of the time content with what they find on page one.
7%
53%
33%
7%
0% Satisfaction with 1st page results
always often sometimes seldom never
0%
14%
42%
33%
11% Better results with English search queries
[image:10.595.33.281.528.687.2]7.REFERENCES
[1] ACSI. (2014). ACSI E-Business Report 2014. Retrieved from http://www.theacsi.org/images/stories/images/reports/14jul_E -Business-Report.pdf
[2] ACSI. (2015). ACSI E-Business Report 2015. Retrieved from http://www.theacsi.org/news-and-resources/customer- satisfaction-reports/reports-2015/acsi-e-business-report-2015/acsi-e-business-report-2015-download
[3] Advanced Web Ranking. (2014). Google organic CTR study 2014. Retrieved from
https://www.advancedwebranking.com/ebooks/Google-Organic-CTR-Study-2014.pdf
[4] Bailey, P., & Thomas, P. (2007). Does brandname influence perceived search result quality? Yahoo!, Google, and WebKumara. Proceedings of ADCS, 88–91.
[5] BibliographischesInstitut GmbH. (2016). Googeln. Retrieved from http://www.duden.de/rechtschreibung/googeln [6] Breithut, J. (2015). Suchmaschinen-Marktanteile: Google
verliert, Yahoo gewinnt. Spiegel Online. Retrieved from http://www.spiegel.de/netzwelt/web/firefox-standardsuche-google-verliert-marktanteile-yahoo-gewinnt-a-1012078.html [7] Broder, A. (2002). A taxonomy of web search.
SIGIR Forum, 36(2), 3–10.
[8] Buscher, G., Dumais, S. T., &Cutrell, E. (2010). The good, the bad, and the random: an eye-tracking study of ad quality in web search.Proceedings of the 33rd International ACM SIGIR Conference on Research and Development in Information Retrieval(SIGIR’10), 42–49.
[9] Buys, J. (2010). DuckDuckGo: a new search engine built from Open Source. Retrieved from
http://ostatic.com/blog/duckduckgo-a-new-search-engine-built-from-open-source
[10] Czajka, S. (2011).Internetnutzung in privatenHaushalten in Deutschland.StatistischesBundesamt, Wirtschaft und Statistik, August 2011, 709-718.
[11] D’Onfro, J. (2015, April 19). Google is making a giant change this week that could crush millions of small businesses.
Business Insider. Retrieved from
http://www.businessinsider.com/google-mobilegeddon-2015-4?IR=T
[12] DuckDuckGo. (2014). Escape your search engine’s filter bubble. Retrieved from http://dontbubble.us
[13] DuckDuckGo. (2015). Sources. Retrieved from https://duck.co/help/results/sources
[14] EuroPriSe. (2015). EuroPriSe: privacy-friendly internet search with Ixquick and Startpage reaffirmed. Retrieved from
https://www.ixquick.eu/eng/press/europrise-reaffirmed.html?hmb=1
[15] Fischetti, M. (2013). Search the web, plant a tree – every minute. Scientific American. Retrieved from
http://blogs.scientificamerican.com/observations/search-the-web-plant-a-treeevery-minute/
[16] Flick, U. (2009). An introduction to qualitative research (4th ed.). London, UK: SAGE Publication.
[17] GfK/SirValuse. (2008). Suchverhalten in
Deutschland.EineAnalyse von Suchmaschinen-Nutzern. Retrieved from
http://www.trendstudio.it/wp- content/uploads/2011/11/Suchverhalten_in_Deutschland_-_Eine_Analyse_von_Suchmaschinen-Nutzern.pdf [18] Google, Inc. (2015). Triggering answer boxes. US Patent
20150169750 A1 from June 18, 2015. Retrieved from https://www.google.com/patents/US20150169750 [19] Granka, L., Joachims, T., & Gay, G. (2004).Eye-tracking
analysis of user behavior in WWW search.Proceedings of the 27th Annual International ACM SIGIR Conference on Research and Development in Information
Retrieval(SIGIR’04), 478-479.
[20] Gross, A. M. (2014). Search engine behavior and satisfaction of Arab students from a user perspective. International Journal of Computational Linguistics Research 5(3), 85-98. [21] Hearst, M. A. (2009).Search user interfaces. Cambridge, UK:
Cambridge University Press.
[22] Huang, J. &Efthimiadis, E. N. (2009). Analyzing and evaluating query reformulation strategies in web search logs.
Proceedings of the 18thACM Conference on Information and Knowledge Management (CIKM’09), 77-86.
[23] Ingwersen, P., &Järvelin, K. (2006). The turn: integration of information seeking and retrieval in context. Berlin, Germany: Springer Science & Business Media.
[24] InternetLiveStats. (2016). Internet users by country (2016). Retrieved from http://www.internetlivestats.com/internet-users-by-country/
[25] Janetzko, G., Hildebrandt, M.,& Meyer, H.
(2002).DasexperimentalpsychologischePraktikumim Labor und WWW.Göttingen, Germany: HogrefeVerlag.
[26] Jansen, B. J., &Spink, A. (2006). How are we searching the World Wide Web? A comparison of nine search engine transaction logs.Information Processing &
Management,42(1), 248-263.
[27] Jansen, B. J., Spink, A., Bateman, J., &Saracevic. T. (2000). Real life, real users, and real needs: a study and analysis of user queries on the web. Information Processing and Management, 36(2), 207- 227.
[28] Jansen, B.J., Zhang, M., & Schultz, C. D. (2009). Brand and its effect on user perception of search engine performance.
Journal of the American Society for Information Science and Technology, 60(8), 1572–1595.
[29] Joachims, T., Granka, L., Pan, B., Hembrooke, H.,& Gay, G. (2005). Accurately interpreting clickthrough data as implicit feedback. Proceedings of the 28th Annual International ACM SIGIR Conference on Research and Development in
Information Retrieval (SIGIR’05), 154-161.
[30] Lewandowski, D. (2013). Suchmaschinenindices. In D. Lewandowski (Ed.), Handbuch Internet-Suchmaschinen 3: SuchmaschinenzwischenTechnik und Gesellschaft (pp. 143– 161). Berlin, Germany: AkademischeVerlagsgesellschaft AKA.
[31] Lewandowski, D. (2014). Wielässtsich die Zufriedenheit der SuchmaschinennutzermitihrenSuchergebnissenerklären? In H. Krah, & R. Müller-Terpitz (Eds.),Suchmaschinen.
PassauerSchriftenzurinterdisziplinärenMedienforschung, Band 4 (pp. 35-52). Berlin, Germany: Logos Verlag. [32] Lutzky, C., &Teichmann, M.-H. (2002). Logfiles in der
Marktforschung:
GestaltungsoptionenfürAnalysezwecke.InGfKNürnberg, GesellschaftfürKonsum-, Markt- und Absatzforschunge.V (Eds.), Jahrbuch der Absatz- und Verbrauchsforschung 48
(pp. 295 – 317).
[33] Machill, M., &Welp, C. (2003).WegweiserimNetz: Qualität und Nutzung von Suchmaschinen.Gütersloh, Germany: Bertelsmann Stiftung.
[34] Marchionini, G. (2006). Exploratory search: from finding to understanding, Communications of the ACM 49(4), 41-46.
[35] Massand, B.,&Spiliopolou, M. (2000). Web usage analysis and user profiling:International WEBKDD'99 Workshop San Diego, CA, USA, August 15, 1999 Revised Papers. Berlin, Germany: Springer.
[36] Purcell, K., Brenner, J., &Raine, L. (2012). Search engine use 2012. Pew Internet & American Life Project. Retrieved from http://pewinternet.org/~/media/Files/Reports/2012/PIP_Searc h_Engine_Use_2012.pdf
http://venturebeat.com/2014/06/11/duckduckgo-yummly-team-up-so-you-can-search-food-porn-in-private/ [38] Schmidt-Mänz, N. (2007).Untersuchung des
Suchverhaltensim Web: Interaktion von
InternetnutzernmitSuchmaschinen.Hamburg, Germany: Dr. KovacVerlag.
[39] Schmidt-Mänz, N., &Bomhardt, C. (2005). WiesuchenOnlinerim
Internet?.AbsatzwirtschaftScienceFactory 2, 5-8. [40] SEO-united.de.(2016) Suchmaschinenverteilung in
Deutschland. Retrieved from http://www.seo-united.de/suchmaschinen.html
[41] Shapiro, J. &Taksa, I. (2003). Constructing Web search queries from the user’s information need expressed in a natural language. Proceedings of the 2003 ACM Symposium on Applied Computing (SAC’03), 1157-1162.
[42] Spink, A. (2004). Web search: public searching on the web.Dordrecht, Netherlands: Kluwer Academic Publishers.
[43] Spink, A. & Jansen, B. J. (2004). A study of web search trends.Webology, 1(2). Retrieved from
http://www.webology.org/2004/v1n2/a4.html [44] Statista. (2016). Anteil der Suchanfragenim Internet
nachAnzahleingegebenerSuchbegriffe in Deutschland imJanuar 2016. Retrieved from
http://de.statista.com/statistik/daten/studie/413369/umfrage/an zahl-der-keywords-pro-suchanfrage-deutschland/
[45] Van Deursen, A.J.A.M., & van Dijk, J.A.G.M. (2009). Using the internet: skill related problems in users’ online behavior.
Interacting with Computers, 21(5), 393-402. doi:10.1016/j.intcom.2009.06.005
[46] Van Eimeren, B., & Frees, B. (2012). ARD/ZDF-Onlinestudie 2012: 76 Prozent der Deutschen online –
neueNutzungssituationendurch mobile Endgeräte.Media Perspektiven, 7-8, 362– 379.
[47] W3Tech.com. (2016). Usage of content languages for websites. Retrieved from
https://w3techs.com/technologies/overview/content_language/ all
8.LIST OF TABLES
Table 1. Demographic data of the survey respondents.
9.LIST OF FIGURES
Figure 1. Click-through rates (CTR) of organic searches in Google on desktop and mobile devices. [Graph], based upon data from Advanced Web Ranking. (2014). Google organic CTR study 2014. Retrieved from
https://www.advancedwebranking.com/ebooks/ Google-Organic-CTR-Study-2014.pdf
Figure 2. Click-through rates (CTR) of organic searches in Google with and without ads. [Graph], based upon data from Advanced Web Ranking. (2014). Google organic CTR study 2014. Retrieved from
https://www.advancedwebranking.com/ebooks/ Google-Organic-CTR-Study-2014.pdf
Figure 3. Search engine market share in Germany as of March 2016. [Graph], based upon data from SEO-united.de. (2016).
Suchmaschinenverteilung in Deutschland. Retrieved from
http://www.seo-united.de/suchmaschinen.html. Figure 4. Search engine usage frequency.
Figure 5. Mostly used search engines (multiple answers possible).
Figure 6. User priorities for search engine selection.
Figure 7. Mostly used search engine interface languages. Figure 8. Mostly used search query languages.
Figure 9. User-perceived necessity to run several searches before achieving information need satisfaction. Figure 10. User-perceived necessity for query rephrasing. Figure 11. User-perceived satisfaction with the search
results in general.
Figure 12. User-perceived satisfaction with the search results on the first page.