Unsupervised Classification of Dialogue Acts using a Dirichlet Process
Mixture Model
Nigel Crook, Ramon Granell, and Stephen Pulman Oxford University Computing Laboratory
Wolfson Building Parks Road, OXFORD, UK
[email protected] [email protected]
Abstract
In recent years Dialogue Acts have be-come a popular means of modelling the communicative intentions of human and machine utterances in many modern di-alogue systems. Many of these systems rely heavily on the availability of dialogue corpora that have been annotated with Di-alogue Act labels. The manual annota-tion of dialogue corpora is both tedious and expensive. Consequently, there is a growing interest in unsupervised systems that are capable of automating the annota-tion process. This paper investigates the use of a Dirichlet Process Mixture Model as a means of clustering dialogue utter-ances in an unsupervised manner. These clusters can then be analysed in terms of the possible Dialogue Acts that they might represent. The results presented here are from the application of the Dirichlet Pro-cess Mixture Model to the Dihana corpus.
1 Introduction
Dialogue Acts (DAs) are an important contribu-tion from discourse theory to the design of di-alogue systems. These linguistics abstractions are based on the illocutionary force of speech acts (Austin, 1962) and try to capture and model the communicative intention of human or ma-chine utterances. In recent years, several dia-logue systems have made use of DAs for mod-elling discourse phenomena in either the Dialogue Manager (Keizer et al., 2008), Automatic Speech Recogniser (Stolcke et al., 2000) or the Auto-matic Speech Synthesiser (Zovato and Romportl, 2008). Additionally, they have been used also in
other tasks such as summarisation, (Murray et al., 2006). Therefore, a correct DA classification of di-alogue turns can bring benefits to the performance of these modules and tasks.
clus-tering most utterances according to speaker, level 1 and in some cases level 2 DA annotations (see below).
2 The Dihana corpus
The Dihana corpus consists of human-computer spoken dialogues in Spanish about queuing infor-mation of train fares and timetables. The acquisi-tion was performed using the Wizard of Oz (WoZ) technique, where a human simulates the system following a prefixed strategy. User and system utterances are different in nature, user utterances are completely spontaneous speech whereas sys-tem utterances are based on pre-written patterns that the WoZ selected according to what the user said in the previous turn, the current dialogue state and the WoZ strategy. There is a total of 900 dia-logues with a vocabulary of 823 words. However, after applying a process of name entity recognition (cities, times, number, ...) and making the distinc-tion between system and user words there are 964 different words. The same process of name en-tity recognition was also used by Martinez Hinare-jos (Mart´ınez-HinareHinare-jos et al., 2008)
2.1 Annotation scheme
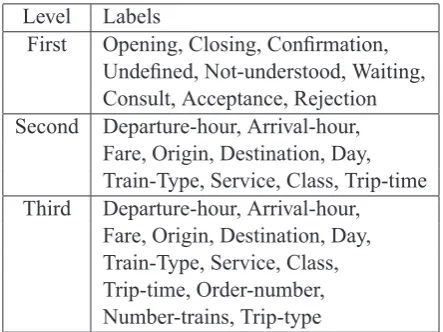
Dialogues were manually annotated using a dia-logue act annotation scheme based on three lev-els (see Table 1). The first level corresponds to the general intention of the speaker (speech act), the second level represents the implicit informa-tion that is referred to in the first level and the third level is the specific data provided in the utterance. Using these three levels and making the distinc-tion between user and system labels, there are 248 different labels (153 for the user and 95 for the sys-tem). Combining only first and second level there are 72 labels (45 for user and 27 for system), and with only first level there are 16 labels (7 for user and 9 for system).
Annotation was done at utterance level. That is, each dialogue turn was divided (segmented) into utterances such that each one corresponds to a unique DA label. An example of the segmentation and annotation of two turns of a dialogue can be seen in Figure 1
3 Dirichlet Process Mixture Models This paper present a Dirichlet Process Mixture Model (DPMM) (Maceachern and M¨uller, 1998; Escobar and West, 1995; Antoniak, 1974) for the
Level Labels
First Opening, Closing, Confirmation, Undefined, Not-understood, Waiting, Consult, Acceptance, Rejection Second Departure-hour, Arrival-hour,
Fare, Origin, Destination, Day, Train-Type, Service, Class, Trip-time Third Departure-hour, Arrival-hour,
Fare, Origin, Destination, Day, Train-Type, Service, Class, Trip-time, Order-number, Number-trains, Trip-type
Table 1: Set of dialogue act labels used in the Di-hana corpus
automatic, unsupervised clustering of the utter-ances in the Dihana corpus. This approach treats each utterance as abag of words(i.e. an unordered collection of words) (Sebastiani, 2002). Utter-ances are clustered according to the relative counts of word occurrences that they contain so that utter-ances with similar histograms of word counts will, in general, appear in the same cluster.
Speaker Utterance Transcription
Level 1 Level 2 Level 3
S S1 Welcome to the railway information system. How may I help you?
Opening Nil Nil
U U1 Could you tell me the departure times from Valencia Question Departure-hour Origin U2 to Madrid .
Question Departure-hour Destination
Figure 1: An example of some turns from an annotated dialogue of DIHANAcorpus.
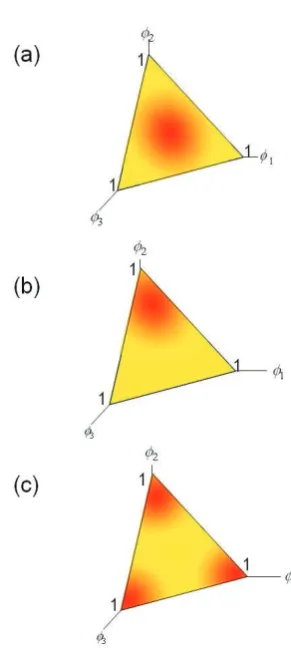
Figure 2: A 3-simplex with two examples points and the corresponding distributions
3.1 Finite Bayesian Mixture Models
A Dirichlet distribution is defined as a measure on measures. Specifically, a Dirichlet distribution defines a probability measure over thek-simplex. Thek-simplex is a convex hull constructed so that each point on the surface of the simplex describes a probability distribution overkoutcomes:
Qk={(x1, . . . , xk) :xi ≥0
∀i∈ {1. . . k},
k
X
i=1
xi= 1}
Figure 2 shows a 3-simplex with two example points and the corresponding distributions. The Dirichlet distribution places a probability measure over thek-simplex so that certain subsets of points on the simplex (i.e. certain distributions) have higher probabilities than others (Figure 3). The probability measure in the Dirichlet is parame-terised by a set of positive, non-zero concentra-tion constantsα ={α1, . . . αk :αi >0}, written
Dirichletk(α1, . . . αk). The effects of different
values ofαfor the 3-simplex are shown in Figure 3.
The probability density function of the Dirichlet
distribution is given by:
Dirichletk(α1, . . . , αk) =f(x1, . . . , xk;α1, . . . , αk)
= Γ( Pk
i=1αi)
Qk
i=1Γ(αi) k
Y
i=1 xai−1
i
whereΓ(x) (= R∞ 0 t(x
−1)e−tdt)extends the
fac-torial function to the real numbers. Since a draw from a Dirichlet distribution (written β ∼
Dirichletk(α)) gives a distribution, a Dirichlet can be used as the prior for a Bayesian finite mix-ture model:
β∼Dirichletk(α1, . . . , αk)
β is a distribution over the k components φ of the finite mixture model. Each componentφzi is
drawn from a base measureG0 (φzi ∼ G0). The
choice of distribution G0 depends on the nature of the data to be clustered; with data that is rep-resented using the bag of words model,G0 must generate distributions over the word vocabulary. Hence the Dirichlet distribution is an appropriate choice in this case:
φzi ∼Dirichletv(α1, . . . , αv)
wherevis the size of the vocabulary.
For each data point (utterance)xi a component
φzi is selected by a drawzifrom the multinomial
distributionβ:
zi∼M ultinomialk(β)
A suitable distributionF(φzi)is then used to draw
the data point (utterance). In the bag of words model, the multinomial distribution is used to draw the words for each data pointxi:
xi ∼M ultinomialv(φzi)
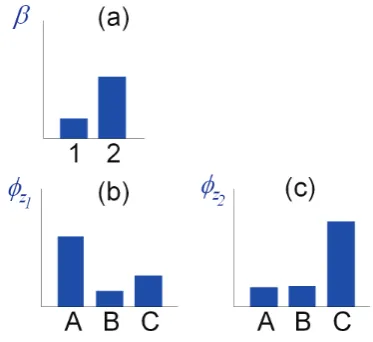
A small example will illustrate this generative process. Imagine that there are just two types of utterances with a vocabulary consisting sim-ply of the words A, B and C. A finite Bayesian mixture model in this case would first draw β from a suitable Dirichlet distribution (e.g. β ∼
Dirichlet2(0.5,1)) as, for example, is shown in Figure 4(a). Next the two components φz1 and
φz2 would be drawn from a suitable base
distribu-tion G0 (e.g. φz1 ∼ Dirichlet3(1,0.5,0.5)and
φz2 ∼ Dirichlet3(0.5,0.5,1), see Figure 4(b)
and 4(c)). In this case, φz1 will tend to generate
Figure 4: An example finite Bayesian mixture model. (a) The prior distribution over components φz1 (b) andφz2 (c)
utterances containing more occurrences of word A than B or C, whilst φz2 will tend to
gener-ate utterances with more C’s than A’s or B’s. A component zi is then selected for each utterance
(zi ∼ M ultinomialk(β)). Note that in this
ex-ample, the distributionβwould lead to more utter-ances generated byφz2 than byφz1. Suppose that
five utterances are to be generated by this model and that the components for each utterance are z1 = 1, z2 = 2, z3 = 2, z4 = 1 andz5 = 2. The words in each utterance are then generated by repeated draws from the corresponding com-ponent (e.g. x1 = ACAAB, x2 = ACCBCC, x3 =CCC,x4=CABAACandx5 =ACC).
3.2 Dirichlet Processes
a stick of unit length, random portionsβ′
kare
re-peatedly broken off the stick, with each part that is broken off representing the proportion of prob-ability assigned to a component:
β′
The Dirichlet Process mixture model can now be specified as:
β∼GEM(α) φzi∼G0 zi ∈(1. . .∞)
zi∼M ultinomial(β) xi∼F(φzi)
3.3 Chinese Restaurant Process
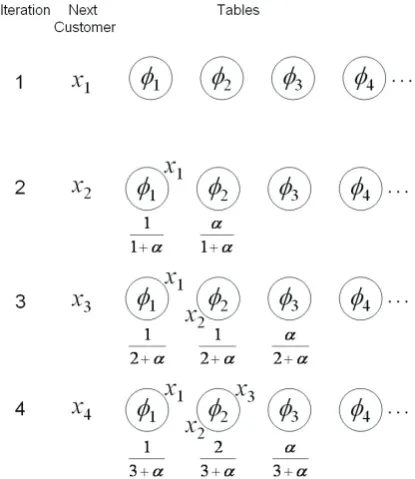
The Chinese Restaurant Process (CRP) is a popu-lar Dirichlet Process paradigm that has been suc-cessfully applied to many clustering problems. In the CRP, one is asked to imagine a Chinese restau-rant with an infinite number of tables. The cus-tomers enter the restaurant and select, according to a given distribution, a table at which to sit. All the customers on the same table share the same dish. In this paradigm, the tables represent data clusters, the customers represent data points (xi) and the
dishes represent components (φz). As each
cus-tomer (data point) enters the restaurant the choice of which table (cluster) and therefore which dish (component) is determined by a draw from the fol-lowing distribution:
where α is the concentration parameter for the CRP. The summation over the δφj’s counts the
number of customers sat at each of the occupied tables. The probability of sitting at an already oc-cupied table, therefore, is proportional to the num-ber of customers already sat at the table, whilst the probability of starting a new table is proportional toαG0. Figure 5 illustrates four iterations of this initial clustering process.
Once all the customers (data points) have been placed at tables (clusters), the inference process begins. The posteriorp(β,φ,z|x)cannot be cal-culated exactly, but Gibbs sampling can be used. Gibbs sampling for the CRP involves iteratively removing a randomly selected customer from their table, calculating the posterior probability distri-bution across all the occupied tables together with a potential new table (with a randomly drawn dish,
Figure 5: The first four steps of the initial cluster-ing process of the CRP. The probability distribu-tion over the tables is also shown in each case.
i.e. component), and making a draw from that dis-tribution to determine the new table for that cus-tomer. The posterior distribution across the tables is calculated as follows:
φi|φ1, . . . ,φi−1,x
malising constant. After a predetermined number of samples, the dish (component) of each occupied table is updated to further resemble the customers (data points) sitting around it. In thebag of words
approach used here, this involves converting the histogram of word counts in each customer (utter-ance) sitting at the table into an empirical distribu-tion H(xi), taking the average of these empirical
distributions and modifying the dish (component) to further resemble this distribution:
table i. The inference process continues to it-erate between Gibbs sampling and updating the table dishes (components) until the process con-verges. Convergence can be estimated by observ-ingnconsecutive samples in which the customer was returned to the same table they were taken from.
4 Results
The CRP with Gibbs sampling was used to clus-ter both user and system utclus-terances from the 900 dialogues in the Dihana corpus. Each utterance is treated as an independent bag of words where all information about the dialogue that it came from and the context in which it was uttered is ignored during training. Intra-cluster and inter-cluster sim-ilarity measures were used to evaluate the resulting clusters. Intra-cluster similarity S′
i is calculated
by averaging the Euclidean distance between ev-ery pair of data points in the clusteri:
S′
Inter-cluster similarity S′′
is calculated by sum-ming the Euclidean distance between the centroids of all pairs of clusters:
S′′
where Ci is the centroid of clusteriandnis the
number of clusters.
Two classification error measures were also used, one from the cluster (table) perspectiveE′
, and the other from the perspective of the Dialogue Act (DA) annotations (first level) of the Dihana corpusE′′
. The cluster classification error of ta-bleiis calculated by summing up the occurrences of each DA on the table, finding the DA with the largest total and allocating that DA as the correct classification for that table Di. The number of
false positivesfip for that table is the count of all customers (utterances) with DA annotations not in Di. The number of false negativesfinis the count
of utterances with labelDi that occur on other
ta-bles. The cluster classification error for tableiis therefore:
The DA classification errorE′′
i measures how
well DAihas been clustered, using the size of the
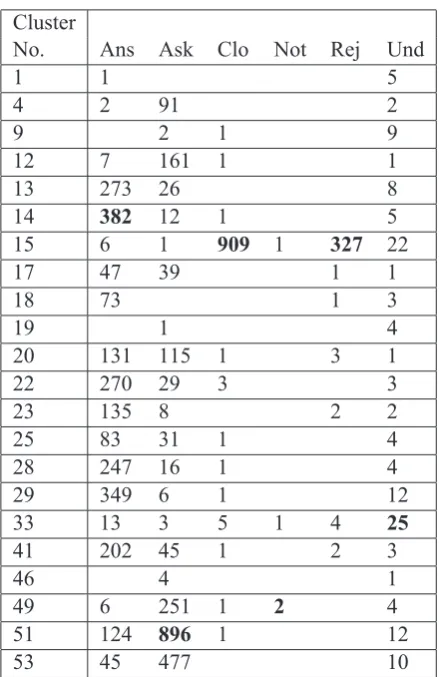
Cluster
Table 2: Clusters of user utterances, with the counts for each level 1 speech act. The largest cluster for each speech act is in bold. The abbrevi-ations are: Und=Undefined, Ans=Answering, Ask =Asking, Clo=Closing, Rej =Rejection, Not=Not-understood.
DA classNic, the size of the largest cluster of utter-ances from that DA classMic, and the total number of utterancesnin the corpus:
E′′
Table 6 summarises the results from three sep-arate runs of the CRP, each increasing in number of epochs. It should be noted here that the Dihana corpus has 72 DA categories, so the ideal number of clusters discovered by the CRP would be 72. It should also be noted that given an initial random clustering, a good clustering algorithm will reduce intra-cluster similarity (S¯′), increase inter-cluster similarity (S′′
Epochs (K) No. Clusters S¯′ S′′ ¯
E′ E¯′′
0 70 99703.6 243.74 0.05303 0.00979
1000 44 14975.4 217.56 0.01711 0.00385 1500 54 10093.7 336.15 0.01751 0.00435
Figure 6: The results from three separate runs of the CRP on utterances from the Dihana corpus. Cluster similarity measures and classification error values are shown after 0 (i.e. random clustering), 1000K, and 1500K epochs.S¯′,E¯′andE¯′′are averaged values.
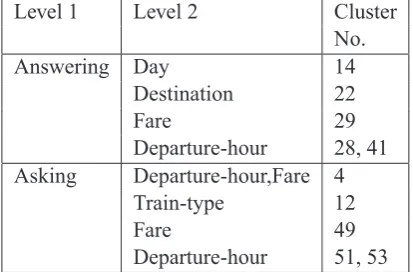
Level 1 Level 2 Cluster
No.
Answering Day 14
Destination 22
Fare 29
Departure-hour 28, 41 Asking Departure-hour,Fare 4
Train-type 12
Fare 49
Departure-hour 51, 53
Table 3: Clusters that have specialised on level 1 and level 2 annotations.
5 Discussion
The first row of the table in Figure 6 shows the cluster similarity measures and classification er-rors after 0 epochs of the inference procedure (i.e. for a random clustering of utterances). This gives a baseline for the measures and error values used in subsequent runs. The second row of values shows the results after a run of 1000K epochs of the in-ference procedure. This run finds only 44 clusters but has a much lower value forS¯′than was found in the random clustering, showing a significant in-crease in the similarity between utterances within each cluster. Surprisingly, the value forS′′
is also reduced, showing that the differentiation between the clusters formed at this stage is even lower than there was with the random clustering. E¯′ andE¯′′ show suitable reductions indicating that the classi-fication errors are being reduced by the inference process. The third row of values show that after 1500K epochs 54 clusters have been found, intra-cluster similarity is increased beyond that for the random clustering, but the classification errors re-main essentially the same as for the 1500K run.
Although the 1500K epoch run found only 54 clusters, it was able to clearly distinguish between system and user utterances: with 30 clusters taining system utterances only, 22 clusters
con-taining user utterances only and 2 clusters contain-ing instances of both. Given that the system utter-ances in the Dihana corpus are generated from a restricted set of sentences, it is not surprising that these were easy to cluster and differentiate from user utterances. However, the CRP was also able to cluster user utterances well, which is more of a challenge. Table 2 shows the clusters that have specialised on user utterances, with the counts of the level 1 annotations in each case. The largest cluster for each level 1 annotation is shown in bold typeface. From here it can be seen that cluster 15 has specialised on bothClosingandRejection. It is not surprising that these fall within the same clus-ter since the words used in each are often the same (e.g. “No thank you” can act as either a closing statement or a rejection statement). Clusters 14, 22, 29, 28 and 41 have specialised to the Answer-ing annotation, whilst clusters 4, 12 49, 51 and 53 have specialised to Asking. Table 3 shows how each of these clusters have specialised to level 2 annotations. Cluster 14, for example, specialises on the Answering:Day pair, whilst 22 specialises on Answering:Destination pair.
These initial results show that, at least for the Dihana corpus, the DPMM can successfully clus-ter utclus-terances into Speaker, Level 1, and Level2 classes. Whilst this looks promising, it must be acknowledged that the Dihana corpus is restricted to train service inquiries and it remains unclear whether this approach will generalise to other di-alogue corpora with a broader range of topics and wider vocabularies. Future work will include in-vestigating the use of ngrams of words, syntactic features, the DAs of previous utterances and ex-perimentation with other corpora such as Switch-board (Godfrey et al., 1992).
Acknowledgments
European Commission as part of the Information Society Technologies (IST) programme under EC grant number IST-FP6-034434. We thank Jeff Bilmes (University of Washington) for many very helpful discussions about Dirichlet processes and their application.
References
Toine Andernach, Mannes Poel, and Etto Salomons. 1997. Finding classes of dialogue utterances with kohonen networks. InIn Daelemans, pages 85–94.
J.A. Andernach. 1996. A machine learning approach to the classification and prediction of dialogue utter-ances. InProceedings of the 2nd International Con-ference on New Methods in Language Processing, pages 98–109.
Charles E. Antoniak. 1974. Mixtures of dirichlet pro-cesses with applications to bayesian nonparametric problems.The Annals of Statistics, 2(6):1152–1174.
J.L. Austin. 1962. How to do things with words. Ox-ford: Clarendon Press.
Michael D. Escobar and Mike West. 1995. Bayesian density estimation and inference using mixtures. Journal of the American Statistical Association, 90(430):577–588.
Sheila Garfield and Stefan Wermter. 2006. Call clas-sification using recurrent neural networks, support vector machines and finite state automata. Knowl. Inf. Syst., 9(2):131–156.
J. J. Godfrey, E. C. Holliman, and J. Mcdaniel. 1992. SWITCHBOARD: telephone speech corpus for re-search and development. In Proc. ICASSP, vol-ume 1, pages 517–520 vol.1.
Gang Ji and J. Bilmes. 2005. Dialog act tagging using graphical models. InAcoustics, Speech, and Signal Processing, 2005. Proceedings. (ICASSP ’05). IEEE International Conference on, volume 1, pages 33– 36.
J.M.Bened´ı, E.Lleida, A. Varona, M.J.Castro, I.Galiano, R.Justo, I. L´opez, and A. Miguel. 2006. Design and acquisition of a telephone spontaneous speech dialogue corpus in spanish: Dihana. InFifth International Conference on Language Resources and Evaluation (LREC), pages 1636–1639, Genova, Italy, May.
S. Keizer, M. Gasic, F. Mairesse, B. Thomson, K. Yu, and S. Young. 2008. Modelling user behaviour in the his-pomdp dialogue manager. InIEEE SLT, pages 121–124, Dec.
Steven N. Maceachern and Peter M¨uller. 1998. Esti-mating mixture of dirichlet process models. Jour-nal of ComputatioJour-nal and Graphical Statistics, 7(2):223–238.
C. D. Mart´ınez-Hinarejos, J. M. Bened´ı, and R. Granell. 2008. Statistical framework for a span-ish spoken dialogue corpus. Speech Communica-tion, 50:992–1008.
Geoffrey Mclachlan and David Peel. 2000. Finite Mix-ture Models. Wiley Series in Probability and Statis-tics. Wiley-Interscience, October.
Gabriel Murray, Steve Renals, Jean Carletta, and Jo-hanna Moore. 2006. Incorporating speaker and discourse features into speech summarization. In Proceedings of the main conference on Human Lan-guage Technology Conference of the North Amer-ican Chapter of the Association of Computational Linguistics, pages 367–374, Morristown, NJ, USA. Association for Computational Linguistics.
J. Pitman and M. Yor. 1997. The two-parameter Poisson-Dirichlet distribution derived from a stable subordinator. Annals of Probability, 25(2):855–900.
J. Pitman. 2002. Combinatorial stochastic processes.
Fabrizio Sebastiani. 2002. Machine learning in au-tomated text categorization. ACM Comput. Surv., 34(1):1–47, March.
Andreas Stolcke, Noah Coccaro, Rebecca Bates, Paul Taylor, Carol Van Ess-Dykema, Klaus Ries, Eliza-beth Shriberg, Daniel Jurafsky, Rachel Martin, and Marie Meteer. 2000. Dialogue act modeling for automatic tagging and recognition of conversational speech. Comput. Linguist., 26(3):339–373.